Nutrition of the Rhododendron
Donald P. Watson and Al Kenworthy
Department of Horticulture, Michigan State University
|
|
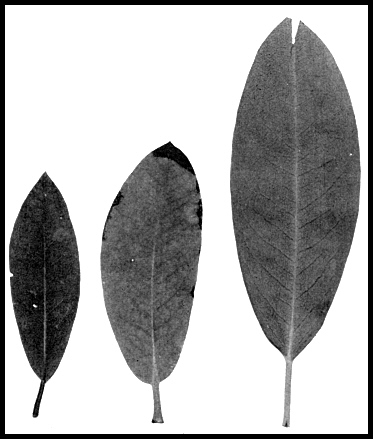
Fig. 13. Leaf samples taken from the experimental plants.
Watson photo |
Some months ago Mr. David G. Leach of Brookville, Pennsylvania, sent us samples of rhododendron leaves. Three of the leaves which were representative of the samples are shown in the accompanying photograph.
The first leaf on the left was from seedlings that were grown in a cold-frame. (Fig 13) These plants had received 100 pounds of superphosphate per 1,000 square feet in 1953; 3 3/4 pounds of FTE (Fritted Trace Elements) per 1,000 square feet in 1954.
The soil had a pH of 4.3. From the analysis of these leaf samples (which is represented in the accompanying table) it is apparent that the small leaves were a result of either a high magnesium or low calcium content.
The second, (Fig. 13) or center leaf represented field grown plants to which had been added 100 pounds of superphosphate per 1,000 square feet in 1952; three inches of partially decayed hard and softwood sawdust mixed with the soil, plus two inches of sawdust as a mulch and 60 pounds of ammonium sulfate per 1,000 square feet, broadcast at the time the field was prepared in 1952. Thirty pounds of ammonium sulfate per 1,000 square feet were supplied in 1953. The pH of this soil at the time of collection in May, 1956, was 4.0. The center leaf (Fig. 13) is a typical representation of injury from low magnesium and high nitrogen relationship. The accompanying table also shows that calcium, iron, and manganese are low and potash is especially high. These plants showed a dramatic improvement after being sprayed with magnesium sulfate.
|
Leaf Analysis
Rhododendrons Sample % Expressed on the oven-dry basis 1 |
||||||||||
| N | P | K | Ca | Mg | Mn | Fe | B | Cu | Zn | |
| Left | 1.22 | .25 | .610 | 1.05 | 1.13 | .0717 2 | .014 | .0043 | .0010 | .0005 |
| Center | 1.66 | .23 | 1.33 | .70 | .11 | .0493 2 | .011 | .0030 | .0012 | .0079 |
| Right | 1.33 | .25 | .432 | 1.40 | .34 | .0793 2 | .013 | .0039 | .0011 | .0070 |
| 1 Averages of results from replicated determinations. | ||||||||||
| 2 Obtained by extending the standard curve. | ||||||||||
The third leaf, the one on the right, was from a hillside plantation to which had been added per 1,000 square feet 100 pounds of superphosphate in 1950; 30 pounds of 5-10-5 in 1951; and 30 pounds of 5-10-5 in 1953. The pH at the time of collection in May was 4.4. The large leaf on the right represented a normal plant and is believed to have had an adequate supply of nutrients that were fairly well balanced. The plants were the most satisfactory in performance of those represented by the photographs anal the data.