Using DNA Sequences to Estimate Evolutionary Relationships Among Rhododendrons and Azaleas
Dr. Kathleen A. Kron
Ms. Shelley L. Johnson
Department of Biology
Wake Forest University
Winston-Salem, NC
The spectacular diversity of form and color within the genus
Rhododendron
naturally leads one to ask, "How are they related to each other?" The answer to this question is complicated by the enormous number of species in the genus and the continuous nature of much of the morphological variation that we observe within and between species.
Because of the morphological complexity in
Rhododendron
, some researchers have looked for additional data to help resolve the puzzle of evolutionary relationships. Using DNA sequences to help estimate relationships among rhododendrons and azaleas is a good idea, because DNA is the genetic code that is inherited from generation to generation of rhododendrons. Over time, some of the DNA sequences will accumulate mutations that are unique to specific groups of rhododendrons and azaleas. These uniquely shared changes in the DNA can be used to identify smaller closely related subgroups within the genus.
|
Choosing which region of DNA to use in an evolutionary study depends on several factors involving the evolutionary history of the plants and the specific characteristics of the DNA. It might help to think of the different regions of DNA as "snap-shots" of evolutionary time. For example, the DNA sequence of a protein coding gene usually doesn't change as quickly as the sequence in a non-coding region. This is because changes in the protein coding gene can easily result in a non-functional gene, whereas changes in a non-coding region would have little impact on the function of that region (e.g., as a space-holder between genes). Therefore if the species of interest are very closely related (or have recently or rapidly evolved), using a protein coding gene may not be very useful because of lack of sequence variation. In this situation using DNA sequence from a non-coding region may be more useful.
In my laboratory we use many different regions and/or genes to analyze evolutionary relationships in rhododendrons and other members of the blueberry family (
Ericaceae
). To look at relationships within the genus
Rhododendron
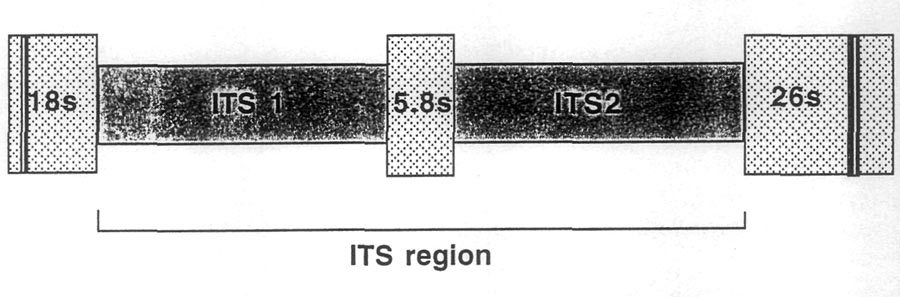
, we have been using a region of DNA found in the nucleus (there is also DNA in chloroplasts and mitochondria) that is composed of two short spacer sequences (i.e., non-coding) located on either side of a small gene that codes for one (of three) subunit(s) of the ribosome. The non-coding regions are referred to as the Internal Transcribed Spacer 1 (ITS1) and 2 (ITS2). These spacers sit on either side of the small (coding) 5.8s gene. On either side of this section of DNA are the 18s and 26s genes that also code for subunits of the ribosome (Fig. 1). The spacers plus the 5.8s gene are collectively referred to as the ITS region. This region is about 700 bases long in the rhododendrons and azaleas (and also in most other flowering plants).
|
| Fig. 1 Diagram of the internal transcribed spacer region (ITS) in the nuclear ribosomal DNA. |
Recent technological advances in molecular biology make the use of DNA sequences in evolutionary studies practical (although expensive). DNA can be extracted from very small amounts of leaf material and stored in a freezer for years. Specific regions of DNA can be targeted and replicated using specially designed enzymes and tightly controlled temperature conditions. In my lab we have extracted DNA from more than 200 species of Rhododendron . We have also replicated and sequenced the ITS region of about 40 of these species that represent the major groups within the genus. These sequences are then aligned so that base changes can be compared from one species to another (Fig. 2). The DNA sequences of these regions are analyzed using a software package (PAUP 3.1.1) that constructs trees (or cladograms) based on the shared unique base changes found among the different species of Rhododendron when compared to a closely related species outside of Rhododendron . The shortest (most parsimonious) tree is used [Occam's Razor - the simplest (or shortest) explanation is the preferred one].
| retusum | ttcacattcgtgctcggtcggcctaaaaatgacggtccccgatgatggacatcacg |
| konori | ttcacattTgtgctcggtTggcctaaaaGtgacggtccccgatgatggacatcacg |
| javanicum | ttcacattcgtgctcggtcggcctaaaaatgacggtccccgatgaCggacatcacg |
| kawakamii | ttcacattcgtgctcggtcggcctaaaaatgacggtccccgatgaAggacatcacg |
| santapaui | ttcacattcgtgctcggtcggcctaaaaatgacggtccccgatgaCggacatcacg |
| pendulum | ttcacattTgtgctcggtcggcctaaaaatgacggCccccgatgaCggacatcacg |
|
Figure 2. Portion of the ITS data matrix for six species of
lepidote rhododendrons. Letters in uppercase indicate changes in the sequence (mutations). |
|
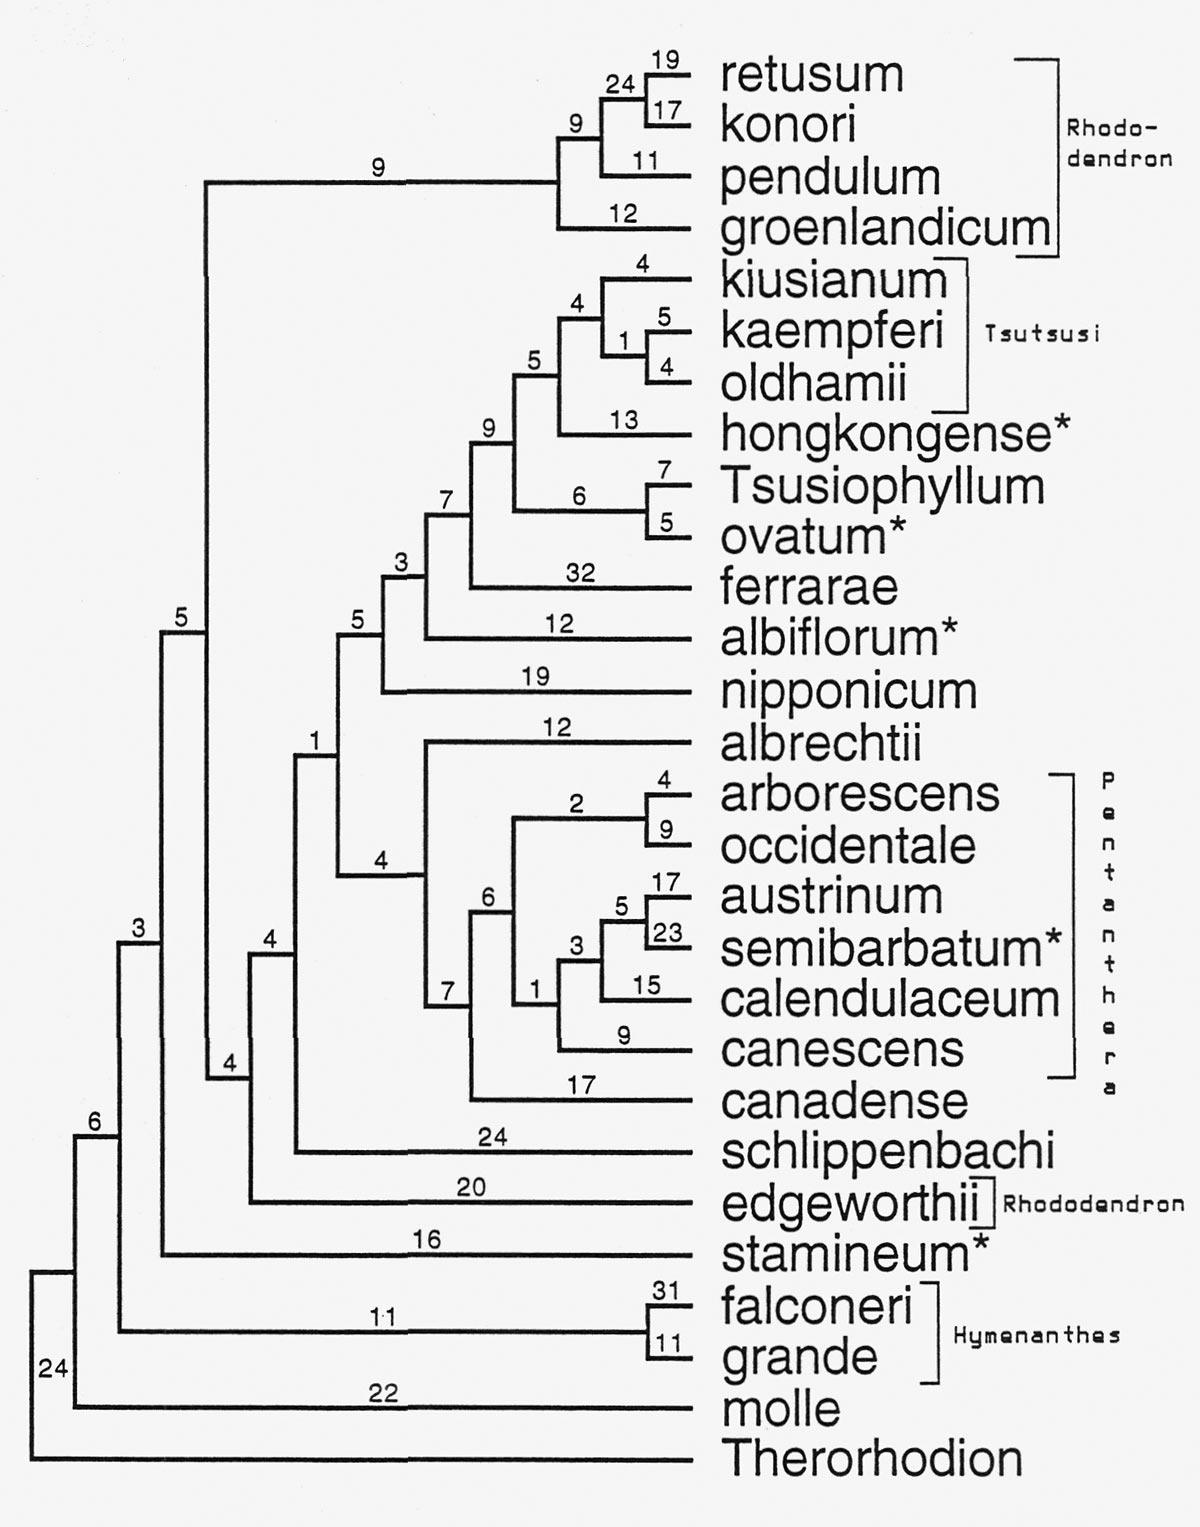
Figure 3 shows an example of a tree constructed using ITS sequences for several species of Rhododendron . We have used the ITS sequence of Therorhodion camschaticum (sometimes included in Rhododendron ) as a comparison sequence. We are confident that this is an appropriate comparison group because of our other studies that used protein coding genes (Kron, 1997; and unpublished data) and morphology (Kron and Judd, 1990) and sampled a number of different genera within the subfamily Rhododendroideae . These studies show that Therorhodion is outside of, yet closely related to, the remaining members of Rhododendron .
|
|
Fig. 3 An example tree produced from the analysis of several
Rhododendron
ITS sequences. Numbers above the branches
indicate the number of changes in the DNA sequence. Names with an asterisk indicate the "lateral-flowered azaleas." |
Because the ITS region is not functionally tied to any specific morphological character it is a reasonable first test of the previously suggested evolutionary relationships based on flower, leaf, and other morphological attributes. In this tree several groups that are currently recognized within the genus
Rhododendron
can be seen. These include
R.
sub-genus
Hymenanthes
,
R.
sect.
Pentanthera
, and
R.
sect.
Tsutsusi
. However, several relationships that are indicated in this analysis of ITS data are novel. One of the very interesting results of this study is the relationships of the lateral flowered azaleas (subgenera
Choniastrum
,
Azaleastrum
,
Mumeazalea
,
Candidastrum
). These enigmatic taxa have been classified as azaleas (Chorus Sub-generum
Nomazalea
) along with the traditional deciduous and evergreen azaleas. However, according to the ITS data, the lateral flowered azaleas are not really closely related to each other or to most of the other azaleas. Their placement in the tree indicates that lateral flowers have evolved several times within
Rhododendron
. This is one way to evaluate whether or not the character of lateral flowers is a good one to use to indicate relationship.
The evergreen azaleas (subgenus
Tsutsusi
) form a lineage in this analysis that includes the species of subgenus
Choniastrum
(
R. hongkongense
and
R. ovatum
) and
Tsusiophyllum tanakae
. The presence of flattened multicellular hairs in
Tsusiophyllum
supports the inclusion of this species within the evergreen azaleas, most of which also possess flattened multicellular hairs. This relationship was also suggested by Chamberlain and Rae (1990) in their revision of
R.
subgenus
Tsutsusi
where they made
Tsusiophllum
a species of
Rhododendron
(
R. tsusiophyllum
).
In this analysis of ITS data the evergreen rhododendrons
(R.
subg.
Rhododendron
and
R.
subg.
Hymenanthes
) are not indicated as closely related to each other. In fact, this analysis suggests that the lepidote species
R. edgeworthii
is more closely related to the azaleas than to other lepidotes (
R. groenlandicum
,
R. pendulum
,
R. konori
,
R. retusum
). This seems unlikely, given the specialized peltate scales that characterize
R.
subg.
Rhododendron
and needs to be investigated further. Another possibility is that
R. edgeworthii
is of hybrid origin. While this has not been suggested in the literature (there are no vouchered chromosome counts for this species), the large size of the flowers (the whole plant) and the great range of morphological variability when compared to
R. pendulum
and
R. seinghkuense
(considered closely related by Cullen, 1980) suggest that hybridization may have played a significant role in the evolution of
R. edgeworthii
.
To many rhododendron enthusiasts hybrids are particularly interesting. How does one identify a species as being of hybrid origin? Or how does one identify the parents of a putative hybrid? We have investigated the utility of using the ITS region and tree-building software to identify hybrids between species. This has met with mixed success depending on the distance of the cross and the particular group of rhododendrons hybridized. We chose the ITS region because it is inherited in approximately equal amounts from both parents and because it is highly variable. Thus we would expect that a putative F
1
individual would exhibit both the ITS from the ovule and the pollen parents. This has been shown to be the case in other groups of plants, such as some members of the iris and daisy families.
When we started our rhododendron project we expected that the hybrid individuals would likely be identifiable using phylogenetic methods (Funk, 1985). A simple example might be the following: two closely related species are hybridized and produce F
1
progeny. The ITS sequences of the parents are very similar, differing at only 6 base positions. The F
1
individual would then be expected to have two types of sequences, one from each parent. The expectation is that a single ITS sequence from the F
1
would be the same as both parents at all base positions, except at the 6 positions where the parents differed. At these positions a single ITS sequence would have all of the same bases as one of the parents, but a different ITS sequence would have the 6 positions match those of the other parent. Including the parental and F
1
sequences in a phylogenetic analysis would result in the F
1
sequences linking with their respective parental sequences.
However in the rhododendrons we have analyzed we have found additional variation in the sequences of the F
1
hybrids. In other words, if we go back to the example, we have found that a single ITS sequence of the F
1
exhibits a novel base not found in either of the parents. The number of novel bases can vary and this complicates the phylogenetic analysis. In addition to finding novel base substitutions in F
1
s, in more distant rhododendron crosses we have found putative F
1
individuals to have only the ITS sequence of one of the parents (rather than the two that would be expected). Although these results are interesting they are difficult to interpret. At this point, it appears that ITS is not the best way to detect hybrids.
Although one of our goals (detecting hybrids) was not fully realized, we have begun to develop a better understanding of the evolutionary relationships among major groups of rhododendrons and azaleas based on the ITS sequences.
Literature Cited
Funk, V.A. 1985. Phylogenetic patterns and hybridization. Annals of the Missouri Botanical Garden 72: 681-715.
Kron, K.A. 1997. Phylogenetic relationships of Rhododendroideae (Ericaceae). American Journal of Botany 84: 973-980.
Kron, K.A. and W.S. Judd. 1990. Phylogenetic relationships within the Rhodoreae (Ericaceae) with specific comments on the placement of Ledum. Systematic Botany 15:57-68.