Color and Color Variation in the Robin Hill Azaleas
Donald H. Voss
Vienna, Virginia
This article reports an initial step into the exploration of color and variability of color in a small sample of azaleas - the Robin Hill evergreen hybrids.
Overview
Among the characteristics of azalea flowers, color presents the greatest challenge to description and communication. The presence or absence of a green foliaceous calyx can be determined, petal length measured in inches or millimeters, stamens counted, color patterning related to available diagrams, and doubling described according to established conventions. In the broad sense - red, green, blue, etc. - color terms are widely understood. But at the level of detail useful for discriminating between azalea cultivars, there is ample room for misunderstanding. The aim of the following discussion is to acquaint the reader with some of the factors affecting the causes and perception of flower colors as well as concepts used in the description of color and color difference.
In discussing flower-color variation, it is necessary to define what variation is being examined. Color differences between areas of an individual flower (color pattern) at a given time are often characteristic of a particular clone and are not discussed here. Color difference observed at different times in a specified area of petal tissue (for example, the central portion of a lower petal) may be readily explained in some cases. Under different light sources - for example, early morning or late afternoon sunlight, midday sunlight, full-sky daylight, cloudy-sky daylight, incandescent light, fluorescent light - the color of a flower may appear to be different. Such changes in color appearance are caused by the differing spectral composition of the incident light. Another change in flower color not explored here is that occurring between the stages of floral development: from bud to fully open to senescence.
This study was undertaken to measure instrumentally the year-to-year color differences in a group of Robin Hill azaleas; it does not address the causes of observed color variations. During the blooming seasons in 1996-2000, flowers at the fully expanded stage of development were selected for measurement. At the outset, it was anticipated that - at least for one or two of the years - the measurements would reveal some common indication of environmental influence on flower color. This hope was not fulfilled: color differences abounded but not in the systematic manner foreseen. The genetic diversity of the Robin Hill cultivars may have contributed to this result.
The study did nevertheless produce some interesting relationships:
The measurements confirmed the general tendency of chroma (color saturation or "purity") to decrease as lightness increases, especially in the lighter pinks. Interesting exceptions were noted among dark-colored cultivars.
The smallest color difference from all pairs of years for each of 63 Robin Hill cultivars fell within a quality control limit appropriate for much color printing - a difference that in the garden setting may not be noticeable.
Similarly calculated data for largest color difference showed variations that at their upper limits would be clearly evident to a careful observer who considers all three attributes of color (lightness, chroma, and hue [red, green, blue, etc.]).
Because most gardeners tend to focus disproportionately on the hue of a flower and hue was found to be a minor contributor to total color difference, many measured differences in color viewed a year later may escape notice.
An interesting finding was the identification of a dip in the 650-670nm wavelength range in the spectral curves for a number of cultivars. This indicates the presence of chlorophyll, which tends to decrease chroma and slightly shift purples toward red and reds toward orange.
The Time Dimension of Color Difference
For many years, the author has heard assertions that azaleas change color: hour to hour, day to day, year to year. True or false? The answer in each case must be examined in a frame of reference that includes some definition of a significant change in color. In each time frame, the spectral content of incident light, viewing conditions, the ability of an observer to discriminate colors, as well as the reflective and absorptive characteristics of the flower, affect the perception of color. These factors are also important in understanding differences that may occur between instrumental measurement and visual evaluation of flower colors.
"Hour-to-hour"
- Measurement to determine whether changes in petal color occur through the day is not possible with the instrument used in this study. In addition to the problem of aligning the instrument to ensure that precisely the same area of a petal is measured each time, exposure of the petal to xenon flash illumination by the instrument may itself trigger chemical changes affecting pigmentation.
Readily observable color changes related to the time of day result from the changing quality of daylight. At midday, for a given latitude and time of year, sunlight passes through a minimum distance in the atmosphere, and the human eye interprets the spectral mix of wavelengths comprising midday full-sky daylight as "white" light. Because the length of sunlight's path through the atmosphere is markedly greater in early morning and late afternoon, the scattering and refraction of light by minute particles in the atmosphere then cause the spectral composition of direct sunlight reaching the earth's surface to shift toward Orange Yellow.
The color appearance of an object depends primarily on its reflective and absorptive characteristics and on the spectral quality of incident light. If one casually observes white pavement marking (or a picket fence that he knows to be painted white) in sunlight near sunset, he will likely consider it to be white. This phenomenon is known as color constancy. Upon close consideration it will be seen that the objects are in fact reflecting Orange Yellow light. Thus in the landscape near sunset, a white azalea may be identified as white when viewed by an observer who from previous experience knows the flowers to be white. To an observer without previous knowledge of the planting, the white azalea may appear yellowish Pink.
"Day-to-day" - The color of petals in many flowers progresses through several recognizable stages: from bud to fully open to fading to necrosis. In bud or shortly after opening, petals of some varieties appear pink but later fade to white. Petals that are red in bud may change to purplish red at anthesis and then gradually fade to a more bluish color. Thus it is important in describing and comparing flower colors to select for evaluation and measurement flowers that are at an identifiable stage of development - usually when the flower becomes fully expanded (anthesis).
"Year-to-year" - In a mature planting where cultural practice is essentially constant from year to year, color variation results primarily from interaction between plant physiology and environmental factors. These interactions are complex: not only the quantitative aspects of weather (temperatures, amount of rainfall, insolation, etc.) but also their timing in relation to stages of plant development are critical.
Floral Pigmentation in Rhododendron
When used in the description of plant coloration, the term " pigment" refers to a biochemical colorant and must be distinguished from the definition long used in art and industry, namely a particulate substance insoluble in water. The pigmentation of a petal lacks the uniformity of a dyed cloth or a paint film. In the petal, the appearance of color results from chemical reactions in each of the cells comprising the pigmented petal tissue (usually the epidermal layer). The shape and size of these cells varies to some extent, as does the proportion of each cell's volume occupied by the vacuole. In the reddish Orange - Purple color range, the pigmentation is located in the cell vacuole.
A purplish Pink petal, for example, may have individual cells that differ slightly in the size and color of the vacuoles, as well as in the extent of cytoplasm and cell-wall (i.e., the area outside the vacuole) reflecting light only slightly modified in color toward the observer. The human eye integrates the colored and essentially uncolored rays reflected from the petal, creating a sensation of purplish Pink. At some distance, mottling of color that may be apparent upon close examination of a petal will be integrated into the appearance of uniform color.
The uniform purplish Pink appearance of the
Rhododendron
petal seen at some distance may be closely matched by a skilled artist working with paints compounded from finely ground minerals or mineral compounds (pigments) in an appropriate vehicle. White light entering the painted surface is subjected to absorption of certain wavelengths so that the rays reflected toward the observer create the sensation of purplish Pink. If high quality paints are used, the image will be stable in color for many years.
Pigmentation in
Rhododendron
flowers differs in many respects from that in the painting just described. Most obvious is the absence of stable, solid pigments. Some colorants are found in plastids located in the cytoplasm of plant cells: absorption by the chlorophyll in chloroplasts produces the appearance of green; by the carotenoids in chromoplasts, Yellow to Orange Yellow. Most
Rhododendron
flower colors are, however, in the reddish Orange - Purple hue range, produced by flavonoid pigmentation - notably anthocyanins - in the vacuoles of petal cells. These pigments are solutes, but differ from industrial dyes in that the color produced in flowers of a given plant may vary in response to a host of factors affecting plant physiology. As noted above, notice must be taken of the fact that a given plant may exhibit different flower color in the bud stage, at anthesis, and in the subsequent period of senescence. It is thus necessary in describing a flower color to specify the stage of floral development under observation.
The color exhibited at anthesis by a
Rhododendron
flower depends on complex interactions of genetic factors, availability of nutrients, internal pH of floral tissues containing the pigmentation, temperatures, and solar radiation to which the flower has been exposed from the bud stage to anthesis. These factors control the development and relative proportions of anthocycanins, flavonol co-pigments, carotenoids, and other chemicals that together determine petal color.
Pigmentation And Flower Color
"The Anthocyanins. Cyanic colors are well represented in
Rhododendron
, and many species have flowers in varying shades of pink, red, mauve, violet or blue. The attractive colors of these flowers are due to the presence of anthocyanin pigments. ...as a result of hybridization, 'mixed' pigments are produced and such compounds are probably found only in cultivated material. ...Anthocyanins are usually accompanied in flowers by flavonol glycosides, and these colorless substances undoubtedly stabilize and intensify the cyanic pigments. ...Flavonols have a bluing effect on the otherwise mauve anthocyanins." (Harborne, 1980)
Yellow colors fall into two groups: (1) greenish yellow to lemon yellow with many chlorophylls and derivatives but little carotenoid pigment; and (2) golden yellow to orange yellow with many -carotenes and xanthophylls but only traces of chlorophyll. Orange occurs in cells containing both chromoplasts (carotenoids) and anthocycanin. Red-brown to black-red has been found to combine a strong anthocyanin in the epidermis and a large amount of chloroplasts in the mesophyll; the brownish color results from the presence of red and green pigments. (Based on Spethmann, 1980).
The physiological processes producing hue difference in an evergreen azalea (Brooks' 'Red Wing') were analyzed by U.S.D.A. Agricultural Research Service scientists. The subject plant, normally a strong red, produced an orange sport, and analysis was undertaken to determine the responsible differences in pigmentation. After identifying the anthocyanins and flavonol co-pigments present in 'Red Wing', it was found that changing the concentration of anthocyanin and the molecular equivalent of anthocyanin to co-pigment "greatly influenced co-pigmentation." Laboratory experiments with these variables produced shifts as high as 15nm in maximum wavelength, more than sufficient to account for the color anomaly observed in 'Red Wing'. (Asen et al., 1971). Subsequent research has firmly established the role of external factors on activation of pigment - co-pigment relations (Griesbach, pers. comm.)
Absence of Pigmentation
Some petals or areas of petals appear white - not because of the presence of pigments but because of their absence. Petal cells for which genetic and environmental factors have not provided the necessary conditions for development of pigmentation will appear white. Precursor chemicals for pigmentation may be present in the cells but remain inactivated. Measurement of flower color of several "white" evergreen azaleas has shown the presence of Yellow or yellowish Green at such low levels of chroma that the petals appear white. On some plants, the area of white in the flowers (as white centers or margins) is highly variable from year to year, indicating that environmental factors strongly affect pigment formation in these cultivars.
Why do petals with cells that are more or less clear (or slightly yellowish) appear white? Under the compound microscope with transmitted illumination, a single cell from a white petal appears nearly transparent. Viewed at low magnification with incident illumination, the cell vacuoles in the epidermis appear light gray and surrounding areas reflect "white" light brilliantly. In daylight, some light striking the petal will be reflected from the cutin, a waxy layer covering the outer surface of the epidermis. Most will enter the petal and be subjected to refraction, scattering, and reflection in the layers of cells comprising the petal tissue. In the absence of pigmentation that selectively absorbs wavelengths of the incident light, by one path or another nearly full-spectrum light will be reflected toward the observer, creating the sensation of white.
This process is essentially similar to that creating the sensation of white when one views snow or the (clean) fur of a young polar bear. Snow crystals are transparent or nearly so, and it is the refraction, scattering, and reflection of light incident on the snow that create the white appearance. Polar-bear fur consists of strands that are nearly transparent and hollow, offering endless possibilities for refraction, scattering, and reflection when present in many layers.
Scope and Method
The observations from 1996 to 2000 reported in this article do not address the causes of color variation. They identify colors and color differences measured for 68 of the 69 Robin Hill azaleas (the white 'Dorothy Rees' is not included) and for one of the parent plants, 'Oakland'.
During the blooming seasons in 1996-2000, flowers were selected for measurement on the basis of state of development. The objective was to select flowers that were fully expanded (but not aged) and were from areas of typical growth on the plant (i.e., not from abnormally rapid or slow areas). Measurements were made of an 8mm-diameter circle on the central portion of a lower petal (adaxial side) to avoid the influence of blotch or spotting frequently encountered on the upper petals. The Minolta CM-2002 spectrophotometer was set for the 2 Standard Observer, D65 (daylight) illuminant, specular reflection excluded. CIELAB L*, a*, b*, and reflectance at 10 nanometer (nm) intervals for 400nm to 700nm were recorded, together with Munsell notation. CIELAB Chroma (C*) and Hue Angle (h) were calculated from the a*, b* data (CIE 1978).
The CIELAB concepts of lightness (L*), chroma (C*), and hue angle (h) are used in the following discussion:
Lightness is the attribute by which an object is seen to reflect more or less light (to appear lighter or darker); it is measured instrumentally by the reflectance factor - the ratio of light reflected from a specimen to the light reflected from a surface that reflects all wavelengths of the visible spectrum diffusely. L* expresses the reflectance factor in percentage terms.
Chroma indicates the degree of difference of a color from a gray of the same lightness; the measurement is calculated from a* and b*.
Hue refers to the attribute of color by which it is seen to be red, orange, yellow, green, blue, etc. Hue angle, in degrees, arrays hues in a color wheel, with purplish Red at 0, Yellow at 90, slightly bluish Green at 180, and Blue at 270. An initial impression of the hues associated with various hue angles may be obtained from the hue-angle ranges presented in Table 1. (Note that h=0 and h=360 refer to the same hue angle.) For hues from reddish Purple to reddish Orange, the lighter colors are pinks - purplish Pink, Pink, and yellowish Pink. Purplish Pink describes colors of the same hue but lighter than those designated as reddish Purple and purplish Red, nearly to the border with Red. Pink includes colors lighter than the reddest of purplish Reds and about half of the Reds. Yellowish Pink describes the colors lighter than the remainder of Reds (i.e., those toward reddish Orange) and reddish Orange. For most of the pinks, the border with the darker colors in the Inter-Society Color Council - National Bureau of Standards (ISCC-NBS) Method of Designating Colors is L*=56.6, equivalent to Munsell Value 5.5 (Kelly & Judd, 1976).
| Table 1. Hue-angle ranges on CIELAB a*, b* diagram for selected ISCC-NBS colors (in degrees). | |||
| reddish Purple | 334-342 | Yellow Green | 107-127 |
| purplish Red | 354- 11 | yellowish Green | 139-154 |
| Red | 19- 27 | Green | 165-169 |
| reddish Orange | 35- 46 | bluish Green | 174-237 |
| Orange | 52- 62 | Blue | 248-270 |
| Orange Yellow | 68- 77 | purplish Blue | 286-287 |
| Yellow | 84- 90 | Violet | 300-307 |
| greenish Yellow | 95- 99 | Purple | 316-324 |
| NOTE: The listed hue-angle ranges provide a basis for rough interpretation of hue-angle data. Each range is based on measurement of a group of strong, vivid, deep, and brilliant colors for which both CIELAB and Munsell data were available (Munsell notations provided a link to the ISCC-NBS color names). The ranges are only approximate for colors of different lightness and chroma. The gaps between ranges result from the limited size of the group of colors included in the measurement sample. | |||
Lightness -Chroma Relations
There is a general tendency for L* and C* to be negatively correlated: as L* increases, C* decreases. During the flowering seasons in 1999 and 2000, three flowers were measured from each of a small group of plants (excluding cultivars with white corollas). From the measurements for each plant, the relative rank of the C* associated with the highest L* was noted:
| Number of Associations with Highest L* and: | ||
| Lowest C* | Middle C* | Highest C* |
| 96 | 15 | 12 |
In many cases, the differences in L* and C* for a given plant were very small. The association of high L* and high C* in 12 sets of the measurements is interesting. All of these cultivars are relatively dark in color: 'Karafune' and 'Midnight Flare' (not Robin Hills); 'Robin Hill Congo', 'Nigel', 'Pucken', 'Turk's Cap', Maria Derby', and 'Robin Hill Gillie'.
When the L* vs. C* relation between different cultivars is examined, the correlation between L* and C* is very strong (r=-0.97) when all 71 subjects are included. When the azaleas are grouped by their average L*, a quite different picture emerges. (The L*, a*, and b* measurements for each subject were averaged for the five years - or fewer in several cases - and C* and h were computed from the resulting means of a* and b*.) At first, two lightness groups were apparent: the "whites" and all others. Also apparent was the anomalous position of 'Olga Niblett': while close in L* to the other 6 subjects in the "white" group, its average C* = 18 was a clear outlier from the range of C* = 5 to C* = 8 for the others. Therefore, 'Olga Niblett' was excluded from calculations summarized in the following tabulation:
| L* | Lowest L* | Highest L* | No. of Subjects | r |
| 45.00-56.99 | 'Robin Hill Congo' | 'Robin Dale' (self ) | 12 | -0.54 |
| 57.00-67.99 | 'Tamino' (margin) | 'Robin Hill Elsa' | 25 | -0.59 |
| 68.00-78.99 | 'Jeanne Weeks' | 'Maxine West' | 12 | -0.83 |
| 79.00-84.99 | 'Peter Pooker' | 'Glamora' | 15 | -0.87 |
| 91.00-92.00 | 'Dorothy Hayden' | 'Papineau' | 6 | -0.09 |
The inverse correlation between L* and C* is weak for the darker subjects, from 'Robin Hill Congo' (L*=45) to 'Robin Hill Elsa' (L*=63); fairly strong for the pinks from 'Jeanne Weeks' (L*=68) to 'Glamora' (L*=83); and insignificant among the included whites, for which the L* and C* values were tightly clustered. These generalizations are, of course, subject to the caveat applicable to averages: some individual components may exhibit quite different characteristics.
Color Differences
A standard measure of color difference, the CIELAB ΔEab* (hereinafter referred to as ΔE, pronounced "delta E), takes account of differences in the lightness, chroma, and hue measured instrumentally. Some appreciation of the ΔE metric may be obtained by considering "rule-of- thumb" statements that human vision is capable of distinguishing color differences of ΔE=0.5, fairly strict industrial quality-control standards may be set at ΔE=1.0, and acceptable differences in moderate-quality four-color process printing may be ΔE=3.0. Implicit in these quality-control standards is the expectation that color differences not exceeding the stated values of ΔE will not be noticed by consumers or, at least, not be great enough to reduce acceptability by consumers. Acceptability involves subjective considerations and, in terms of ΔE, may vary widely from application to application. In rating the color accuracy of digital cameras, for example, tests by a popular photographic magazine recently showed ΔE of 6.7 and 7.2 as "Excellent" for two cameras and a range of 8.1 to 9.4 as "Extremely High" for four others (Popular Photography and Imaging, 2004).
For the reader who has access to a set of the RHS Colour Chart, Table 2 offers measurement data permitting visualization of color differences and associated differences in lightness, chroma, and hue angle. In a garden setting, viewing the A and B chips against a background of green foliage, the ΔE=4.9 for RHS95 57 presents a relatively slight difference in appearance. The larger and more obvious differences shown for the other colors in Table 2 offer an opportunity to study the associated contributions of L*, C*, and h.
| Table 2. Color differences between selected A and B color chips from the 1995 edition of the RHS Colour Chart. | ||||
| Change from A Chip to B Chip | ||||
| Leaf No | ΔE | ΔL* | ΔC* | Δh |
| 57 | 4.9 | +2.5 | -1.4 | -3.3 |
| 62 | 8.8 | +3.8 | -7.4 | -4.6 |
| 67 | 7.7 | +6.0 | +0.1 | -4.8 |
| 73 | 16.7 | +10.0 | -12.9 | +4.3 |
| 78 | 11.6 | +9.6 | -6.3 | -1.9 |
Measurement Results
From pairs of data for each cultivar in the 1996-2000 measurements, the smallest and largest ΔE's were calculated. In some cases the closest color-pair was from measurements in the same year; in other cases, different years. The most important observation about the smallest ΔE's is that their size is minimal. Of 63 comparisons of closest pairs, all had ΔE<2.1 and 41 had ΔE<1.0. Because ΔE's are dependent on the formula used in their calculation, it is not useful to attempt explanation of these small color differences.
Omitting six white-flowered cultivars for which the highest measured color difference was ΔE=3.7 and the case of 'Olga Niblett' noted below, the maximum measured color difference between pairs of observations for a given cultivar varied from ΔE=4.4 ('Blue Tip') to ΔE=19 or more for several outliers. The greatest differences were observed for plants that for their first 25 years in my garden had flowers of pale or light, nearly uniform color. The flowers of 'Madame Mab Chalon' and 'Sir Robert' were very pale Pink - the landscape effect was "off white"; those of 'Hilda Niblett' were a nearly uniform moderate Pink. In the late 1990s we experienced warmer winters, and the color of these cultivars increased substantially in chroma. Darker areas appeared: a flush of color along the axis of the petal and even sectoring and self-coloration.
'George Harding' in some years displays a white center large enough to reduce the red-colored area of the corolla to a broad margin while in other years the white center was very small or absent: the maximum color difference measured in the red area is entirely attributable to L* (lightness). The flowers of 'Olga Niblett' are a pale Yellow Green that in one year developed chroma of C*=24; in other years it was as low as C*=8. Thus the flowers of this cultivar may have a definite yellowish color (or may not!), depending on the sequence and intensity of factors affecting the development of pigmentation.
From measurements of 54 cultivars during 1996-2000, the average color difference for all combinations of years for a given cultivar ranged from ΔE=1.9 ('Betty Layman') to ΔE=10.1 ('Sir Robert'). When the differences are arrayed by lightness (L*) group and averaged, a tendency for greater color difference to be associated with greater L* is seen:
| L* | Average ΔE | ΔE Range |
| 45.00-56.99 | 3.3 | 1.9 - 5.9 |
| 57.00-67.99 | 4.2 | 1.9 - 8.0 |
| 68.00-78.99 | 5.5 | 3.4 - 7.4 |
| 79.00-84.99 | 5.8 | 2.4 - 10.1 |
Using data for flowers typical of each cultivar, the relative contributions of ΔL*, ΔC*, and ΔH* (metric hue, not hue-angle, difference) to the maximum inter-year color differences were calculated. The contributions were averaged for groups of cultivars arranged by lightness range, as follows:
| Average | Percent of Maximum ΔE Attributable to: | |||
| L* | Maximum ΔE | ΔL* | ΔC* | ΔH* |
| 45.00-56.99 | 8.2 | 55 | 22 | 23 |
| 57.00-67.99 | 9.7 | 41 | 44 | 15 |
| 68.00-78.99 | 13.3 | 27 | 69 | 5 |
| 79.00-84.99 | 16.8 | 18 | 77 | 5 |
Notable in the L*=45.00-56.99 category is the predominance of lightness differences, together with moderate chroma and hue differences, in the measured color differences (ΔE). In the lighter colors (generally "pinks") with L*=68.00-84.99, chroma differences predominate and combine with moderate lightness and minimal hue differences. It must be remembered that the figures shown are averages and exceptions are present in each group - especially for the deep Pink colors in the L*=57.0-67.99 group.
Clearly, differences in hue contribute significantly less than those of lightness and chroma to total color difference between flowers of a given cultivar. Indeed, for half of the cultivars among the darker colors (L*=45.00-56.99), hue difference associated with the maximum observed color difference was less than two degrees of hue angle.
Not yet explained are the observed contributions of lightness and chroma to color difference. A possible hypothesis is that the anthocyanin - co-pigment ratio and, consequently, hue are nearly constant in the observed plants, but that differences in the size and concentration of the resulting pigment molecules strongly affect lightness and chroma.
Spectral Reflectance Characteristics
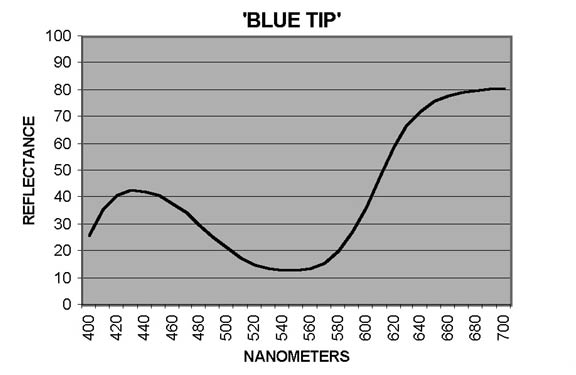
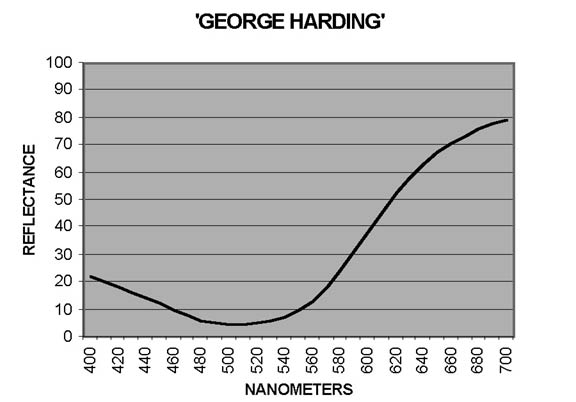
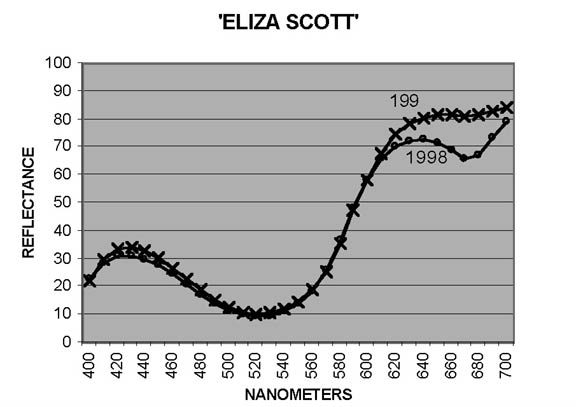
In measuring petal colors with the CM-2002 spectrophotometer, reflectance ratios (expressed in percentage terms) are reported at 10nm intervals from 400nm to 700nm, the blue and red ends, respectively, of the visible spectrum. Curves showing patterns typical of reddish Purple ('Blue Tip') and of Red ('George Harding') are shown in Figures 1 and 2. In interpreting these curves, remember that Purple is not a spectral color - it results from combination of Blue and Red. For some cultivars, the otherwise smooth curves are distorted by a dip - sometimes pronounced - from around 640-650nm to 670-680nm, followed by a sharp rise to 700nm. The extent of the dip may vary from year to year, as illustrated by Figure 3 ('Eliza Scott'). This pattern is an indicator of the presence of chlorophyll (Griesbach, 2004).
The figure in a study of the application of reflectance spectroscopy to leaf and fruit colors illustrates clearly the influence of chlorophyll in maple leaves showing fall color (Merzlyak et al., 2003). Not only the dip in reflectance at 670-680nm and the sharp increase to 700nm but also high reflectance (low absorption) in the near infrared (IR) range beyond 700nm are clearly presented. The latter characteristic is familiar to those who have photographed green foliage on IR-sensitive black and white film through a filter that transmits IR while blocking nearly all visible light: foliage appears white because of the high reflectance of chlorophyll in the near IR range.
|
| Figure 1 |
|
| Figure 2 |
|
| Figure 3 |
Inspection of the reflectance curves from measurements in this study shows that for 9 cultivars there was no (or, in one case, no significant) drop in reflectance from 650nm to 670nm. Reflectance in this range shows a drop in each year for 37 cultivars; and for 25 cultivars reflectance decreased in some years, increased in others. To illustrate the effects of increased presence of chlorophyll on hue and chroma, data for five cultivars are shown in Table 3. In purplish Pink cultivars, the effect is to shift the hue toward Red; for Pink cultivars, toward Orange. In each case, chroma is reduced. Variations in the amount of chlorophyll that develops in petal tissue is thus an additional factor leading to year-to-year color variation in some cultivars.
| Table 3. Color differences resulting from increased presence of chlorophyll in petal tissue.* | ||||
| Differences in | ||||
| Cultivar | Color | Reflectance | Hue Angle | Chroma |
| 'Peter Pooker' | l.pPk | -3.2 | +9.9 | -3.2 |
| 'Scott Gartrell' | deep p.Pk | -4.5 | +1.0 | -7.5 |
| 'Eliza Scott' | deep p.Pk | -5.7 | +2.4 | -1.8 |
| 'Robin Hill Wendy' | m.Pk - l.Pk | -3.7 | +7.3 | -4.5 |
| 'Tan Dilly' | s.Pk | -5.2 | +2.4 | -0.9 |
| * NOTE: For each cultivar, differences are based on data for the years showing the least and greatest influence of chlorophyll (as measured by the reflectance change in the 650nm to 670nm range). | ||||
Visual Evaluation of Color
In contrast to instrumental measurement of color (which provides high accuracy and repeatability through use of a xenon flash to illuminate the specimen, a diffraction grating to separate wavelengths, and a CCD detector array to measure their intensity), visual color evaluation using a color chart - or using a color chart to visualize color from a color chart reference - is more art than science! The individual's color vision and color-discrimination ability, the spectral quality of incident light, viewing conditions, and the sampling of color space provided by a color chart present serious challenges to accuracy and repeatability.
Reasonable success in visual color evaluation involves careful attention to a number of details. First and foremost is selection of the light source: mid-day full-sky or north-sky daylight is generally recommended; daylight is available not only to the person evaluating a color but also to anyone, anywhere, who makes use of the recorded result of the evaluation. Pigments in plant tissue as well as pigments in color - chart chips may be metameric, displaying different color appearance under different light sources. For example, at a Rhododendron show some years ago at the U. S. National Arboretum, an entry was placed (based on the cultivar epithet) in the purplish Pink color group but appeared yellowish Pink under the incandescent light in the auditorium. When taken outside and viewed in daylight, it was indeed purplish Pink. The spectral balance of incandescent light is much redder than that of daylight, and ordinary fluorescent lamps produce narrow spectral bands of illumination; both of these sources are unsuitable for critical evaluation of color.
Ideally, only the specimen, a pair of color chips, and an achromatic background (e.g., middle gray) should appear in the field of vision during color evaluation. The selection of color chips for comparison begins with locating chips of approximately the same lightness and hue as the specimen color. In the Royal Horticultural Society (RHS) Colour Chart, each leaf carries four color chips that grade in lightness from "A" (darkest) to "D" (lightest). One should not assume that the "let-downs" or "tints" on a given leaf are the same in hue as the A-chip. The admixture of "white" pigment in the tints can cause some shift in hue. When using the RHS color chart, the first step (finding chips similar in lightness to the specimen) can itself be a challenge, because such chips may be several leaves apart, at different levels on the leaves, or in different "fans" of the chart.
It is a guess how many colors the human eye can distinguish, but 5 million is a conservative estimate. The 1966, 1986, and 1995 editions of the RHS color chart have 808 color chips (there are 884 in the 2001 edition). Thus, finding a chip that exactly matches a specimen color is highly unlikely; and because plant colors are themselves subject to some variation, evaluation must be considered an approximation. Once the two chips closest in color to the specimen have been selected, two judgments are required: (1) to decide on the relative weight given to lightness, chroma, and hue in one's definition of closeness and (2) whether to record the chip that appears closer to the specimen color or to record both chips to "bracket" the color.
Instrumental vs. Visual Evaluation of Color
Although lightness, chroma, and hue are all considerations in visual color evaluation, most people tend to focus disproportionately on hue when examining flower color in the garden. As shown above, the major share of maximum measured color difference is determined by ΔL* and ΔC*. Because relatively large variation in these components of color, hue (which varies much less) has high importance as an identifying characteristic for most of the cultivars studied. Color experts are trained to give appropriate weight to differences in lightness and chroma as well as in hue. Color amateurs (including the author) - whatever their qualifications in other fields - need to devote extra attention to recognizing the relative effects of lightness, chroma, and hue.
The color-difference term ΔE, based on instrumental measurement, gives equal weight to the differences in lightness, chroma, and hue. And, as noted earlier, a color chart can reproduce only a small sample from the gamut of colors present in flowers. Thus, relating flower colors to color-chart chips - whether through instrumental measurement or visual evaluation - is nearly always an exercise in approximation.
When instrumental measurements of Robin Hill flowers and RHS color-chart chips are compared, the color differences between a specimen and the chips closest and next closest in color average ΔE=3.6 and ΔE=4.8, respectively. Differences of this magnitude observed under recommended viewing conditions should be perceptible to the careful observer. In the garden, where highlights, shadows, other colors, and foliage textures are in the field of view, the differences will be less apparent. The different color of a cultivar a year later may or may not be noticed. A large ΔE that does not involve significant difference in hue (e.g., 'George Harding') may not command visual attention proportional to its magnitude -so-called "memory color" may satisfy the observer because the hue is essentially that previously observed. But for 'Madame Mab Chalon', 'Sir Robert', or 'Hilda Niblett', the strongly increased chromaticity will clash with memory color.
The variant results of instrumental measurement and visual evaluation of color may be seen in the examples in Table 4. For reddish Purple hues ('Sherbrooke', 'Blue Tip' [margin], 'Robin Hill Congo'), visual evaluation selected color chips slightly more Purple than the measured colors. This tendency persisted for the deep purplish Pink cultivars ('Mrs. Emil Hager', 'Tamino' [margin], 'Robin Hill Frosty'). For the considerably lighter purplish Pink 'Betty Anne Voss', the visually selected chip was redder than the measured color. The remaining Pink cultivars in Table 4 were visually evaluated as redder than the measured hues. The darker 'George Harding' fell into the range of measured hue angles.
| Table 4. Relation of average measured hue angle to hue angles of RHS color chips identified in visual evaluations* | ||||
| ISCC-NBS | Average | Range of | Average | |
| Color | Measured h | Measured h | Visual h | |
| 'Sherbrooke' | deep pPk-s.rP | 334.1 | 331-338 | 329 |
| 'Blue Tip' (margin) | deep pPk-s.rP | 337.9 | 337-340 | 333 |
| 'Robin Hill Congo' | v.rP | 338.3 | 336-341 | 335 |
| 'Betty Anne Voss' | s.pPk-m.pPk | 349.0 | 347-351 | 356 |
| 'Mrs Emil Hager' | deep pPk-s.pR | 356.9 | 356-0 | 353 |
| 'Tamino' (margin) | deep pPk | 359.3 | 358-1 | 355 |
| 'Robin Hill Frosty' | deep pPk | 4.5 | 2-7 | 358 |
| 'Laura Morland' | s.Pk-l.pPk | 10.7 | 9-13 | 22 |
| 'Lady Louise' | deep Pk | 15.7 | 14-18 | 20 |
| 'George Harding' | s.R | 20.2 | 19-21 | 21 |
| 'Redmond' | deep Pk | 23.1 | 22-24 | 30 |
| 'Early Beni' | deep yPk | 23.9 | 21-25 | 30 |
| * "Visual" RHS chip references are from registration data. | ||||
This sample is too small to support a conclusion that the different directions of divergence between instrumental and visual results in the Purple range and the Red range are significant. But certainly the factors noted above are relevant: the visual observer's color-discrimination ability; a tendency to focus on hue, while the instrument gives equal weight to lightness, chroma, and hue; viewing conditions; and the color chart's sampling of the color space.
The foregoing discussion highlights the difficulties attendant on the conduct and use of color measurement and visual color evaluation of flower colors. An additional, inescapable, and difficult problem encountered in using the RHS Colour Chart (and, indeed, the Munsell Book of Color) is that color charts cannot reproduce the high chroma often found in flowers, especially in lighter-colored ones. Many of the lighter color chips tend to be somewhat "creamy" in appearance, sometimes leading the evaluator to select chips having higher chroma at the expense of closeness in hue.
Conclusions
Color measurements performed on a group of Robin Hill azaleas during 1996-2000 reveal divergent degrees and patterns of color difference between the flowers of individual cultivars. Determination of the differences by instrumental measurement rather than visual evaluation assures that the differences are not affected by variation in the spectral quality of incident light, viewing geometry, specular reflection, etc. Instrumentally determined color differences defined in terms of the CIELAB ΔEab* express the combined differences in lightness (L*), chroma (C*), and metric hue difference (H*). The measurements made in 1996-2000 revealed differences in ΔE and its components for cultivars grouped by L*. Most of the results presented above are averages for ranges of L*. Within these averages there was considerable variation with respect to individual cultivars. At the outset of this project, it was naively anticipated that some clear pattern of year-to-year variation in the subject cultivars would be apparent from the measurements; this expectation was not met. Measurements have shown that, for a given cultivar, noticeable differences in color may occur in a given year or between years. For different cultivars, maximum color differences often occurred between different pairs of years.
In general, it was found that measured color differences were noticeably greater for the lighter colors (pinks) than for the darker colors. Calculation of the percent of maximum inter-year E attributable to the components of ΔE shows that, on the whole, L* and C* differences constituted three-fourths or more of the measured differences. The relative contribution of H* varied from 23% for the darkest cultivar group to 5% for the lighter pinks.
The dominant role of L* and C* differences in E tends to mitigate the perception of color difference by most persons in a horticultural setting. When viewing a cultivar or comparing cultivars, hue is a key consideration. Difference in hue may be of prime importance for selecting plants to complement a background of certain color. It is also a major character distinguishing certain cultivars that are near "look-alikes."
References
Asen, S., R. N. Stewart, and K. H. Norris. 1971. "Co-pigmentation Effect of Quercetin Glycosides on Absorption Characteristics of Cyanidin Glycosides and Color of Red Wing Azalea."
Phytocbemistry
10:171-175.
CIE (Commission Internationale d'Eclairage). 1978. Recommendations on Uniform Color Spaces - Color Difference Equations - Psychometric Color Terms. Supplement No. 2 to CIE Publication No. 15 (E-1.3.1)/(TC-1.3.). Paris: CIE.
Griesbach, Robert. 2004. Personal communications.
Harborne, Jeffrey B. 1980. "Flavonoid Pigments as Both Taxonomic and Phyletic Markers in the Genus Rhododendron." In Luteyn, James L., ed.
Contributions toward a Classification of Rhododendron
. New York: New York Botanical Garden.
Kelly, Kenneth L. and Deane B. Judd. 1976. Color: Universal Language and Dictionary of Names. National Bureau of Standards Special Publication 440. Washington, D.C.: U.S. Government Printing Office.
Merzlyak, M. N., et al. 2003. "Application of Reflectance Spectroscopy for Analysis of Higher Plant Pigments." Transl. in
Russian Journal of Plant Physiology
50(5):704-710.
Popular Photography and Imaging. 2004. Vols. 68(6):56, 60, 64; 68(7):52, 54;68(8):56. New York: Hachette Filipacchi Media U.S.
Royal Horticultural Society. 1995. RHS Colour Chart. London: Royal Horticultural Society.
Spethrnann, Wolfgang. 1980, "Flavonoids and Carotenoids of Rhododendron Flowers..." In Luteyn, James L., ed. 1980.
Contributions toward a Classification of Rhododendron
. New York: New York Botanical Garden.
Voss, Donald H. 1995. "Summary of Registration Data for the Robin Hill Azaleas."
The Azalean
17(l):4-19.
Don Voss, a member of the Potomac Valley Chapter and District 9 Director; is editor of A Contribution toward Standardization of Color Names in Horticulture.