JOTS v41n1 - Assessing the Cost Effectiveness of LEED Certified Homes in Kentucky
Stephen J. Glossner, Sanjeev Adhlkarl, and Hans Chapman
ABSTRACT
The purpose of this study was to analyze the
cost effectiveness of building new-construction
single-family homes through the Leadership
in Energy and Environmental Design (LEED)
program in six counties of Kentucky. The
estimated added LEED construction cost was
calculated as well as its respective payback
period based on the expected utility savings of
LEED certification. A mortgage cost comparison
was also performed comparing traditional code
built to non-LEED single-family homes. Using
descriptive statistical analysis on the simple
payback period, mortgage costs were compared
internally and by county. This study found
that The LEED Certified and Silver level had
payback periods less than 30 years, and the
total 30 year net difference between non-LEED
and LEED certified ranged from $-1,193.20 to
$1,667.64.
Keywords: Leadership in energy and environmental design (LEED), sustainability, residential construction, LEED cost
INTRODUCTION
In the United States, increasing significance is
being placed on the practice of sustainability
mostly in part to energy price increases and
environmental concerns. In 2010, the United
States consumed 95 quadrillion BTUs of energy
accounting for 19% of the world’s energy
consumption for that year. Of that 19%, 81%
was produced by fossil fuels and only 9% was
produced by renewable energy sources (U.S.
Energy Information Administration 2013). This
has pushed for the practice of sustainable design
to become the standard for new construction
projects, especially in the residential sector. The
LEED certification program led through the U.S.
Green Building Council (USGBC). This program
evaluates construction projects on the various
sustainable design features and materials and
offers four levels of certification.
It is clear that sustainability is going to be a significant factor in all construction fields as energy prices continue to increase and resources become increasingly scarce. Since 2000, The LEED program has been at the forefront of sustainability in the commercial industry ( Schmidt 2008 ). In 2008, an estimated 5% of public buildings in the United States were LEED certified ( Schmidt, 2008 ). The number of LEEDcertified residential units have significantly increased annually since the LEED for Homes program’s conception in 2007 ( Kriss, 2014 ); there were 392 certified residential, while in the last recorded year – 2013 – 17,000 residential units were certified. This trend is likely to continue for 2014. This level of annual increase is not apparent when considering the increase of LEED-certified homes at the state level. One such state is Kentucky. Kentucky only has 55 homes that were certified between 2008 and 2013, and 46 of those 55 homes were part of a military community established in Fort Knox ( USGBC, 2005 ).
There could be several factors contributing to this low number. The information that is available to the public is lacking in Kentucky. There is an unknown cost associated with constructing LEED-certified homes. McGraw- Hill Construction identified the cost perception as a top obstacle to green building for both homeowners and builders. Changing this cost perception is the main priority for the USGBC and green building community in its entirety ( Schmidt, 2008 ). Making information regarding the added cost of pursuing LEED certification and the associated utility cost savings is essential to the advancement of the LEED for Homes program in Kentucky.
One of the contributing factors to the low number of LEED-certified residential projects in Kentucky could be the lack of organized information pertaining to LEED certification of residential projects, specifically the cost and economic information of LEED-certified versus traditional code built single-family homes in Kentucky. The LEED for homes rating system has only been officially recognized since 2008, resulting in limited available data. This lack of available data makes it difficult for individuals to be informed about LEED homes and how they compare to traditional code-built homes. One of the most significant factors for homebuilders and homebuyers alike when considering building a new home is cost, especially when considering a new idea such as LEED. Though there are many benefits to a LEED-certified home, both financially and environmentally, these are overshadowed by cost uncertainties.
The primary and secondary purpose of this study was to assess the cost effectiveness and provide more information to homebuilders and potential buyers regarding LEED-certified single-family homes in (Fayette, Jefferson, Campbell, Kenton, Boone, and Spencer County) Kentucky. The fundamental purpose of this study was that the findings would attract more LEED certified residential projects to Kentucky by showing that the construction cost difference between traditional code-built and LEED-certified homes is not significant.
Brief History of LEED
The United States Green Building Council was established in 1993. In April of that year the first council meeting was held, and it consisted of 60 construction firms and a few nonprofit organizations (
USGBC, 2014
). The Leadership in Energy and Environmental Design program was launched in March 2000. At the time the USGBC was founded, there was much conjecture on what a “green building” was and how to develop a uniform code to standardize the green buildings (
Kriss, 2014
). The LEED program has evolved from a list of best practices to a highly organized method of rating green buildings. Five LEED programs exist, and each includes specific project types and credits. In 2000, 51 projects were part of the very first LEED for new construction rating system (
USGBC, 2012
).
The LEED program is a set of building standards and practices that operate on a credit-based rating system organized by categories. There are five of these main credit categories, and each has a set number of possible LEED credits. Some categories have prerequisites that must be met and no credit is awarded for. The LEED for Homes rating system began as a pilot program in 2005, and by 2006 the first LEED for homes project was certified in Oklahoma City, OK ( USGBC, 2015 ). The LEED for Homes program became official in 2008 ( USGBC, 2015 ). There are eight credit categories for the LEED Homes rating system, and each category is divided into subcategories. The LEED for Homes certification process consists of four steps: registration, verification, review, and certification ( USGBC, 2015 ).
Mapp, Nobe, and Dunbar ( 2011 ) compared the cost of eight non-LEED banks and two LEED-certified banks with similar building types and sizes located in western Colorado. The purpose was to assess the cost directly associated with seeking LEED certification using total building cost, square footage cost, soft costs, and hard costs. Findings from this study show that when the total building cost per square foot of the LEED certified banks were compared with the eight non-LEED certified banks they were within the square footage costs for all ten banks. This study also estimated the direct cost associated with LEED certification and found that the direct costs LEED certification were below 2% of the total project cost and between 1.5% and just over 2% of the total building cost. It was concluded that across very similar projects it was possible to achieve LEED certification for minimal additional costs, and the costs associated with the LEED projects were always within the overall range of the non-LEED projects ( Mapp et al., 2011 ).
Reposa ( 2009 ) compared the applicability, requirements, verification, fees, and construction cost for LEED for Homes to two other NAHB residential green rating programs. He found that the fees associated with LEED for Homes range from $50 to $100 for enrollment, $250 to $400 for certification, $300 to $1,000 for the provider, $100 to $150 for initial dry wall inspection by Green Rater, and $350 to $700 for second inspection and document review by the Green Rater. This resulted in a total added cost of fees for LEED certification to be $1,050 to $2,350. The study also reported that the cost of fees could increase, depending on the level of familiarity the subcontractors have with the LEED for Homes rating system. Inexperienced subcontractors may require on the job training, which costs approximately $150 per. It is important to note that subcontractors who are inexperienced with the LEED program and its procedures are a significant factor in the added cost in both fees and construction. The level of experience causes significant variability in the added cost of LEED for Homes certification. Mr. Mullen, the Director of Residential Business Development for the USGBC confirmed that the experience of the general contractor and subcontractor can have a significant effect on the added cost for LEED certification. Reposa ( 2009 ) reported the additional constructioncompliance cost for the four levels of LEED certification. This study found that the added construction costs for LEED- certified singlefamily homes represented an increase of 4 to 6%; the added cost of a LEED Platinum level single-family home represented an added cost of 20 to 22%. The LEED for Homes program had the highest added cost of all three programs used in the study. The LEED for Homes program cost was nearly double the other two programs.
It is important to note that the above figures from Reposa ( 2009 ) were estimated using only two model homes from varying geographic locations. These results may not reflect the most accurate estimated added construction cost for LEED certification in Kentucky based off of an interview with a homebuilder that built a LEED Gold certified single-family home in the Northern Kentucky area. The interviewed homebuilder built a LEED Gold certified singlefamily home and stated an estimated additional construction cost of $10,000.
Based on the limited information pertaining to LEED certified single-family homes in Kentucky; this study was performed in order to relate the cost effectiveness of building LEED certified single-family homes to Kentucky. This was achieved by using utility cost, home cost, and home size sample populations taken from select counties in Kentucky to determine if the initial added cost was financially justified by the expected monthly utility cost savings.
Objectives
There are two primary objectives of this study.
One centers on the construction cost of LEED
certification, whereas the other deals primarily
with the financial justification of the LEED
construction cost. The two objectives follow:
- Determine the estimated added construction cost of a LEED-certified single-family home in the selected counties of Kentucky (Fayette, Jefferson, Spencer, Boone, Kenton, and Campbell County).
- Analyze the cost effectiveness of a LEEDcertified single-family home in the selected counties of Kentucky (Fayette, Jefferson, Spencer, Boone, Kenton, and Campbell County).
Added Construction Cost
It is apparent that there is an added construction
cost associated with building LEED certified
homes. For this study descriptive statistical
analysis was used, in conjunction with data and
findings from the USGBC and the National
Association of Home Builders (NAHB), on a
sample size of least 20 homes per county to
estimate the added construction cost of each
LEED level in each county and analyze the
results. Multiple listing services were used to
collect the sample population for each county.
In order for a home to qualify to be used in the
sample population the following criteria had to
be met: (a) single-family (b) new construction
(c) 3-4 bedrooms (d) 2-3 bathrooms (e) no
added sustainable features, and (f) no addedvalue
items. The NAHB periodically conducts
a study regarding cost of a new- construction
single-family home based on surveys taken
from homebuilders across the United States.
This study breaks down the total cost into seven
categories, according to cost and percentage
of the total sale value of the home. The 2013
NAHB survey shows the construction cost of a
home was 61.7% of the total value of the home
(
Taylor, 2014
). For the purposes of this study
the construction cost of the sample homes were
obtained using the 61.7% of the list price.
The added construction cost associated with each LEED level was calculated using a percentage of the estimated construction cost mentioned above. The added LEED percentages are as follows: (a) LEED Certified 4%, (b) LEED Silver 7%, (c) LEED Gold 10%, (d) LEED Platinum 13%. These percentages were figured through communications with LEED professionals and homebuilding organizations that have previously built LEED certified homes. The average added construction cost of a LEED Certified level home stated by the Director of Residential Business Development for the USGBC was around 3% ( Mullen, personal communication, January 25, 2014 ). For this study a 4% added construction cost for a LEED Certified level home was used. The added construction cost for a LEED Gold single family home reported by a homebuilding organization in Covington, Ky. was 9% (Petronio, personal communication, January 26, 2014). For this study a 10% added construction cost for a LEED Gold level home was used. The Silver and Platinum level percentages (7% and 13%) were based on intervals using the Certified and Gold level percentages.
The added percentages for all four levels of LEED certification were applied to each of the construction costs. Equation 1 was used to extract the added construction cost from the home list price. Each sample home’s construction cost yielded four figures representing the added cost for each level of LEED certification.
(List Price×0.617) × (0.04, 0.07, 0.10, and 0.13) = Added LEED Construction Cost…….. (1)
Cost Effectiveness of LEED Certified Homes
The added LEED construction cost data was used for the payback period analysis and 30- year mortgage analysis with the addition of monthly utility costs for traditional and LEED- certified single-family homes. Descriptive statistical analysis was performed on the payback period results for each LEED level in each county to compare the payback periods internally and against the other counties.
The method was to use the data provided by the USGBC on the utility efficiency of LEED certified homes. According the USGBC, LEED for homes projects, on average, are 20% to 30% more efficient than a typical residential project built to code ( USGBC, 2005 ). The LEED for Homes program mandates that a home must be Energy Star certified before it can be LEED certified. The Energy Star program states that Energy Star certified homes are at least 15% more efficient compared to traditional code built homes. Based on the Energy Star prerequisite a LEED home is, at minimum, 15% more utility efficient than a traditional code built home. The percent reduction figures chosen for this study are as follows and apply to both the payback period analysis and 30-year mortgage analysis: (a) LEED Certified 15%, (b) LEED Silver 20%, (c) LEED Gold 25%, and (d) LEED Platinum 30%. The sample populations for each county are shown in Table 1.
Payback and Mortgage Analysis
For Fayette, Jefferson, Spencer, Boone, Kenton, and Campbell County the payback period for each LEED level was calculated by dividing the added the construction cost by the respective utility savings per month. The utility cost used in the payback period analysis was based on a cost per square foot. The average monthly utility cost in Kentucky in 2011 was $148 (
Wheeland 2012
). The $148 monthly utility cost was based on expenditure tracking on utilities from January through October, 2011. Accounting for 2% inflation, the monthly utility cost in 2013 translates to $154. The $154 was divided by the median square footage of all six counties (2116 sq. ft.) yielding $0.073 per square foot. The estimated utility cost for each sample home was calculated by multiplying its square footage by $0.073.
The mortgage analysis used a 30-year fixed mortgage period with a constant interest rate of 4.25% for all six counties. The mortgage analysis was performed on each county using the median values of home cost and added LEED cost calculated in the descriptive statistical analysis, and the cost of living index utility cost. The total fixed mortgage monthly payment was calculated using Equation 1. The 30-year mortgage analysis was performed comparing the traditional home to the LEED Certified level using a 15% down payment.
The utility cost for the 30-year mortgage period used the national average monthly utility cost and a cost of living index. The national average utility cost was $163 in 2011 ( Wheeland, 2012 ). Accounting for inflation, the national monthly utility cost in 2013 translates to $169.58. The cost of living index used uses the national average at 100 and assigns locations a score either greater or less than 100, representing that locations’ utility costs in relation to the national average ( bestplaces.net 2012 ). For this study the cost of living index score for each county was expresses as a percent then multiplied by $168.58, yielding a utility cost unique to each county.
Table 1: Sample Data Population for the Selected Counties of Kentucky
| Data Population for Selected Counties of Kentucky | |||||||
|---|---|---|---|---|---|---|---|
| Fayette County | Jefferson County | Northern Kentucky | Spencer County | ||||
| Home Cost ($) | Square Feet | Home Cost ($) | Square Feet | Home Cost ($) | Square Feet | Home Cost ($) | Square Feet |
| 169300 | 1950 | 188400 | 2365 | 181000 | 2200 | 199000 | 1444 |
| 183200 | 2181 | 197354 | 2018 | 181900 | 2149 | 160000 | 1370 |
| 188842 | 1855 | 197696 | 2200 | 205990 | 2160 | 160000 | 1300 |
| 191950 | 1976 | 205900 | 1886 | 224900 | 2357 | 209300 | 1602 |
| 196679 | 2423 | 208000 | 2198 | 224900 | 2365 | 179900 | 1362 |
| 198243 | 1853 | 210000 | 2086 | 230195 | 2197 | 169900 | 1362 |
| 205433 | 2274 | 217900 | 2101 | 262900 | 2367 | 200847 | 2016 |
| 208908 | 1938 | 218870 | 1960 | 194990 | 2200 | 219900 | 2451 |
| 229900 | 2551 | 223041 | 1886 | 199000 | 1738 | 159900 | 1800 |
| 233248 | 1938 | 224900 | 2140 | 192000 | 1775 | 143558 | 1135 |
| 239900 | 2456 | 233765 | 2101 | 189900 | 1741 | 209000 | 2086 |
| 239900 | 2265 | 239900 | 2010 | 234900 | 2357 | 201000 | 2240 |
| 245640 | 2127 | 254500 | 2221 | 294900 | 2776 | 216900 | 2464 |
| 249500 | 2005 | 305600 | 2715 | 199000 | 1931 | 204500 | 1828 |
| 263860 | 2410 | 140000 | 2770 | 262900 | 2367 | 199900 | 2016 |
| 268280 | 2464 | 237900 | 1860 | 182990 | 1883 | 194500 | 1725 |
| 269000 | 1804 | 230948 | 2997 | 192000 | 1715 | 245900 | 2243 |
| 269900 | 2100 | 305600 | 2715 | 235990 | 2160 | 174900 | 2066 |
| 291500 | 2397 | 388696 | 2921 | 239900 | 2105 | 166000 | 1727 |
| 312178 | 2465 | 399900 | 2456 | ||||
| 313872 | 2884 | 239900 | 1896 | ||||
| 211330 | 2300 | ||||||
| 350000 | 2292 | ||||||
| 299900 | 2232 | ||||||
| 234755 | 2100 | ||||||
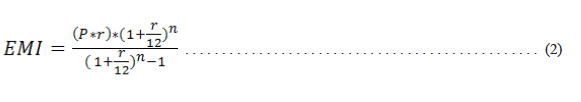
P = principal barrowed amount
r = annual interest rate
n = number of monthly payments
EMI = fixed monthly payment
Figure 1 is a graphical representation of the median new construction home cost in the four county areas stated above. In Figure 1 it is shown that Fayette and Jefferson County have similar new construction home costs. It is also shown that Fayette County has the highest cost of new construction single-family homes and Spencer County has the lowest cost of new construction single-family homes.
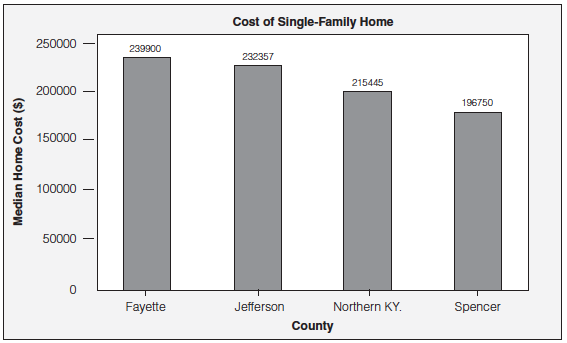
Figure 1. Comparison of the median home list prices of the selected
counties of Kentucky (Northern KY refers to Boone, Cambell, and Kenton Counties)
Figure 2 shows the median square footage of the four areas. Figure 2 shows that Northern Kentucky was similar in square footage despite having a considerably lower median home cost. The relationship between home cost and square footage in northern Kentucky translates to a higher cost per square foot than the other areas studied. Spencer County was the most rural area as the other three areas are more representative
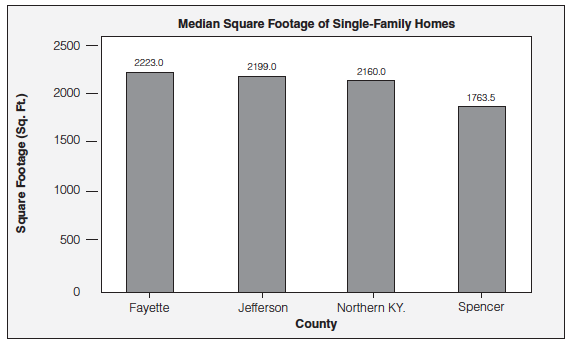
Figure 2. Median square footage of a new construction single-family home in all four counties.
of metropolitan areas. The rural nature of Spencer County is most likely the cause for the lower home cost and square footage.
Figure 3 shows the added construction cost for each LEED level in each county. As stated above the added LEED cost between levels in an individual county was proportional. This is because the LEED cost for the four levels for one home was estimated using a percentage from the list price of that home. However, there is some variability in added LEED construction cost. It is important to note that based on the percentages used in this study the added construction cost for the LEED Certified level are minimal, ranging from nearly $5,000.00 to just under $6,000.00.
Figure 4 shows the payback periods in years for each LEED level in each county. A significant finding shown in Figure 4 is that all four counties the LEED Certified level had a payback period between 19 and 21 years. The importance of this finding is that it shows the initial added construction cost associated with the LEED certification will be paid back before a typical 30 year mortgage period ends based solely on utility cost savings. Northern Kentucky and Spencer County were the only areas that a LEED Gold level home had payback period of less than 30 years. This is due to a lower median home cost and because the LEED cost was calculated using a percentage of the list price it resulted in a slightly lower added LEED cost than Fayette and Jefferson County. It is important to note that the LEED utility reduction percentages were conservative estimates and in actuality the efficiency may be greater than stated in this study.
The square footage of LEED certified home is a more significant factor in determining the payback period than the LEED reduction in utility cost. This is evident when comparing Jefferson and Spencer County. Jefferson County had the highest monthly utility cost resulting in the greatest LEED utility cost reduction of the four counties, but Spencer County had the smallest median square footage of the four counties. As seen in Figure 4, Spencer County had the shortest payback period for all four LEED levels, although Northern Kentucky had very similar results to Spencer County. The payback period for each LEED level was very similar among all four counties used in this study. Under the conditions of this study the location of the LEED-certified single-family home does not seem to be a significant factor in the payback period. However, it is important to consider the communication and multiple inspections by the green rater. The cost pertaining to proximity to these organizations was not considered in this study but could potentially be another aspect of the LEED costs in which case should be factored into the soft costs associated with LEED certification.
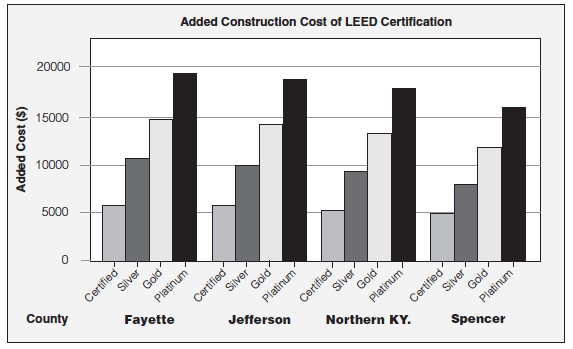
Figure 3: Comparison of the added construction cost
for the four LEED levels in each county.
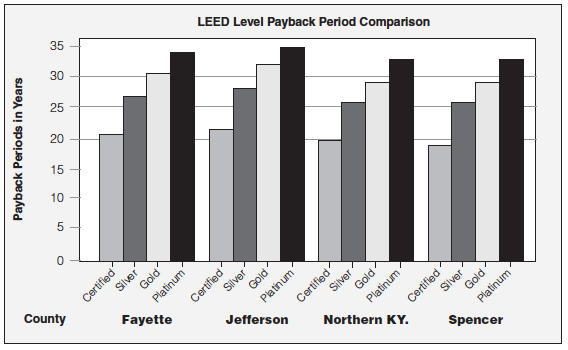
Figure 4. Comparison of the estimated payback period
for the four LEED levels in each county.
Figure 5 shows the total 30year cost net difference for a fixed 30-year mortgage period using a 15% down payment, with an interest rate of 4.25% for a traditional home and a LEED Certified level home in each county. The 30-year total cost is comprised of the total amount paid over the 30-year mortgage period (not including the down payment) and the total utility cost over the 30-year mortgage period.
Figure 5 is a comparison of the total 30-year costs based on the median values of traditional home costs, the added LEED Certified cost, and the cost of living index utility costs. Figure 5 shows that Jefferson and Spencer County produced a net gain, but Fayette County and Northern Kentucky produced a net loss over the 30-year mortgage period. Though the net gain or loss was small, especially considering it is over the course of a 30-year period. Under the conditions of this study, the added cost of construction associated with LEED certification does not produce a significant net cost over a traditional home during a typical 30-year mortgage period. The two counties with the greatest monthly utility cost are the two counties that produced a positive gain. These results show the utility cost of a specific area is a very significant factor in determining the cost effectiveness of LEED certified single-family homes. The importance of this finding is it showed that there is little difference, financially, between traditional homes compared to LEED Certified level homes. It is important to note that the 30-year total is based solely on added construction costs and utility efficiency.
Recommendations:
Sustainable design will continue increase in acceptance and become the standard for building new construction projects, both commercial and residential. The rising cost of utilities and the increasing concern of environmental impact are the two main factors pushing the industry toward building LEED certified. This study focused on providing the general public of Kentucky with information regarding the relationship between the expected added cost of building LEED and the expected utility savings that is associated with the various LEED levels.
This study found that the costs of the LEED Certified level to be minimal; the average of the median values was just under $5,500 for all four counties. The LEED level the reported the highest added cost was the LEED Platinum level in Fayette County at just over $19,000. A significant finding from the pay period analysis was that all the LEED Certified level single-family homes had a payback period between 19 and 21 years. Another finding was that the LEED Gold level payback periods were very close to the 30-year period, ranging from
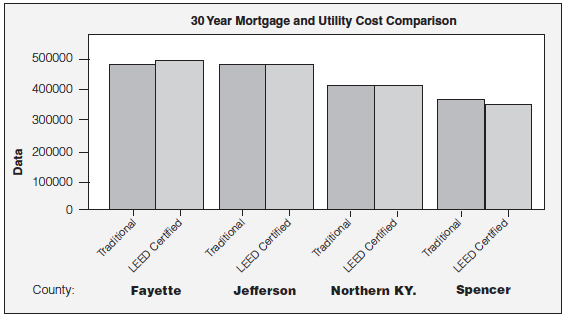
Figure 5. Comparison of the total 30-year mortgage cost using a 15% down
payment, and a 4.25% interest rate.
29.5 to 31.5 years. The payback period for the LEED Platinum level was slightly longer than the Gold level by a margin of at most 4 years. The results from the economic analysis were very significant in that the greatest net loss was only $1,200.00 and the greatest net gain was $1,700.00. This is significant because it shows that over the course of 30-year mortgage period the added construction cost LEED certification is essentially negligible.
This study has shown that individuals considering building an LEED certified singlefamily home under the conditions used in this study in Fayette, Jefferson, Boone, Kenton, Campbell, or Spencer County that (a) The LEED Certified and Silver levels added construction cost have pay back periods less than 30 years and (b) if a 30-year fixed mortgage is used, the overall added construction cost for a certifiedlevel single-family home is minimal. Based on the findings from this study, the following recommendations were made:
- It is recommended that the legislators and policymakers of Kentucky develop some type of state and municipal tax credits that make building LEED certified homes more financially appealing to both home owners and homebuilders. A case study of municipal tax credits supporting LEED certification is the city of Cincinnati, OH. The tax incentive is 100% property tax abatement for 15 years for building a new construction LEED-certified home ( DSIRE.org, 2013bestplaces.net ). As stated previously in this study Ohio has a total of 318 LEED certified single-family homes and 49% of those homes are in Cincinnati ( USGBC, 2014 ).
- It is suggested that the banking industry provide lower interest rates on mortgage loans to those building LEED-certified homes. As shown in the 30 year mortgage analysis portion of this study, a traditional home and LEED Certified level home using a an identical down payment and interest rate had very minimal difference in total cost between the two homes. A lower interest rate given to those building a LEED-certified home would directly aid in offsetting the added soft and construction costs of building LEED certified homes in Kentucky.
Stephen Glossner received his Master’s degree in Industrial Engineering in 2014 from Morehead state University, Kentucky. He is a member of the Gamma Mu Chapter of Epsilon Pi Tau.
Dr. Sanjeev Adhikari is an Associate Professor of Civil Engineering and Construction Management at the Department of Engineering and Technology, School of Engineering and Information Systems at Morehead State University (MSU), Morehead, Kentucky.
Dr. Hans Chapman is an Associate Professor of Design and Manufacturing at the Department of Engineering and Technology, School of Engineering and Information Systems at Morehead State University (MSU), Morehead, Kentucky. He is a member of the Gamma Mu Chapter of Epsilon Pi Tau.
References
Cost of Living . (2012, June). Retrieved June 4, 2014, from Sperling’s Best Places: http://www.bestplaces.net/cost_of_living
Database of State Incentives for Renewables and Efficiency (DSIRE). (2013, February 21). Ohio Incentives/Policies for Renewables and Efficiency . Retrieved May 31, 2014, from DSIRE.org: http://www.dsireusa.org/incentives
Database of State Incentives for Renewables and Efficiency (DSIRE). (2013, February 21). Ohio Incentives/Policies for Renewables and Efficiency . Retrieved May 31, 2014, from DSIRE.org: http://www.dsireusa.org/incentives
Kriss, J. (2014, February 20). The Story of LEED Part 1 . Retrieved February 21, 2014, from USGBC. org: http://www.usgbc.org/articles/simple-idea-several-hundred-billion-dollar-industry
Kriss, J. (2014, January 23). U.S. Green Building Council Certifies 50,000th Green Housing Unit Under LEED for Homes . Retrieved February 20, 2014, from USGBC.org/articles .
Mapp, C., Nobe, M. C., & Dunbar, B. (2011). The cost of LEED - An analysis of the construction costs of LEED and non-LEED banks. JORSE , 254-273.
Mullen, K. (2014, January 25). Director of Residential Business Development. (S. Glossner, Interviewer)
Petronio, D. (2014, January 26). Cost of LEED Single-Faimily Home. (S. Glossner, Interviewer)
Rating Systems . (n.d.). Retrieved 1 14, 2014, from LEED: http://www.usgbc.org/leed/homes
Reposa Jr., D. J. (2009). Comparison of USGBC LEED for homes and the NAHB National Green Building Program. Construcion Education and Research , 108-120.
Schmidt, C. W. (2008). Bringing green homes within reach: Healthier housing for more people. Environmental Health Prospectives , 24-31.
Taylor, H. (2014, January). Cost of Constructing a Home . HousingEconomics.com
U.S. Green Building Council. (n.d.). LEED . Retrieved 2014, from USGBC Web site: http://www.usgbc.org/leed .
U.S. Green Building Council. (2005, ). Rating System for Pilot Demonstration of LEED for Homes Program. United States.
Wheeland, M. (2012, January 18). Shock Value: The Rising Cost of Utilities in America . Retrieved June 4, 2014, from Pure Engergies: http://pureenergies.com/us/blog/infographic-americanspending-on-utilities/
by EMW