JSTE v48n1 - Performance and Cognitive Assessment in 3-D Modeling
Performance and Cognitive Assessment in 3-D Modeling
Nolan E. Fahrer
Athens Drive High School
Jeremy V. Ernst
Virginia Polytechnic Institute and State University
Theodore J. Branoff
Aaron C. Clark
North Carolina State University
Abstract
The purpose of this study was to investigate identifiable differences between performance and cognitive assessment scores in a 3-D modeling unit of an engineering drafting course curriculum. The study aimed to provide further investigation of the need of skill-based assessments in engineering/technical graphics courses to potentially increase accuracy in evaluating students’ factual and conceptual knowledge in preparation for the workplace. The study consisted of 92 high school students enrolled in Drafting II-Engineering. Students were administered existing assessment items provided in the 3-D Modeling unit of the Drafting II-Engineering curriculum. The results provided evidence that there were no significant differences between performance and cognitive assessment in the particular unit; however, it is necessary to further develop and implement performance-based assessments in Career & Technical Education that require students to exhibit both skills and knowledge.
Introduction
Over the years, state and national education organizations have set standards and used initiatives such as the No Child Left Behind Act of 2001 (2002) , Carl D. Perkins Career and Technical Education Act of 2006 (2006) , and the amended Elementary and Secondary Education Act of 1965 (2002) to help improve state curricula and instruction. Improvement in such areas often includes updating or introducing new curricula and utilizing standardized assessments to gauge school quality and teacher effectiveness. While these transformations in educational practice and instruction are somewhat effective, changes in assessment practices are also required ( Firestone & Schorr, 2004 ).
The primary role assessment plays in education is to enhance student learning through classroom instruction and it is secondarily used to hold teachers and institutions accountable and stimulate educational reform ( Herman & Aschbacher, 1992 , NCTM, 1993 , and Linn, 2000 ). Too frequently standardized assessments encourage a narrow, instrumental approach to learning that emphasizes the reproduction of what is presented at the expense of critical thinking, deep understanding, and independent activity ( Boud, 1990 ). A common form of standardized assessment is curricular tests. Standardized curricular tests are generally used at the state level for school accountability and to better assess students’ mastery of approved skills and knowledge. However, educational researchers have observed that most items on standardized curricular tests often require little more than students’ recall of facts to arrive at a correct answer ( Masters & Mislevy, 1993 ). Kiker (2007) notes that business and industry leaders, as well as school reform advocates, generally agree that in order for students to be successfully prepared for further education and/or the workforce requires more than traditional core academic skills. In order to gauge successful development of performance skill, assessments must accurately measure what knowledge students have learned and can demonstrate, whether academic or career oriented. Cognitive assessment may suffice for disciplines that do not fully subscribe to constructivist learning theory, but Career and Technical Education (CTE) frameworks necessitate holistic assessment means and methods that incorporate performance measures ( Rojewski, 2002 ).
Review of Literature
Improvement of curricula and instruction often includes updating or introducing new curricula and utilizing standardized assessments to gauge school quality and teacher effectiveness. Development of assessments must measure 21 st century skills and accurately represent what knowledge students have learned and can demonstrate, whether academic or career oriented ( Gordan, 1998 ). In addition, these skills are commonly required for functioning in industry and illuminate students’ learning and thinking processes ( U.S. Office of Technology Assessment, 1992 ).
Due to their specialized nature, skills found in engineering/technical graphics and other courses in CTE may require multiple types of assessment. However, the current school accountability measurement system leans heavily in favor of using only standardized cognitive assessment. Educational practitioners discuss performance assessment as being a worthy alternative assessment to be utilized in conjunction with existing standardized cognitive assessments ( Flexer & Gerstner, 1993 ). However, further research is needed in the field to identify how performance assessment can be utilized as a viable form of assessment in engineering/technical graphics courses.
Cognitive assessments generally come in the form of objective paper and pencil classroom test items and standardized tests used for external assessment. Traditional objective classroom assessments are frequently summative and are used for final exams and other forms that require the teacher to assign a grade ( Cross & Angelo, 1988 ). According to Linn (1993) these types of assessments focus on basic skills and practice of factual knowledge. However, multiple choice objectivity types of tests are convenient for teachers because they can be automatically scored, and their markings are assured of having no form of bias ( Baker, 1997 ).
A standardized test is generally defined as any test that is administered, scored, and interpreted in a consistent, predetermined manner. Popham (2002) indicates that standardized assessments can be found in two forms, national achievement tests and standardized curricular tests. National achievement tests are standardized assessments that are commonly designed to determine how a test taker will perform in a subsequent setting. In 2001 there were five nationally standardized achievement tests, such as the Iowa Tests of Basic Skills, that were used in the United States public schools ( Popham, 2002 ). Popham (2002) states that there is a high likelihood that the specific content included in this and similar tests may be seriously inconsistent with local curricular aspirations. Many education policy makers assume that national achievement test content will mesh well with what is supposed to be taught locally, but test takers must cope with considerable national curricular diversity. A study at Michigan State University conducted almost two decades ago suggests that as many as 50 percent of the items included in a nationally standardized achievement test may cover content that is not taught in a given locality ( Popham, 2002 ).
Standardized curricular tests are widely used types of cognitive assessment and are generally used at the state level for school accountability and to better assess students’ mastery of approved skills and knowledge. According to Boud (1990) , in many cases these tests encourage a narrow, instrumental approach to learning that emphasizes the reproduction of what is presented at the expense of critical thinking, deep understanding, and independent activity. As a result, schools and teachers tend to narrow their curricula and courses with the aim of helping students pass tests from external agencies ( Baker, 1997 ). In a study conducted by Tan (1992) , he concludes that frequent usage of formal standardized curricular testing causes negative effects on our education system even with tests well linked to instruction. Many argue that alternative types of assessment should be used. If alternative assessments are implemented properly, motivation and learning progress will increase and school instruction can be correctly evaluated for effectiveness ( Dochy & McDowell, 1997 ).
Administrators and educational researchers are becoming increasingly interested in alternative assessment. There is no single definition of alternative assessment, but it has been described as an alternative to standardized testing and all of the problems found with such testing ( Huerta-Macías 1995 ). Garcia and Pearson (1994) include the following in their review of these labels: performance assessment, portfolio assessment, informal assessment, situated (or contextualized) assessment, and assessment by exhibition. They state that alternative assessment consists of all efforts that do not adhere to the criteria of standardization, efficiency, cost effectiveness, objectivity and machine scoring. Most importantly this type of assessment provides alternatives to traditional testing in that it reviews regular classroom activities, reflects the curriculum that is actually being implemented in the classroom, provides information on the strength and weaknesses of each student, provides multiple pathways to gauge student progress, and is more multi-culturally sensitive and free of norm, linguistic, and cultural biases found in traditional testing ( Garcia & Pearson, 1994 ).
Many researchers inquire if alternative assessments can be aligned to many of the states’ general or functional curricula. Browder and Flowers (2004) conducted a study in three states where experts in mathematics and language arts, along with a group of stakeholders (teachers and administrators), examined the performance indicators relative to their alignment to national standards and curricula. On the surveys, 86 percent of math experts and 70 percent of stakeholders indicated that performance indicators were clearly linked to national math standards. Eighty-six percent of language arts experts and 100 percent of stakeholders that responded to the survey indicated that performance indicators were clearly aligned to language arts standards. The results suggest that alternative assessments have a strong focus on academic and functional skills.
A widely used form of alternative assessment is performance assessment. Performance assessment is defined as “testing methods that require students to create an answer or product that demonstrates their knowledge or skills” ( U.S. Office of Technology Assessment, 1992 ). According to Elliot (1997) performance assessments are best understood as a continuum of assessment formats that range from the simplest student constructed responses to comprehensive demonstrations of work over time.
Performance assessment of students’ achievement is not new to many educators but is usually only apparent in the areas of physical education, art, music, and vocational and technological arts. To a large extent, students’ products or performances are used to determine whether learning objectives of a class have been met ( Elliot, 1997 ). However, performance assessment is becoming more prevalent in core classes such as mathematics, science, language arts, and social studies. In a study conducted by Flexor and Gerstner (1993) , issues involving the construction of alternative forms of assessment by mathematics teachers were studied through the case study of assessment development in three elementary schools. Three schools with 14 third-grade teachers were selected and matched with three comparison schools where data would also be collected. The three schools continued to use the end-of-chapter tests, but they supplemented those with other assessments that involved more conceptual understanding and higher order thinking. It was concluded that even though there were dilemmas among teachers, positive effects were observed in their students using performance assessment.
Research Question
The research question examined in this study was: Is there an identifiable difference between performance assessment scores and cognitive assessment scores in the 3-D Modeling unit of a state Drafting II-Engineering curriculum? To further investigate that question, the following research hypotheses were proposed:
- There is no significant difference in means of the student participants’ performance and cognitive assessment scores in the 3-D modeling unit.
- There are no significant differences in means of the student participants’ performance and cognitive assessment scores in the 3-D modeling unit among grade levels.
To evaluate the first hypothesis, a paired samples T-test was used to determine if differences existed between the means of the assessments. The second hypothesis was evaluated through an analysis of variance procedure used to determine differences in the means of the assessments among grade levels.
Participants
The participants in this study were enrolled in the Drafting II-Engineering course of study in a North Carolina public school. Drafting II-Engineering introduces students to the use of the graphic tools necessary to communicate, analyze, and understand the ideas and concepts found in the areas of engineering, science, and mathematics. Topics include teaming and communication skills, 3D modeling, manufacturing processes, dimensioning and conventional tolerancing, sectional views, auxiliary views, and pattern development. This course is demanding, requiring the application of complex visualization and computer skills. These skills are used to assess, communicate, and design virtual and physical models used in science, mathematics, manufacturing, transportation, and structural systems ( North Carolina Department of Public Instruction, 2005 ). The principles learned were applied using a constraint-based modeling program provided by the local education agency.
The Drafting II-Engineering classes in this research were taught in the spring semester of 2009. Student participant demographic data was collected and summarized in Table 1.
| Category | Frequency | Percent |
|---|---|---|
| Gender | ||
| Female | 8 | 8.7 |
| Male | 84 | 91.3 |
| Class | ||
| Freshman | 3 | 3.2 |
| Sophomore | 22 | 23.9 |
| Junior | 41 | 44.6 |
| Senior | 26 | 28.3 |
The make-up of the participants in this study enrolled in Drafting II-Engineering during the spring semester of 2009 was 8 females and 84 males. These students ranged from 14-19 years old and included 3 freshman, 22 sophomores, 41 juniors, and 26 seniors. There were approximately ten times as many males as females participating in the study. A very low percentage of participants were classified as freshmen, likely due to the enrollment restriction of Drafting II-Engineering until completion of the pre-requisite Engineering/Technical Graphics I course. A high percentage of participants was classified as juniors and seniors primarily due to engineering/technical graphics instructors suggesting that students complete a geometry course that is traditionally a sophomore level math prior to enrolling in Drafting II-Engineering.
Data Collection
A research proposal was submitted to the Institutional Review Board in order to gain approval for the study. Next, the study topic was discussed with local education agency professionals and permission of involvement in the research study was granted. During the traditional school year, high school level career and technical education teachers in the local education agency meet quarterly with their respective professional learning communities. This venue was utilized to discuss the topic of the study and spur interest among the drafting/aerospace instructors. After gaining IRB approval a survey was handed out to all Drafting II-Engineering course instructors. The survey inquired about the instructors’ participation interest in serving as test administrators and the approximate student enrollment for the spring semester. All Drafting II-Engineering course instructors volunteered to participate in the study and serve as test administrators for the 92 student participants. Following the meeting, an email was sent to the surveyed instructors to provide further details about the study and to finalize the list of participating instructors.
During the next drafting/aerospace meeting the test materials were provided to the instructors and explained in detail to ensure an efficient process. The test materials included the following items: 1) instructions numerically outlining test administration procedures, 2) the cognitive assessment including 68 multiple choice items, 3) scanning sheets for students to input their respective answers, 4) the performance assessment including a prescribed 3D-model problem, and 5) a USB flash drive to transport performance assessment data.
This study used existing assessments that all students enrolled in Drafting II-Engineering in North Carolina Public Schools would be administered regardless of the presence of this study. However, the testing materials provided to the participating instructors helped ensure proper consistency regarding teacher instruction and test administration. The performance and cognitive assessments were administered following the completion of the 3-D Modeling unit in the Drafting II-Engineering course curriculum. To ensure that test administration was consistent with all instructors, the following test procedures were strongly suggested: 1) Allow no more than 120 minutes for assessments to be completed, 2) Provide a computer with the district provided constraint-based modeling software to each student, 3) Administer the cognitive assessment and scan sheets foremost, 4) Administer the performance assessment individually following students’ completion of the cognitive assessment, 5) Collect all performance assessment data using the provided USB flash drive, 6) Place the USB flash drive with performance assessment data and scanning sheets with cognitive assessment data into a provided manila envelope and mail back to researchers.
During the course of the semester, the instructors administered the assessments to the student participants at the culmination of the 3-D Modeling unit of the North Carolina Drafting II-Engineering curriculum. Upon the participating instructors’ test administration completion, the testing materials were returned to the researcher and the cognitive and performance data were compiled. A common scanner scored the cognitive assessments, and the scores were calculated by state-provided course management system software. The performance assessment data were transferred to a North Carolina State University (NCSU) professor to be evaluated using the state-provided rubric.
Instrumentation
Since the main subject matter for this study is investigating identifiable differences between cognitive and performance assessments in the North Carolina state high school Drafting II-Engineering curriculum, the state-provided assessments included within the curriculum were used. All CTE assessments were provided by the North Carolina Department of Public Instruction in the course management system classroom test bank. All North Carolina Department of Public Instruction cognitive items are aligned with the standard course of study and have undergone reliability assessment and content validity checks ( North Carolina Department of Public Instruction, 2005 ).
The cognitive assessment was composed of 68 multiple choice test items that were provided in the course management system classroom test bank. These align with the objectives set forth for the 3-D modeling unit of the Drafting II-Engineering standard course of study by the North Carolina Department of Public Instruction. A scanning sheet accompanies the cognitive assessment for more efficient scoring purposes. The scanning sheet is aligned with the correct answers within the course management system test bank; therefore, student scores were assigned accurately.
The performance assessment was composed of a 3D-model and was also provided by the course management system test bank. This assessment challenged students to actively demonstrate their understanding of 3-D modeling techniques. The test item was given in the form of a multiview drawing and required students to construct a 3D-model using the provided constraint based modeling software. The test item was chosen because it is aligned with the objectives set forth for the 3-D modeling unit of the Drafting IIEngineering standard course of study by the North Carolina Department of Public Instruction and is part of the curriculum. A standard rubric is provided in the Drafting II-Engineering curriculum to evaluate the 3D-model prescribed. Similar to the cognitive assessment, the rubric provided was aligned with the correct answer within the course management system test bank; therefore, student scores were assigned accurately.
Data Analysis
Data were collected using cognitive and performance testing instruments provided by the North Carolina Department of Public Instruction and utilized through their course management software. Hypothesis 1 was analyzed using a paired sample T-test for a difference in means in the student participants’ performance and cognitive assessment scores in the 3-D modeling unit of the Drafting II-Engineering curriculum. Hypothesis 2 was analyzed using a One-Way Analysis of Variance (ANOVA) procedure to analyze data and investigate the differences in means in the student participants’ performance and cognitive assessment scores in the 3-D modeling unit of the Drafting II-Engineering curriculum among freshman, sophomore, junior, and senior grade levels.
Discussion and Findings
The 3-D Modeling unit of Drafting II-Engineering performance and cognitive data was investigated to find identifiable differences in the means. A scatter plot (Figure 1) of cognitive assessment scores and performance assessment scores was constructed to provide a visual representation of the array of student achievement for the 92 Drafting II-Engineering student participants.
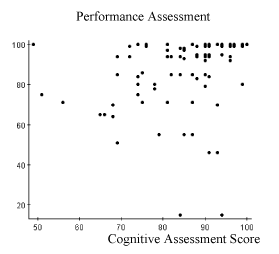
Scatter Plot of Scores
The scatter plot of the data does not display a clear linear alignment but does reveal clusters of scores and some outliers. The clusters demonstrate that many students scored well on the performance assessment but did not exhibit clear relationships between the assessments. However, the scatter plot does reveal some unusual outliers. Table 2 provides summary statistics of the cognitive and performance assessment scores.
| Column | Cognitive | Performance |
|---|---|---|
| N | 92 | 92 |
| Mean | 84.565216 | 84.934784 |
| Variance | 115.76493 | 422.43527 |
| Std. Deviation | 10.759411 | 20.55323 |
| Std. Error | 1.1217462 | 2.1428223 |
| Median | 87.5 | 94 |
| Range | 51 | 85 |
| Min | 49 | 15 |
| Max | 100 | 100 |
The average of the cognitive assessment scores (84.57 of a possible 100) for the 92 engineering/technical graphics student participants were noticeably similar to the performance assessment scores (84.93 of a possible 100). The variance (115.76) and standard deviation (10.76) of the cognitive assessment scores is small in comparison to the variance (422.44) and standard deviation (20.56) of performance assessment scores indicating a larger spread of the engineering/technical graphics student participation scores on the performance assessment. The standard error (1.12) of the cognitive assessment scores is much less than the standard error (2.14) of the performance assessment scores uncovering a larger variation in score values from participant to participant for the performance assessment. The median and means of the cognitive assessment exhibit minimal deviance suggesting a rather symmetrical score distribution for this assessment. However, the median for the performance assessment is much higher than the mean suggesting that there are a larger number of high scores for the performance assessment than the cognitive assessment. The range is calculated based on the minimum and maximum scores on the cognitive assessment and performance assessment. The minimum score (15) on the performance assessment is much lower than the minimum score (49) of the cognitive assessment reiterating the unusual outliers. The lower range (51) on the cognitive assessment in relation to the performance assessment (85) supports the degree of difference in the variability of engineering/technical graphics student participants between the two assessments (refer to Figure 2).
Figure 2 and Figure 3 represent the rate of occurrence for cognitive scores and performance scores for engineering/technical graphics student participants.
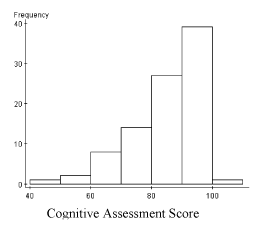
Cognitive Histogram
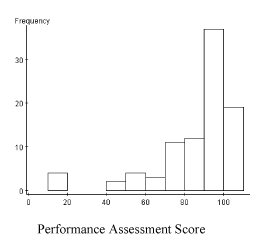
Performance Histogram
Both histograms are skewed to the left indicating an upper limit, in this case a maximum score of 100. A histogram representing a distribution is skewed if one of its tails is extended for the lowest or highest values. This non-symmetric distribution is positively skewed if the histogram has a distinguishable tail in the positive direction and negatively skewed in the negative direction ( Agresti & Finlay, 1997 ). Negative skewness is common in education where students are evaluated after a progression of learning exercises. The performance histogram exhibits a greater skew than the cognitive histogram due to the four engineering/technical graphics student participants’ scores of 15 out of 100. A hypothesis test was conducted given the clear similarities in the means with clear differences in the standard deviations of the engineering/technical graphics participant cognitive and performance assessments indicated. A paired samples T-test was used to evaluate hypothesis one: There is no significant difference in means of the student participants’ performance and cognitive assessment scores in the 3-D modeling unit. Table 3 summarizes the results of the analysis.
| Difference | Sample Diff. | Std. Err. | DF | T-Stat | P-value |
|---|---|---|---|---|---|
| Cognitive - Performance | 0.37 | 2.24 | 91 | 0.17 | 0.87 |
Based on the analysis of the T-statistic (-0.17) and the proportional value (0.87), Hypothesis One failed to be rejected, providing evidence that there is no significant difference in the means of the student participants’ performance and cognitive assessment scores in the 3-D modeling unit.
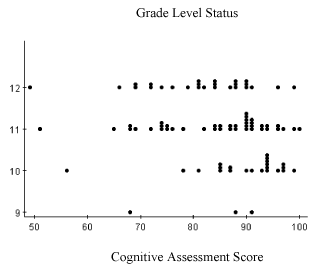
Dot Plots (see Figures 4, 5, and 6) of the cognitive assessment scores, performance assessment scores, and difference in assessment scores were constructed to provide a visual representation of the array of student achievement for the 92 engineering/technical graphics student participants divided by freshman, sophomore, junior, and senior grade level status. Figures 4, 5, and 6 reiterate that there are more student participants with junior and senior grade status. Figure 4 displays the cognitive assessment scores divided by grade level status and exhibit similarities in concentrated grouping around the 90 percentile reiterating the negative skewness in Figure 2.
VoCATS Dotplot
Figure 5 displays the performance assessment scores divided by grade level status and exhibit similarities in concentrated grouping in the upper 90 percentile reiterating negative skewness in Figure 3.
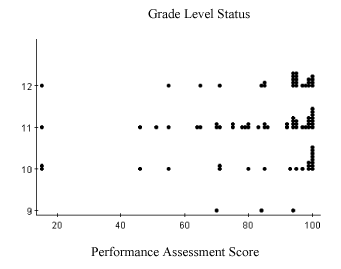
Performance Dotplot
Figure 6 displays differences in performance and cognitive assessment scores divided by grade level status and exhibits similarities in concentrated grouping near zero providing some visual evidence that there is little or no difference between the scores of the performance and cognitive assessments among grade levels.
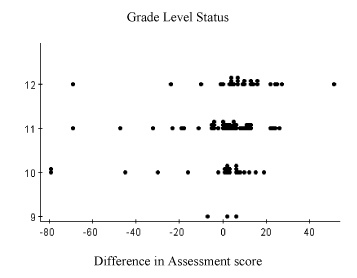
Performance Dotplot
An additional hypothesis test was conducted based on the differences in the means of Drafting II-Engineering participant performance and cognitive assessment scores among freshman, sophomore, junior, and senior grade levels. A One-Way Analysis of Variance (ANOVA) procedure was used to calculate the F-statistic to evaluate the second hypothesis: There are no significant differences in means of the student participants’ performance and cognitive assessment scores in the 3-D modeling unit among grade levels.
To assist in explanation, Tables 4, 5, and 6 are utilized to investigate identifiable differences in means of cognitive assessment scores, performance assessment scores, and difference of assessment scores among grade levels. Table 4 investigates identifiable differences in the means of the cognitive assessment scores among grade levels. Although the mean of sophomore participant scores (89.45) is significantly higher than the means of freshman, junior, and senior grade level participants, the proportional value (0.06) is greater than the established critical value (.05) providing evidence that there are no significant differences in the means of the cognitive assessment among grade levels.
| Factor Means | |||
|---|---|---|---|
| Grade | n | Mean | Std. Error |
| Freshman | 3 | 82.333336 | 7.2188025 |
| Sophomores | 22 | 89.454544 | 1.9942855 |
| Juniors | 41 | 84.268295 | 1.6853112 |
| Seniors | 26 | 81.15385 | 2.1047144 |
| Source | F-Stat | P-value |
|---|---|---|
| Treatments | 2.5648289 | 0.0597 |
Table 5 investigates identifiable differences in the means of the performance assessment scores among grade levels. Although the mean of senior participant scores (88.35) is significantly higher than the means of freshman, sophomore, and junior grade level participants, the proportional value (0.79) is greater than the established critical value (.05) providing evidence that there are no significant differences in the means of the performance assessment among grade levels.
| Factor Means | |||
|---|---|---|---|
| Grade | n | Mean | Std. Error |
| Freshman | 3 | 82.666664 | 6.960204 |
| Sophomores | 22 | 82.72727 | 5.739731 |
| Juniors | 41 | 84.12195 | 2.886722 |
| Seniors | 26 | 88.34615 | 3.6819487 |
| Source | F-Stat | P-value |
|---|---|---|
| Treatments | 2.5648289 | 0.0597 |
Table 6 investigates identifiable differences in the means of the differences of assessment scores among grade levels. Based on the analysis of the F-statistic (1.73) and proportional value (0.17), we fail to reject the second hypothesis providing evidence that there are no differences between the means of the Drafting II-Engineering student participants’ performance assessment scores and cognitive assessment scores among grade levels.
| Factor Means | |||
|---|---|---|---|
| Grade | n | Mean | Std. Error |
| Freshman | 3 | 0.33333334 | 3.8441875 |
| Sophomores | 22 | -6.7272725 | 5.839551 |
| Juniors | 41 | -0.14634146 | 2.8153675 |
| Seniors | 26 | 7.1923075 | 4.0504584 |
| Source | F-Stat | P-value |
|---|---|---|
| Treatments | 1.729463 | 0.1668 |
The researchers chose not to investigate identifiable differences in means between performance assessment and cognitive assessment scores in Drafting II-Engineering between genders due to the low numbers of female participants (8) making up only 8.7 percent.
Conclusions
Based on the results of this study, the following explanations could be made. First, although each assessment construct is different, the data suggests that students’ access of their content knowledge is consistent in performance and cognitive assessments in engineering/technical graphics. Second, students in freshman, sophomore, junior, and senior grade levels form skill-based knowledge in a consistent manner during instruction. Additionally, the data suggests that students in all high school grade levels access their content knowledge consistently in performance and cognitive assessments.
Performance assessment is a requirement for most skill-based courses in Career & Technical Education to properly gauge student competence and ability. This type of assessment often allows students the opportunity to learn through a more active process involving a students’ construction rather than a selection of responses. Learning in this fashion can be explained with the constructivist learning theory that in turn is often connected to performance assessment. CTE teachers who embrace this learning theory typically take advantage of instructional approaches that allow them to design instruction that goes beyond rote learning to meaningful, deeper long lasting understanding. In addition to being connected to the constructivist learning theory, skill-based courses in CTE that utilize performance assessment commonly attract kinesthetic learners. Students associated with this predominant type of learning style learn by actually carrying out the physical activity and benefit from performance assessment because it caters to their strengths.
Future research like this can open the possibility of modifying assessment practice, given the need for varied assessment for individual and school accountability. More research in engineering/technical graphics and other areas in Career & Technical Education is necessary to further develop and implement performance-based assessments that require students to exhibit both skills and knowledge.
Nolan Fahrer is an Engineering Drafting teacher at Athens Drive High School in Raleigh, North Carolina. He can be reached at nefahrer@ncsu.edu . Jeremy Ernst is an Assistant Professor at Virginia Polytechnic Institute and State University. He can be reached at jvernst@gmail.com . Theodore Branoff is an Associate Professor at North Carolina State University. He can be reached at Ted_branoff@ncsu.edu . Aaron Clark is an Associate Professor at North Carolina State University. He can be reached at Aaron_clark@ncsu.edu .
References
Agresti, A., and Finlay, B. (1997). Statistical methods for the social sciences (3rd ed.). Upper Saddle River: Prentice Hall, Inc.
Baker, E. L. (1997). Model based performance assessment. Theory into Practice, 36 (4), 247-254.
Boud, D. (1990). Assessment and the promotion of academic values. Studies in Higher Education , 15 (1), 101-111.
Browder, D. & Flowers, C. (2004). The alignment of alternate assessment content with academic and functional curricula. The Journal of Special Education, 37 (4), 211-223.
Carl D. Perkins Career and Technical Education Act of 2006, Public Law 109-270, 109th Congress. (2006)
Cross, P., & Angelo, T. A. (1988). Classroom assessment techniques: A handbook for faculty . Washington, DC: Second Printing.
Dochy, J. C. & McDowell, L. (1997). Introduction assessment as a tool for learning. Studies in Educational Evaluation, 23 (4), 1-20.
Elementary and Secondary Education Act of 1965, Public Law 107-100, 107 th Congress. (2002)
Elliot, S. N. (1997). The utility of curriculum-based measurement and performance assessment as alternatives to traditional intelligence and achievement tests. Academic Search Premier, 26 (2), 1-10.
Firestone, W. A. & Schorr, R. Y. (2004). Introduction. In W. A. Firestone, R. Y. Schorr and L. F. Monfils (Eds), The Ambiguity of Teaching to the Test (pp. 1-18). Mahwah, NJ: Lawrence Erlbaum.
Flexer, R.J., & Gerstner, E.A. (1993). Dilemmas and issues for teachers developing performance assessments in mathematics. a case study of the effects of alternative assessment in instruction, student learning and accountability practices . Paper prepared at the annual meeting of the American Educational Research Association, April 12-16. Atlanta, GA
Garcia, G. E. & Pearson, P. D. (1994). Assessment and diversity. In L. Darling-Hammond (Ed.), Review of Research in Education (pp. 337-391). Washington D.C.: American Education Research Association.
Gordan, H. (1998). Vocational education teachers' perceptions of their use of assessment methods. Journal of Vocational and Technical Education, 15 (1) , 8-16.
Herman, J. L. & Aschbacher, P. R. (1992). Rethinking assessment. In R. S. Brandt, N. Modrak, & G. R. Miller (Eds.), A practical guide to alternative assessment (pp. 8-16). Alexandria, VA: ASCD Publications.
Huerta- Macías, A. (1995). Alternative assessment: Responses to commonly asked questions. TESOL Journal, 5 (1), 8-11.
Kiker, J. (2007). Move beyond “seat time” and narrowly defined knowledge and skills. Techniques. 82 (5), 38-40.
Linn, R. L. (1993). Educational assessment: Expanded expectations and challenges. Educational and Policy Analysis, 15 (1), 1-16.
Linn, R. L. (2000). Assessments and accountability. Educational Researcher, 29 (2), 4-16.
Masters, G., & Mislevy, R.J. (1993). New views of student learning: Implications for educational measurement. In N. Frederiksen, R.J. Mislevy & I. Bear (Eds.), Test theory for a new generation of tests (pp.219-242). Hillsdale, NJ : Erlbaum.
National Council of Teachers of Mathematics (1993), Assessment standards for school mathematics: Working draft, Reston, VA: NCTM.
North Carolina Department of Public Instruction. (2005). Trade Industrial Education: 7972 Drafting II-Engineering Curriculum . Retrieved Jan. 11, 2009, from http://www.ncpublicschools.org/docs/cte/trade/curriculum/programs/guide/drafting2-engineering.pdf
No Child Left Behind Act of 2001 (NCLB), Public Law 107-110, 107 th Congress. (2002).
Popham, W. J. (2002, February). Right task, wrong tool: Evaluating schools with standardized tests. American School Board Journal , 189(2), 18-22.
Rojewski, J.W.(2002). Preparing the workforce of tomorrow: A conceptual framework for career and technical education. Journal of Vocational Education Research, 27 (1) , 7-35.
Tan, C.M. (1992). An evaluation of the use of continuous assessment in the teaching of physiology. Higher Education, 23, 255-272.
U.S. Office of Technology Assessment. (1992). Testing in American schools: Asking the right questions (OTASET-519). Washington, DC: U.S. Government Printing Office.