JTE - Spring 2008 v19n2 - Engagement and Achievements: A Case Study of Design-Based Learning in a Science Context
Engagement and Achievements:
A Case Study of Design-Based Learning in a Science Context
Yaron Doppelt, Matthew M. Mehalik,
Christian D. Schunn, Eli Silk, and Denis Krysinski
Introduction
A major goal of science education reform is to produce curricula that improve the learning of all students. In this study we explore the use of design based learning to achieve this end.
Unlike the great majority of industrialized nations in the world, K-12 education in the U.S. places very little emphasis on design and technology. Design and technology education is not a required subject in high school in most schools. Even in the middle school level, it is typically an elective subject and is not offered in all schools ( Dyer, Reed & Berry, 2006 ).
On the other hand, U.S. schools of engineering are placing more emphasis on teamwork, design process skills, and hands-on construction. For this and other reasons, various state science standards are beginning to push for a more serious role for design and technology in the K-12 curriculum. Yet current science K-12 curricula have not yet caught up, and the treatment of design and technology is typically weak. Most science curricula lack engineering background beyond information technology (IT) subjects ( De Vries, 1997 ).
There is a new development, under the general name of Design-Based Learning (DBL), that is attempting to address this problem ( Kolodner, et al., 1998 ; Rivet & Krajcik, 2004 ). The design process is rich and multifaceted and might be capable of producing new knowledge in a way that is analogous to the scientific inquiry process. What, then, is DBL and how does it relate to scientific inquiry?
Inquiry is a multifaceted activity that involves making observations; posing questions; planning investigations; reviewing what is already known in light of experimental evidence; using tools to gather, analyze, and interpret data; proposing answers, explanations, and predictions; and communicating the results. ( National Research Council, 1996 , p. 23).
Despite this grandiose definition of inquiry, most of the science curricula that are implemented in US schools use scripted-inquiry rather than authentic inquiry. In scripted inquiry, the teachers set the goal, ask the questions, provide the materials, provide the procedures, and discuss with the students the “correct” results and the “correct” conclusion ( Bonnstetter, 1998 ).
By contrast, DBL provides a reason for learning the science content by engaging the student in design and using a natural and meaningful venue for learning both science and design skills. The collaborative nature of design provides opportunities for teamwork ( Kolodner, 2002 ).
DBL enables students to experience the construction of cognitive concepts as a result of designing and making individual, inventive, and creative projects, to initiate the learning process in accordance to their own preference, learning styles, and various skills. It also assists the teacher in creating a community of designers who are partners in teamwork ( Barak & Maymon, 1998 ; Doppelt, 2005 ; Resnick & Ocko, 1991 ). In this way, students combine “hands-on” activities with what Papert (1980) has termed “heads-in” activities. When students create projects, they experience meaningful study that enables the exercising of sophisticated ideas that arise from their own projects ( Doppelt & Barak, 2002 ).
In addition to providing students with a rich understanding of design and technology, DBL can have several other advantages. First, since good design involves meeting current and real needs, students are motivated to learn because of the more obvious application of their knowledge to real life situations ( Doppelt, 2003 ; Hill & Smith, 1998 ).
Second, DBL is an active process and has all of the advantages of active learning. Active learning is an educational approach that puts the students at the center of the learning process and recognizes the variation among different learning styles ( Dewey, 1916 ; Gardner, 1993 ; Kolb, 1985 ; Perkins, 1992 ; Sternberg, 1998 ). Active learning changes the teacher’s role from that of lecturer to the roles of tutor, guide, and partner in the learning process ( Prince, 2004 ). The knowledge gained through active learning is constructive knowledge and is not the type of knowledge that results from memorizing and doing exercises or homework from books ( Gardner, 1991 ).
Third, DBL is typically a team activity, and thus has the advantages of collaborative learning. Students who have learned through cooperative methods gain success in academic and non-academic achievements ( Lazarowitz, Hertz-Lazarowitz & Baird, 1994 , Verner & Hershko, 2003 ). Working in teams generates a greater number and variety of ideas than by working in isolation ( Denton 1994 ). A learning environment that allows teamwork can help students develop their interpersonal communication skills, presentation skills, and problem solving skills ( Butcher, Stefanai & Tariq, 1995 ; Doppelt, 2004 ; 2006 ).
At the same time, DBL may present new difficulties for student learning, especially in the low-performing situations in K-12 science education. Many US teachers have weak preparation in science, but it is even weaker in design ( Ritz & Reed, 2005 ). DBL may motivate students, but the open-ended nature of design may leave low-achievers behind. This is certainly the case when teachers attempt large design projects only with gifted and talented classes. The task of navigating science content, the design process, and teamwork skills may be too much of a cognitive load for low-achieving students.
The design process is parallel to solving problems and has a general structure which typically includes stages such as: defining the problem and identifying the need, collecting information, introducing alternative solutions, choosing the optimal solution, designing and constructing a prototype, and evaluation. However, the design process has been criticized by researchers who have claimed that it is difficult for pupils and even for teachers to learn how to use ( McCormick & Murphy, 1994 ). In order to avoid teaching a general design process that can become rigid, it has been argued it is essential that teachers assist pupils in integrating knowledge from science and other disciplines into their design thinking ( de Vries, 1996 ). It is not essential or even advisable that pupils construct their ideas, solutions and products following a specific set of design process steps. What is essential is to teach them to document properly and to learn to reflect on their creation ( Sanders, 2000 ; Doppelt, 2007 ).
This paper explores these issues in a case study of an urban, public, middle school in a slightly below-moderate income neighborhood. We examined two middle school science classes taught by a teacher who switched for the first time from a standard, scripted inquiry approach to a design-based learning approach. The researchers were particularly interested in two questions. First, will students previously labeled high and low-achievers become equally engaged by DBL? Second, will the traditional gaps in science achievement associated with race/ethnicity, gender, and socio-economic status be increased or reduced? Work outside the U.S. suggests positive results are possible ( Barak & Doppelt, 1999 , 2000 ; Barak, Eisenberg, & Harel, 1995 ; Barlex, 1994 ; Prince, 2004 ). But the lack of history with DBL in the US may produce different results, as may the socio-cognitive realities of U.S. urban education.
Methods
Prior District Context
In this research, we initiated an in-depth case study of enhancing science education through design-based learning. Prior to this study, the researchers (the three first authors) identified a gap between the state and local science standards and the learning environment that was being used in this district. The gap between the standards and the implementation of the existing learning environment was particularly lacking in the design process. The specific standards that were being neglected were: (1) Know and use the technological design process to solve a problem, and (2) Explain the parts of a simple system and their relationship to each other.
The researchers initiated several interactions with personnel in the district instructional division. Through discussions with the coordinator and the district instructional support tutors, the group agreed that a design-based model might benefit the instruction that was occurring in eighth grade science classes, particularly in the half-year module involving the teaching of concepts around electricity and electronics. The prior instruction that was used in this electronics module emphasized a scripted-inquiry approach (i.e., students were told exactly how to conduct each inquiry activity via step-by-step procedures and worksheets).
The Design Curriculum
In order to include technological design and systems thinking, we developed a new learning module, a process of teacher training, and a plan for implementation in the regular science curriculum. The resulting module, Electrical Alarm System: Design, Construction, and Reflection ( Doppelt, Mehalik & Schunn, 2004 ), was organized according to a variation of a creative thinking framework ( De Bono, 1986 ) applied to design. The framework’s components are: P urpose, I nput, S olutions, C hoice, O perations, and E valuation ( PISCOE ).
The module included modes of design thinking such as needs, requirements, generating solutions, and making decisions, thus following a process similar to the way that engineers design new systems. No concepts were explained declaratively until there was a need among students to do so, and only after a period in which students themselves attempted to investigate/discover the concept. Students and teachers followed a systems design approach ( Gibson 1968 ; Blanchard & Fabrycky 1998 ) throughout the course of the 4 –5 week implementation.
The students learn about: (1) Alarm systems - where they can be found, reasons such systems exist, how they work, and how to build such a system; (2) Technological systems and subsystems, along with the purposes of such systems; (3) Constructing an alarm system in order to learn how electronic components can applied in developing such a system; (4) Brainstorming, communicating, documenting, working in teams, and designing technological systems for solving problems; 5) Developing criteria for assessing the design process; 6) Evaluating alternative designs as problem solutions; and 7) Reflecting on the design process.
Participants
In this study, we closely examined the implementation of the module with thirty-eight students in two science classes. Each class meets for one hour, five days per week. The students were in the eighth grade (thirteen to fourteen years old) in a middle public school in an urban district. The teacher has a masters’ degree and thirty years of experience in teaching science at the elementary and middle school levels.
One class was considered by the school to be a low-level class. The other class was considered to be a high-level class (see Table 1). The school assigns students to the classrooms based on previous students’ overall achievements in a variety of subjects (e.g., science, math, English, etc.) in the prior school year.
|
Low Achievers Class
( n = 22) |
High Achievers Class
( n = 16) |
|
|---|---|---|
| % Minority | 41 | 25 |
| % Male | 55 | 38 |
| % Low SES | 50 | 50 |
Based on many years of prior experience with such students in general and two prior grade reporting periods of experience with these particular students, the instructor was expecting the lower achieving class to perform less well in the science class.
The number of students receiving free or reduced price lunches was used to determine the Socio-Economic Status (SES) reported in Table 1. A number of variables are used to determine eligibility for these lunches and include income, welfare payments, family size, and number of children in school. This variable as an indicator of SES is typically a strong predictor of student performance in science in the US.
Data Collection and Analysis
To develop an in-depth understanding of student engagement and achievement in this setting, we analyzed three sources of data:
1. Knowledge Test (KT)
The researchers specifically created a seven-question multiple-choice knowledge test that was designed around core concepts in electricity, such as resistance, current, voltage, and series and parallel circuits. This was done in order to ensure that all the core concepts that have been previously taught by the district would be included in the knowledge test ( Mehalik, Doppelt, & Schunn, 2008 ). Students were given a pre-test and a posttest to measure changes in their knowledge of electricity concepts. There were two versions, randomly assigned to each student. The pre-test was administrated before any instruction in electricity began. The post-test was administrated immediately after the last day of the five-week module.
2. Oral Presentation Assessment
After the teams had completed each section of the learning module, transparencies were used to present their progress to the class. At the final stage of the learning module each team was required to present the entire design and build process. A teacher assessment and peer-assessment were done for each of these team presentations. Both teachers and peers used the same four criteria to assess each team presentation: knowledge of information, explanation of each item, use of the alarm system model, and use of transparencies. The teacher and each student scored the performance of each of team presentations on a scale of 5 (advanced) to 1 (unsatisfactory).
3. Analysis of student portfolios
All thirty-eight student portfolios and team documentation consisting of twelve sets of presentation transparencies were collected. Data from two teams were randomly selected for detailed analysis from those teams that performed at average levels on the knowledge tests. In addition, the researchers performed observations of 64% of the class activities within the module. Two researchers observed the same class periods and kept simultaneous but independent observation logs of students. These data provided additional support to the other observations.
Results and Interpretations
The results are divided as follows. In the first section the researchers analyze and compare high and low level students based on the results from the pre- and post- knowledge tests. In the second section, the overall performance of students relative to gender, ethnicity, and SES is reported. In the third section, the researchers describe the team documentation portfolios of two teams, one drawn from the high level students and one from the low level students. This was done in order to provide a detailed qualitative perspective of their performance in the DBL environment.
Achievement
Figure 1 presents the results from the knowledge tests. The standard error bars show a significant difference ( p < .05) when they are not overlapping ( Cumming & Finch, 2005 ). These findings indicate that DBL may be promising in reducing traditional achievement gaps, especially between the minority and the non-minority students and/or between the lower and higher SES.
Figure 2 shows a comparison of knowledge test scores between the low-achievers and high-achievers. The high-achievers gained significantly in the post-test ( t = 2.24, p < 0.05) while the low-achievers improved but their improvement was not significant ( t = 1.49, p = 0.14). Related research found that reading performance explains in part the lower performance on pen and paper tests such as this ( Silk, Schunn & Strand Cary, 2007 ). Because the students were broadly grouped into classes by prior academic performance, reading performance differences may explain this result.
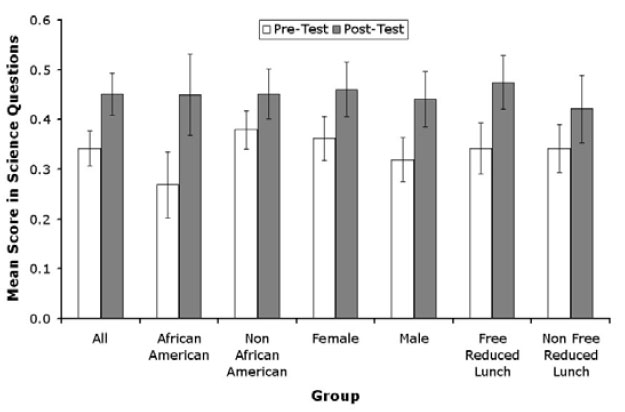
Figure 1. Mean Knowledge Test performance (with Standard Error bars) broken down by gender, race/ethnicity, and SES
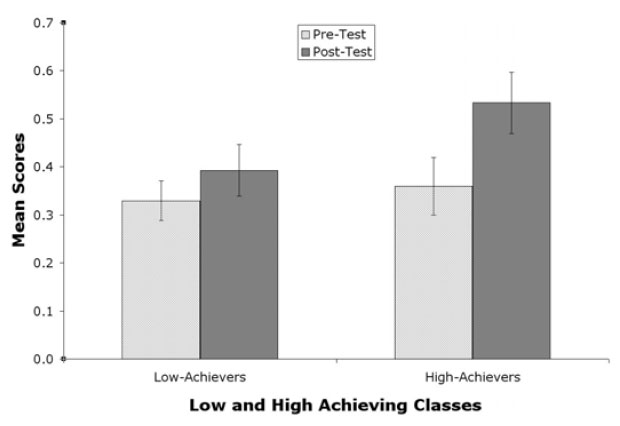
Figure 2. Knowledge test performance (Mean scores with SE bars) – Low/high achievers
Figures 3a and 3b present the results from the peer and teacher assessment that was done in both classes. The low-achievers scored their peer’s presentations significantly higher than did the high-achievers. Of course, it may simply be that the students in the low-achieving class were more lenient. However, the teacher's ratings largely mirrored the student ratings. Furthermore, comparing peer-assessment and the teacher’s assessment with the researchers’ observation notes, the low-achievers generally presented their alarm solutions with a higher level of performance. The only exception to these findings was the criterion “Use of alarm system model.” According to the teacher’s assessment, the high-achievers used the alarm system model slightly better than did the low-achievers. Thus, we have some evidence that the knowledge test did not present a fully accurate picture of the differences across the classrooms.
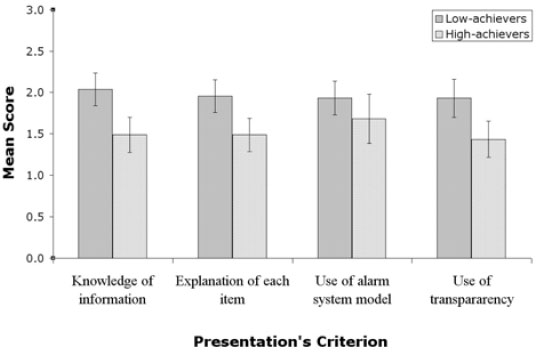
Figure 3a. Peer Presentation Assessment (Mean scores with SE bars)
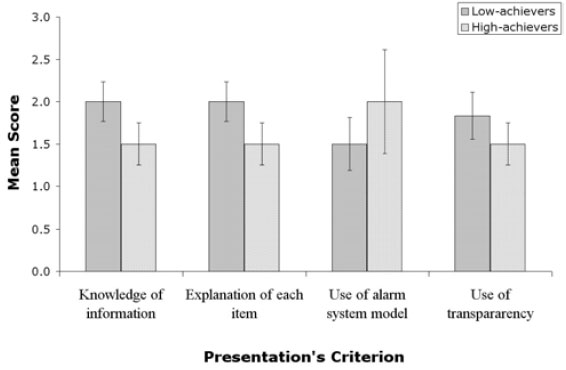
Figure 3b. Teacher Presentation Assessment (Mean scores with SE bars)
Portfolio Assessment
The portfolios were assessed to delve deeper into how the students went about designing their solutions. One portfolio was selected to represent the high-achievers and a second was chosen to represent the low achievers. These two portfolios will be available online shortly after this issue is published at http://scholar.lib.vt.edu/ejournals/JTE/ . The representative portfolios were selected based on the knowledge test and on the observation logs of the researchers. The detailed portfolios show how each type of student engaged approached the different phases of the design process from beginning to end.
The “ Oh-snap, someone stole my stuff alarm” (“Oh-snap”) is the name of the alarm system that a team of four boys chose to work on. The second example tells the story of a team of three girls who chose to work on “ Medicine alarm ” (“Medicine”). According to the pre-test scores the students from the “Medicine” team were slightly above the mean scores of their high-achieving group. The students from the “Oh-snap” team were slightly below the mean score of their low-achieving group. The process steps in which the students were engaged included:
Step 1: Generate and document needs.
An important stage of design thinking is to realize that designs must meet needs. This introductory step engaged students in generating several different needs in their environment (see Figure 4, available online). For each need, they generated different possible solutions. A central idea in this activity was to engage all students in the activity. In most cases all the students in a team contributed ideas to the team transparencies. Another contribution was to add alternative solutions to ideas that other members in the team had raised.
Step 2: Develop a requirements list for the designed artifact
An important step in designing a new solution is to define requirements in order that the solution will meet the need (see Figure 5, available online).
Step 3: Develop an Input/Output model for the designed artifact
In this step, the teams described their alarm problem using a systems model, and then specified the information, energy, and material inputs, along with the positive and negative outcomes (see Figure 6, available online). Creating a systems model engages students in considering the impact of their alarm system on the environment. In addition, understanding input-output relations may assist students in understanding the structure of the system from a broader perspective.
Step 4: Develop function list for the designed artifact
In this step, students defined the functions that the system needed to have in order to meet the specified requirements (see Figure 7, available online).
Step 5: Develop system/subsystem analysis for the designed artifact
From the functions list, the teams created a visual sub-systems model (see Figure 8, available online).
Step 6: Develop decision matrix for selection among alternative design solutions
In this stage, the teams chose a solution for further design refinement and construction (see Figure 9, available online). The list of requirements previously generated served as criteria in the selection of the optimal solution.
Step 7: Continuous documentation through sketching.
Sketches showed how they thought about their design, beyond the electronics elements (see Figures 10-12, available online).
Step 8: Continuous documentation through reflection tables.
Reflection tables are an important stage during the design process. Requiring students to reflect about what they are doing as the design developed assisted them in connecting the work that they had done to this point and effectively plan the next stage (see Figures 13 & 14, available online). The reflection tables also revealed how scientific concepts were applied in the design process. For example, most of the groups in this class (and in other classes) used a parallel circuit before trying a series circuit. They called it “full connection.” Using reflection, they succeeded in creating sophisticated alarms circuits.
Teachers in the professional development workshop for the project had difficulty in understanding how these circuits worked and sought help from the researchers and their peers in how to teach their students. They learned that much of the difficulty of understanding the circuits came from the fact that series circuits were typically taught before parallel circuits in science class. Reversing the order seemed to increase understanding.
Both selected portfolio teams thought of an electrical resistor as an instrument to fine-tune the sound of the buzzer. The researchers noted that most science teachers with whom they have worked in professional development workshops did not understand this. This led the researchers to conclude that the students had developed a rather sophisticated understanding of the role of a resistor in a circuit – one that most adults do not have.
Step 9: Final process reflection
In this stage, teams were required to reflect on the entire design process. Using their previous documents and circuits, they reviewed their own creation process again and prepared themselves to present their complete design process in front of the class. The final team reflection on the design process was organized according to the six non-linear stages of PISCOE (see Figure 15, available online).
Table 2 compares the primary differences in documentation for each step of the design process between the two teams. These data provide an overall perspective of the portfolios of the low achieving class team to the high achieving class team.
| Design stage | Actual steps | Oh-snap (low achieving group) | Medicine (high achieving group) |
|---|---|---|---|
| Purpose |
Step 1:
Needs |
All the ideas were original | Two ideas were the same |
|
Step 2:
Requirements |
Eleven requirements, the only group that thought of a testing sub-system | Ten requirements | |
|
Step 3:
System Model |
Identified clearly the negative outcome | Did not identify clearly the negative outcome | |
| Input |
Step 4:
Functions |
Five functions | Four functions Two functions were very general and not unique to the specific alarm that they designed. |
|
Step 5:
Sub-Systems |
Identified sub-systems | Identified very well the nature of each of their sub-systems | |
|
Choose
Solution |
Step 6: Matrix | Evaluate their alternatives based on the “Must have requirements” | Evaluate their alternatives based on all requirements |
|
Step 7:
Sketching |
Few sketching mostly of circuits | Lot of sketching dealing with variety of aspects of their “medicine” alarm | |
| Operations |
Step 8:
Reflection |
Seven different reflection tables | Only two tables |
| Evaluation |
Step 9:
Final reflection |
Had some thing to reflect upon in each stage | Almost two columns with out any reflection |
In comparing the two portfolios, the following observations can be made:
- The low-achiever team showed more generative thinking for five steps (steps 1, 2, 4, 8, 9)
- The low-achiever team showed better ideas for four steps (steps 2, 3, 4, 6)
- The high-achiever team showed more generative thinking for one step (step 7)
- The high-achiever team showed better ideas for one step (step 5)
In other words, there is a general pattern (with the exception of sketch generation) in that the low group shows more generative thinking overall and better ideas in the portfolio despite lower overall scores on the pen and paper knowledge test. The minor exception might be explained by our observation that the “Medicine alarm” team liked very much to draw and sketch along the whole design process, while the low-achiever team seemed significantly less interested in doing so. Both groups were so captivated by their idea that during the presentation session they often needed to be told to pay attention to other students who were presenting, because they kept working right up to the time their group member was to present.
Thus, a hands-on, design-based learning module works well from both the students’ and teacher’s perspective. Overall, students demonstrated an advanced stage of documentation. Scaffolding for documentation was appropriate and encouraged behavior and boosted skills in documenting ideas and work. Students developed significant skills in presenting their work. A majority of students were able to do a lot of idea generative thinking.
At the end of the unit, the teacher stated that the class that was perceived to be low-achieving actually learned more and were more engaged than the students in the class perceived to be high achieving. Specifically, the level of engagement, the level of team performance, and the thoroughness of student documentation were higher in the low-achieving class.
As further support of this teacher perspective, both researchers’ observation logs showed high level of engagement in the low achieving class. When this observation was mentioned to the teacher, he agreed that students who previously had problems paying attention in class and remaining engaged were attentive and fully engaged during the implementation of the alarm design module.
Summary
In this study, students were asked to build engineering prototypes, typically working in teams to solve real design problems, following an authentic, reflective engineering design process. The findings presented two aspects of learning: engagement and achievement. Engagement has the potential to highlight students’ performance in a way that standardized assessment methods do not reveal.
Achievements
According to the results of the knowledge tests, a wide range of students improved their understanding of electricity concepts. Specifically, these results revealed that African-American and free/reduced lunch students gained significantly more than the others. Similarly, we observed high achievement among African-American and free/reduced lunch students during the lessons. The improvement of these two groups of students suggests that design-based learning assisted all students and reduced the often-cited achievement gap. These findings strengthen previous research regarding the advantages of DBL to understanding scientific concepts ( Kolodner, 2002 , Rivet & Krajcik, 2004 ).
Although the results from the knowledge test do not show a significant improvement of low-achievers compared to high-achievers, the other research tools suggest that low-achievers achieved the same level of knowledge as the high-achievers. From the peer and teachers assessment, we found that low achievers presentations were scored significantly higher than the presentations of the high-achievers scored.
It seems that standardized tests, such as the knowledge test used in this study, should not serve as the only tool to assess students’ achievement. The observations and the portfolios showed that the low-achievers reached similar levels of understanding scientific concepts despite doing poorly on the pen and paper test. For example, the “Oh-snap” team (from the low-achieving class) said during the presentation of their alarm system: “We succeeded in building a model for our alarm system to a certain extent.” This statement suggested that the students may have realized that the actual alarm system they have constructed satisfied the design process they documented. In the workshops and in other classes, the researchers have noticed that high achievers are used to waiting for the teacher’s instructions such as what to do next, how to do it, which components to use, and so forth. When the “freedom to learn” is given to low achievers, they might adjust their learning process and could be more creative. The learner-centered module that was implemented in this study might thus assist them to reach higher levels of achievement. The assessment should capture their creative outcomes and should be sensitive to these achievements.
Engagement
The results from the observation of class activities and the analysis of the performance of low-achievers versus high-achievers strengthens past research regarding the advantages that project-based learning has ( Barak, Waks & Doppelt, 2000 ; Doppelt, 2003 ). Project-based learning in a rich science technology learning environment requires investigating new approaches for the evaluation of the learning process ( Dori & Tal, 2000 ). Students who study using an authentic problem, integrate science, technology, and other aspects, reach a level of thinking that requires a reevaluation of traditional curricula ( Barton, 1998 ) and assessment.
Our discoveries reported herein, and repeated in other schools, about the advantages of letting students construct circuits without formally teaching them about parallel or series circuits need further research. It is worth noting that one recent study found that only 51% of students who complete an introductory university physics course understood the concepts of series circuits and only 18% understood the concepts of parallel circuits ( Aalst, 2000 ). According to our findings, students better understood parallel circuits when they intuitively constructed their circuit without preliminary instruction about them. Furthermore, they did not understand less about the series circuit. It seems that teaching series circuits first as is commonly done in most science curricula is in contradiction with students’ prior knowledge and natural thinking. Using students’ pre-knowledge and free exploration in order to teach them scientific concepts may have the advantage of engaging more students in the learning process and advancing their achievements. These findings suggest that further research is needed, aimed at exploring what is the best method to teach electrical circuits.
Design-based learning environment
Combining quantitative and qualitative tools in the same study can assist researchers to gain broader perspective on the learning environment ( Fraser, 1998 ; Fraser & Tobin, 1991 ). The findings from this study suggests that DBL has the potential to increase students’ desire to learn, enhance students’ success in science class, and increase students’ interest in science topics. Indeed, we observed students to be quite engaged in DBL, and the low-achievers explained scientific concepts at a level that their teacher had never observed them accomplish before. In addition, students gained in-depth experience in design activities and created meaningful technological outcomes, both from the product perspective and from the documentation and reflection perspective. Thus, design-based science has the potential to advance students’ understanding of science ( Fortus, et al., 2004 ).
This paper presents part of a larger study in which the electrical alarm systems module was implemented. Through intensive observations in the classrooms and discussions with teachers, it served as an initial stage for the researchers to study the impact of the developed module on engagement and achievement. The learning module and the research tools were improved and implemented in the second year. Thus, applying a new curriculum in a collaboration of researchers and teachers could have contributed to the success found here ( Doppelt, Mehalik & Schunn, 2005 ; Zohar & Dori, 2003 ).
Acknowledgments
This research was supported by a grant from the NSF (EHR-0227016).The researchers thank Mr. Richard P. Mathews for his continuous support in this study.
References
Aalst V.J. (2000). An Introduction to Physics Education Research. Canadian Journal of Physics, 78 , 57-71.
Barak, M., & Doppelt, Y. (1999). Integrating the Cognitive Research Trust (CoRT) program for creative thinking into a project-based technology curriculum. Research in Science & Technological Education, 17 (2), 139–151.
Barak, M., & Doppelt, Y. (2000). Using portfolios to enhance creative thinking. Journal of Technology Studies, 26 (2), 16–24.
Barak, M., Eisenberg, E. & Harel O. (1995). “What’s in the calculator?” An introductory project for technology studies, Research in Science & Technological Education. 12 (2), 147-154.
Barak, M., & Maymon, T. (1998). Aspects of teamwork observed in a technological task in junior high schools. Journal of Technology Education, 9 (2), 3-17.
Barak, M., Waks, S. & Doppelt, Y. (2000). Majoring in technology studies at high school and fostering learning. Learning Environment Research, 3 (2), 135-158.
Barlex, D. (2005, April). The centrality of designing – an emerging realisation from three curriculum projects, In de Vries J. M. & Mottier I. (Eds.) International hand book of technology education: Reviewing the past twenty years, (pp. 253-260). Rotterdam, the Netherlands: Sense Publishers.
Barton, A. C. (1998). Examining the social and scientific roles of invention in science education, Research in Science Education. 28 (1), 133-151.
Blanchard, B. & Fabrycky, W. B. (1998). Systems Engineering and Analysis. Prentice Hall.
Bonnstetter, J. R. (1998). Inquiry: Learning from the past with an eye on the future". Electronic Journal of Science Education, 3 (1). Retrieved May 23, 2007, from http://unr.edu/homepage/jcannon/ejse/bonnstetter.html
Bransford, D. J., Brown, L. A., & Cocking, R. R. (1999). How people learn: Brain, mind, experience, and school. Washington, DC: Committee on Developments in the Science of Learning, National Research Council, National Academy Press.
Butcher, A.C. Stefanai L. A. J. & Tariq V. N., (1995). Analysis of peer-, self-, and staff-assessment in group project work. Assessment in Education, 2 (2), 165-185.
Cumming, G., & Finch, S. (2005). Inference by eye: Confidence intervals and how to read pictures of data. American Psychologist, 60 (2), 170-180.
De Bono, E. (1986). Co.R.T Thinking Program (2 nd ) Ed . Oxford: Permannon Press.
De Vries, M. J. (1996). Technology education: Beyond the “technology is applied science” paradigm. Journal of Technology Education, 8 (1), 7–15.
De Vries, M. J. (1997). Science, technology and society: A methodological perspective. International Journal of Technology and Design Education, 7 , 21–32.
Denton, H. (1994). The role of group/team work in design and technology: Some possibilities and problems. In: Banks F. (Ed.), Teaching Technology (pp. 145-151). Routledge, London.
Dewey, J. (1916). Democracy and education. The Free Press, New York.
Doppelt, Y. (2003). Implementing and assessing project-based learning in a flexible environment. The International Journal of Technology and Design Education, 13 (3), 255–272.
Doppelt, Y. (2004). Impact of science-technology learning environment characteristics on learning outcomes: Pupils' perceptions and gender differences. Learning Environments Research, 7 (3), 271–293.
Doppelt, Y. (2005). Assessment of project-based learning in a Mechatronics’ context. Journal of Technology Education, 16 (1), 7–24.
Doppelt, Y. (2006). Teachers’ and pupils’ perceptions of science–technology learning environments, Learning Environment Research, 9 (2), 163-178.
Doppelt, Y. (2007, On-line first). Assessing creative thinking in design-based learning. International Journal of Technology and Design Education.
Doppelt, Y., & Barak, M. (2002). Pupils identify key aspects and outcomes of a technological learning environment. Journal of Technology Studies, 28 (1), 12–18.
Doppelt, Y., Mehalik, M. M. & Schunn, D. C. (2004). Electrical alarm system: design, construction, and reflection. Learning Research and Development Center, University of Pittsburgh , Pittsburgh, PA.
Doppelt, Y., Mehalik, M. M., & Schunn, D. C. (2005, April). A close-knit collaboration between researchers and teachers for developing and implementing a design-based science module. The annual meeting of the National Association for Research in Science Teaching (NARST) , Dallas, TX.
Dori, I. & Tal, R. (2000). Formal and informal collaborative projects: Engaging in industry with environmental awareness. Science Education, 84 , 95-113.
Dyer, R. R., Reed, A. P., & Berry, Q. R. (2006). Investigating the relationship between high school technology education and test scores for algebra 1 and geometry. Journal of Technology Education, 17 (2), 8–18.
Fortus, D., Dershimer, R.C., Marx, R.W., Krajcik, J., & Mamlok-Naaman, R. (2004). Design-based science (DBS) and student learning. Journal of Research in Science Teaching 41 (10), 1081–1110.
Fraser, B. J. (1998). Science learning environments: Assessment, effects, and determinates. In B. J. Fraser & K. G. Tobin (Eds.), International handbook of science education (pp. 527–564). Dordrecht, The Netherlands: Kluwer.
Fraser, B. J., & Tobin, K. (1991). Combining qualitative and quantitative methods in classroom environment research. In B. J. Fraser & H. J. Walberg (Eds.), Educational environments: Evaluation, antecedents, and consequences (pp. 271–290). Oxford, UK: Pergamon Press.
Gardner, H. (1991). The unschooled mind. New York: Basic Books.
Gardner, H. (1993). Multiple intelligences/the theory to practice. New York: Basic Books.
Gibson, E. J. (1968). Introduction to engineering design. New York: Holt, Rhinehart, and Winston.
Hill, A. M. & Smith, H. A. (1998). Practice meets theory in technology education: A case of authentic learning in the high school setting. Journal of Technology Education, 9 (2), 29-45.
Kolb, D. A. (1985). Learning Styles Inventory. Boston: McBer and Company.
Kolodner, J. L., Crismond, D., Gray, J., Holbrook, J., & Puntambekar, S. (1998). Learning by Design from theory to practice. Proceedings of the International Conference of the Learning Sciences (ICLS 98), (pp. 16-22). Charlottesville, VA: AACE.
Kolodner, L. J. (2002). Facilitating the learning of design practices: Lessons learned from inquiry into science education. Journal of Industrial Teacher Education, 39 (3).
Lazarowitz, R., Hertz-Lazarowitz, R., & Baird J. H. (1994). Learning in a cooperative setting: Academic achievement and affective outcomes. Journal of Research in Science Teaching, 31, 1121–1131.
McCormick, R. & Murphy, P. (1994). Learning the processes in technology. Paper presented to the Annual Conference of British Educational Research Association, Oxford University, England.
Mehalik, M. M., & Doppelt, Y., & Schunn, C. D. (2008). Middle-school science through design-based learning versus scripted inquiry: Better overall science concept learning and equity gap reduction. Journal of Engineering Education, 97 (1), 71-85.
National Research Council (1996). National Science Education Standards, National Academy Press, Box 285, 2101 Constitution Avenue, N.W., Washington, D.C. 20055
Papert, S. (1980). Mindstorms, children, computers and powerful ideas. Basic Books Inc., New York.
Penner, E. D. (2001). Complexity, emergence, and synthetic models in science education. In: K. Crowley, C. D. Schunn, & T. Okada (Eds.) Designing for Science, Mahwah, NJ: Lawrence Earlbaum Associates.
Perkins, N. D. (1992). Technology meets constructivism: Do they make a marriage? In T. M. Duffy & H. D. Jonassen (Eds.), Constructivism and technology of instruction: A conversation (pp. 45–55). Hillsdale, NJ: Lawrence Erlbaum Associates.
Prince, M. (2004). Does active learning work? A review of the research. Journal of. Engineering Education, 93 (3), 223-231
Ritz, J. & Reed, A. P. (2005, April). Technology education and the influences of research: A United States perspective, 1985-2005, In de Vries J. M. & Mottier I. (Eds.) International hand book of technology education: Reviewing the past twenty years, (pp. 113-124). Rotterdam, the Netherlands: Sense Publishers.
Resnick, M. & Ocko, S. (1991). LEGO/Logo: Learning through and about design, In: Harel I. & Papert S. (Eds.), Constructionism , (pp.141-150). New Jersey: Ablex Publishing Corporation Norwood.
Rivet, E. A. & Krajcik, S. J. (2004). Achieving standards in urban systematic reform: An example of a sixth grade project-based science curriculum. Journal of Research in Science Teaching, 41 (7), 669-692.
Sanders, M. E. (2000). Web-based portfolios for technology education: A personal case study. Journal of Technology Studies, 26 (1), 11-18.
Silk, E. M., Schunn, C. D., and Strand Cary, M. (2007). The impact of an engineering design curriculum on science reasoning in an urban setting. Proceedings of the National Association for Research in Science Teaching, New Orleans, LA, United States.
Sternberg, J. R. (1998). Teaching and assessing for successful intelligence. The School Administrator, 55 (1), 26–31.
Verner, M. I & Hershko , E. (2003). School graduation project in robot design: A case study of team learning experiences and outcomes. Journal of Technology Education, 14 (2), 40–55.
Waks, S. (1995). Curriculum design: From an art towards a science. Hamburg, Germany: Tempus Publications.
Wiggins, G. & McTighe, J. (1998). Understanding by design. Merrill Education/ASCD College Textbook Series, ACSD, Alexandria, Virginia.
Yager, R. E. (1996). Science/technology/society: As reform in science education. Albany, NY: State University of New York Press.
Zohar, A., & Dori, Y. J. (2003). Higher order thinking skills and low achieving students – are they mutually exclusive? Journal of the Learning Sciences, 12 , 145–182.
Yaron Doppelt ( yaron@pitt.edu ) is Lecturer, Sakhnin Academic College for Teacher Education, Israel. Christian D. Schunn ( schunn@pitt.edu ) is a Research Scientist in the Learning Research and Development Center and Associate Professor of Psychology , Matthew M. Mehalik ( mmehalik@pitt.edu ) is an Adjunct Faculty member in Freshman Programs in the School of Engineering , and Eli Silk ( esilk@pitt.edu ) is a graduate student, all at the University of Pittsburgh . Denis Krysinski ( dkrysinski1@pghboe.net ) is a teacher at Greenfield School in Pittsburgh.