JTE v21n2 - Characterization of a Unique Undergraduate Multidisciplinary STEM K-5 Teacher Preparation Program
Characterization of a Unique Undergraduate Multidisciplinary STEM K-5 Teacher Preparation Program
Steve O’Brien
Introduction
The K-5 school years are crucial, setting the framework for all subjects as well as critical thinking skills. The single most important component in a classroom is the teacher. However, in a formative timeframe for elementary-school aged children, the number of K-5 teachers that are educated with a Science, Technology, Engineering or Math specialization (“STEM”) is substantially underrepresented. A lack of STEM subject matter expertise and experiences, coupled with high anxiety and low self-efficacy can lead to low teacher effectiveness.
At The College of New Jersey (TCNJ) it was felt that the Department of Technological Studies was well positioned to provide a unique academic major by combining the T&E with the M&S components of STEM, resulting in a program breadth that matches the breadth of skills needed by a highly skilled K-5 teacher. Additionally, it was thought that the field of technology education (TE) should be substantially more involved at the K-5 level, an age range that historically has little presence in TE in the USA. Such a program was established at TCNJ and is formally referred to as the Math-Science-Technology or MST program.
Two key motivations for the program were to achieve a higher number of STEM-trained K-5 teachers and to bring valuable contextual experiences to future teachers, and subsequently their K-5 students, through substantial and relevant T&E content. If these goals are achievable, then the MST program could have important implications for K-5 teacher preparation, potentially having a long-term and beneficial impact on student outcomes in STEM, and non-STEM, subjects in grades K-5, and eventually 6-20 and beyond.
In 1998 The College of New Jersey (TCNJ) approved the MST multidisciplinary major for elementary education students. The program has substantial requirements in all STEM areas and takes a truly integrated-STEM approach. To the authors’ knowledge, this is the only undergraduate STEM major for K-5 teacher preparation in the USA that has substantial T&E as well as M&S components. Currently, there are about 150 MST majors in the program. All students in elementary, early childhood, special education, and deaf and hard of hearing education can elect the MST major as their required second major.
A concern with multidisciplinary programs is that their breadth adversely affects the depth of the content learned. The purpose of the research reported herein was to quantitatively investigate the depth of content knowledge in the MST program in both the STEM elements as well as key non-STEM subjects. The growth of the program was also investigated. This paper also discusses how co-existing MST and TE programs impact each other. Technology education departments are in a unique position to initiate similar programs since they have enabling capabilities in the both the technology and the engineering components of STEM, components that have critical hands-on, integrative, and contextual attributes.
There are many factors that constrain or eliminate the ability to generalize the results of this study to other programs and institutions. Among them are political and administrative climate, state and institutional requirements for the preparation of teachers, admission requirements, and program philosophy. Nonetheless, it is hoped that the article will inspire ideas in how to increase the learning experiences that young people have in school by properly preparing the teachers who will provide these experiences.
Program History
Following the adoption of the first New Jersey Department of Education (NJDOE) Core Content Standards in 1996, the Department of Technological Studies, under the leadership of Dr. John Karsnitz, was asked to convene chairs from the departments of elementary education, mathematics, biology, chemistry, physics and the coordinator of TCNJ’s “NJ Statewide Systemic Initiative to Improve Math, Science and Technology Education in K-12” (Dr. Robert Weber) to consider designing a new multidisciplinary major to fulfill a recognized need for more K-5 teachers with strengthened STEM skills. There was concern over the trade-off between disciplinary “depth” and interdisciplinary “breadth.” However, this concern was overcome by creating a major with a broad “core” and a required in-depth “specialization” in one of the three disciplines of mathematics, science (biology, chemistry or physics), or technology. The major was approved by TCNJ’s Board of Trustees in 1998 and subsequently by the NJDOE in 2000.
The MST major is one of several program offerings in the Department of Technological Studies in the School of Engineering. Other programs include a Technology/Pre-engineering education major and a Masters in the Art of Teaching (MAT). All majors are fully accredited by the National Council for Accreditation of Teacher Education (NCATE). All advising, recruiting, and requirements for the MST program are coordinated by the Department while all education requirements are coordinated by the School of Education.
There are four works that set important context to TCNJ’s Department of Technology Studies curriculum and the design of the MST program: (1) Benchmarks for Science Literacy (“Project 2061”) ( American Association for the Advancement of Science, 1993 ), (2) Technological Literacy Counts ( Sechrist, Anagnostopoulos, Lewis, and Coburn, 1998 ), (3) Standards for Technological Literacy ( International Technology Education Association [ITEA], 2000 ), and (4) Technically Speaking: Why All Americans Need to Know More about Technology (National Academy of Engineering, 2002). These documents discuss the important role of teacher preparation in meeting educational goals in math, science, and technology. In Technology Literacy Counts, ( Sechrist et al, 1998 , p. 3) representatives from Schools of Education and Engineering gathered to dialogue on how these two diverse groups could work together to effect change. One of the recommendations was to plan a meeting of Deans with the purpose of “ … open[ing] up channels of communication and promote teacher training that better prepares educators to teach technology and foster technological literacy.” The MST program was designed to do this with the recognized importance of math, science, and technological literacy in K-5.
The T&E components are a unique and potentially very beneficial aspect of the MST program because they include skills such as problem-solving, design and modeling, and making. As discussed in previous articles ( Brophy, Klein, Portsmore, & Rogers, 2008 ; Lachapelle & Cunningham, 2007 ; Zubrowski, 2002 ), the T- and E-components can be key in connecting math and science skills to the real world of the student, providing valuable contexts and increasing learning effectiveness. T&E components can effectively answer the common student complaint, “I’ll never need to know this. Of what good is this?” Design skills are also important for highly talented teachers since they constantly design lesson plans, design (manage) their time, and design curricula. T&E activities are also effective in helping students learn non-STEM subjects ( Koch & Feingold, 2006 ).
The STL (Standards for Technological Literacy, ITEA, 2000 ) states that technological literacy is critically important for the general population, not just for STEM-oriented persons. A STEM teacher preparation program is consistent with this philosophy, bringing STEM skills to an important group—teachers of impressionable K-5(8) students ( Michaels, Shouse, and Schweingruber, 2008 ). The focus was to establish a pre-service program, providing a systemic solution to the K-5 “STEM-teacher void.” Teachers, after all, are the largest single influence on a student’s education ( Carey, K., 2004 ; National Commission on Teaching & America’s Future, 2000 ; The Teaching Commission, 2004 ).
Program Description
All MST majors have the same core requirements but every student must also complete a specialization. Through an analysis of the specializations chosen over a four-year period (2009-2012), totaling 125 students, it was found that the technology and math specializations were chosen most often, each comprising about 35% of the total. Science specializations were chosen by about 16% of the students, while 12% were undecided. Past experience indicates that the majority of the undecided will choose a technology specialization. Prior to the MST program, the only STEM majors chosen by K-5 students were mathematics and biology.
The MST major is a 32 unit (128 credits) baccalaureate degree with requirements generally divided into three areas: Liberal Studies, MST Core Studies, and Professional Studies.
Liberal Studies [10 units]
TCNJ has extensive liberal learning requirements that include history, arts & humanities, global studies, gender, race & ethnicity, community-engagement, a freshmen seminar experience, mid- and senior-writing experiences, as well as requirements in science and quantitative reasoning. Calculus-I and Creative Design are required of all MST majors.
MST Core [12 units]
The MST academic core consists of 8 units including Multimedia Design, Structures and Mechanisms, two additional science options, one additional math, two MST electives (fulfilled by taking M, S or T), and a course titled “Integrated MST for Young Learners.” The final four units are reserved for specialization courses.
Professional Courses [10 units]
MST education majors at TCNJ meet the New Jersey State Certification requirements for a K-5 “highly qualified teacher.” Courses include several literacy/literature courses, psychology, math and science methods and a series of student teaching experiences.
In New Jersey, MST majors can also obtain middle-school endorsements in math or science, with both often being completed. A middle school endorsement has two requirements: completing 15 credits of appropriate course work in the discipline and passing the appropriate content knowledge Praxis TM test. A K-12 certification in Technology Education is also possible for an MST major by possessing at least 30 specified credits in technology and passing the Praxis TM technology education test.
The MST program was designed to be structurally consistent with the TE program. TCNJ’s TE program has its roots in industrial education, dating back to the 1930’s. A major revision of the TE major was completed in 1985 with an emphasis on studying the human-designed world. The program was revised again in 2005 with a “pre-engineering” emphasis, integrating more math and science ( Sullivan, Karsnitz, O’Brien, 2007 ). Some of the curricular aspects of the modified TE program are represented in a recent high school level textbook ( Karsnitz, O’Brien, and Hutchinson, 2009 ).
Program Growth and Gender
The MST program has experienced substantial growth. The MST program grew from 2 to over 25 graduates from 2002 to 2009. Current class sizes predict graduating class sizes in excess of 40 in the next few years. A high growth rate is a sign of a healthy program but also produces more STEM-trained teachers, an important and under-represented population for K-5 ( National Research Council, 2007 ). Previous to the MST program, non-STEM majors (Psychology, English, History … etc.) made up approximately 90% of the total, leaving historically 5- 13% for the STEM majors of mathematics and biology.
The growth of the MST program, measured as a percentage of the total K-5 graduates, is shown in Figure 1. Also included in Figure 1 are the percentages for the other two STEM majors of math and biology. For the most recent 4 years, math and biology graduates have comprised approximately 6% and 2% of the total, respectively. From 2004 to 2009 the MST program grew from 5% to 20%. Current class sizes predict that the MST major will grow to about 30% in the next few years, resulting in a total STEM percentage of about 38% after adding in the historic numbers for math and biology majors.
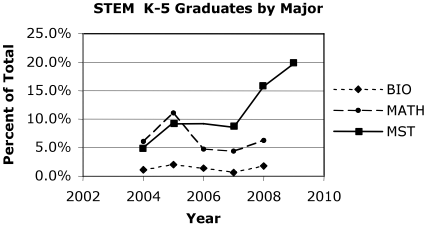
Figure 1. The number of MST, math and biology K-5 program graduates by year as a percentage of the total number of K-5 graduates.
This level of STEM-trained K-5 teachers is 4-to-5 times higher than the previous average of about 8% at TCNJ. A comparison of TCNJ’s level of STEM-trained teachers to a National average would be interesting but the author could not find these data. Some states do not require a second major and in states that do the type of majors chosen is not tracked.
An interesting gender effect was discovered in the analysis. For non-MST K-5 majors the fraction that are male has been about 6% (see Figure 2). The number of male math and science graduates over the last five years has averaged 4%. The national average of male K-5 teachers in 2001 was about 9%, down from about 18% in 1981 ( Scelfo, 2007 ; National Education Association, 2003 p.91). In contrast, the fraction of male MST graduates has been a consistent 20-25%, a 4-to-6 times increase over the TCNJ averages and almost three-fold higher than the 2001 national average. Investigations into the reasons for the higher male fraction have not been undertaken. However, it may be that males are attracted to the T&E components, a dominant effect in engineering schools across the USA.
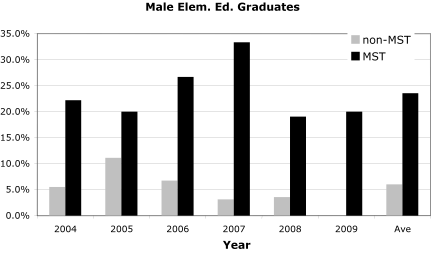
Figure 2. Comparison of male MST and non-MST program graduates.
Competencies in STEM and Non-STEM Components
In this section a description of competencies in science, mathematics, and technology/engineering are presented, as are the two non-STEM subjects of language arts and social studies.
Math and Science
All K-5 teacher candidates in New Jersey are required to take the Elementary Education Content Knowledge test (test #0014), maintained and monitored by Educational Testing Service (ETS). ETS published a national summary for 2008-09 ( Educational Testing Service, 2008 ) and a portion of the summary is reproduced in Table 1 under the column National Averages. Praxis TM scores were manually collected from TCNJ students starting in April-2002. The collection of these individual scores enables a more detailed statistical analysis than is possible by looking at the general statistical parameters provided by ETS.
Each category of TCNJ students performed well compared to the national averages. For example, the median Praxis TM score for TCNJ students was approximately 16% above the national average. (Note: the minimum possible score is 100.) Moreover, the middle 50% distribution of scores is substantially narrower for the TCNJ populations. For example, the 50%-width of the national distribution is 25 while the TCNJ distributions are 15 for the non-MST students and 13 for the MST students.
| Parameter | National Averages | TCNJ Non-MST | TCNJ MST |
|---|---|---|---|
| Possible Score Range | 100-200 | 100-200 | 100-200 |
| No. of Examinees | 92910 | 346 | 59 |
| Median Score | 164 | 179 | 181 |
| Range of Average Performers (middle 50%) | 151-176 | 169-184 | 174-187 |
The total populations for the TCNJ data were 346 non-MST majors and 59 MST majors. The MST population scored on the average of 180.3 on the Praxis TM with a standard deviation of 9.3 compared to the non-MST population that exhibited an average score of 176.3 with a 15% larger standard deviation of 11.0. A t-test was completed using Microsoft Excel and indicated that the difference between the MST and non-MST populations was significant at the 95% confidence level (p = 0.003).
Over the same timeframe, the subject-specific subscores in math, science, language arts, and social studies for the Praxis TM test (#0014) were also collected, enabling a detailed statistical analysis. The average test scores are shown in Table 2 for four subgroups: non-MST, MST, Math, and Science. Figure 3 shows a summary of the average Praxis TM subscore tests for MST graduates as a percentage, a percentage relative to the non-MST students.
| Math | Science | Lang. Arts | Soc. Studies | |||||
|---|---|---|---|---|---|---|---|---|
| Population | M | SD | M | SD | M | SD | M | SD |
| Non-MST | 25.5 | 3.2 | 21.9 | 3.2 | 25.9 | 2.4 | 19.1 | 3.0 |
| MST | 26.9 | 2.7 | 23.6 | 3.0 | 26.2 | 2.4 | 18.9 | 3.2 |
| Math | 28.3 | 1.0 | 23.0 | 3.5 | 27.2 | 1.8 | 19.8 | 3.9 |
| Sci. (Bio.) | 27.5 | 1.7 | 23.5 | 2.4 | 26.5 | 1.7 | 19.8 | 3.3 |
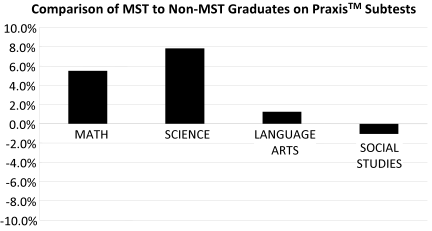
Figure 3. Relative percent comparison of subtest scores of MST graduates to
non-MST graduates on the Content Knowledge Praxis
TM
examination.
(i.e., the MST population scored 5.5% higher than the non-MST
population on the math subtest).
A t-test was conducted for both the math and science subscore distributions between the MST and non-MST populations reported in Figure 3. This analysis indicated that for a 95% confidence level the 5.5% and 7.8% differences for math ( p = 0.004) and science ( p = 0.001) were significantly different, whereas the language arts and social studies subscores were not. These data show that, compared to non-MST majors, MST graduates scored significantly higher in math and science competencies, while maintaining high competency on non-STEM subjects.
Other useful comparisons are scores in math and science amongst only the STEM majors (MST, biology and math). All of the STEM majors scored high on the math and science tests, within a few percent of each other. Perhaps as expected, the math majors scored highest on math but did not perform as well on science. The only STEM populations that had statistically significant differences were the MST and math major populations in the subject of math.
The average Grade Point Averages (GPAs) for MST and non-MST populations over the same time frame were 3.41 and 3.47 and the difference did not reach significance. These data indicate that MST and non-MST majors are generally performing identically in their college course work. The combined Scholastic Aptitude Test (SAT) scores for the MST and non-MST populations were 1250 and 1195, respectively. The difference in these scores is due primarily to higher scores on the math portion of the exam, which is not surprising due to the higher interest level in math and science for the MST population. Finally, scores on the math and science middle school Praxis TM exams for Spring-2009 also verified high competence for MST majors, with scores at or above the national median.
Technology & Engineering
The required coursework in the T- and E-components include technological literacy, skills in modeling and making, substantial emphasis on design processes, and science and math required for basic design. Key subject matter includes industrial, graphics and architectural design, creative design, human factors, structures, mechanisms, materials bio-technology and electrical technologies. The original MST-program proposal also included a course to reinforce the importance of integrated STEM teaching. This course is called “Integrated-STEM for Young Learners” and is required for all MST and TE majors (see for example Sanders, 2009 ). In the course MST majors acquire experience and comfort with T&E content related to young learners, enabling them to more easily, and more frequently, integrate activity, inquiry, and context into learning experiences. As stated in the Standards for Technological Literacy ( ITEA, 2000 , p. 7), “… the study of technology is a way to apply and integrate knowledge from many other subjects- not just mathematics, science, and computer science classes, but also the liberal and fine arts.”
Another potentially valuable aspect of the T&E courses is that significant time is spent on investigating how to effectively teach STEM and non-STEM, concepts through T&E-based activities. T&E professors are acutely aware that they are preparing future teachers, not engineers or scientists. This additional educational element is not part of teacher preparation programs in other subject areas. Though this element is similar to the familiar “methods” classes, that have beneficial effects ( Hiebert, Morris, Berk, & Janson, 2007 ), there are unique differences as well.
The fields of math and science have established methods to measure content knowledge (i.e., Praxis TM tests). However, no such assessment for K-5 T&E content knowledge exists. Simply having substantial T&E content in an undergraduate K-5 program is itself unique, but the question remains of how to assess competency at this level. In this paper it is proposed that since the MST program is using the same courses as the ongoing NCATE accredited Technology Education program, an analysis of the T&E courses taken by MST majors is sufficient to quantify T&E competence. Correspondingly it is believed that competencies in T&E can be characterized by looking at three items: a mapping of the T&E curricula onto the STL, an analysis of grades of MST majors compared head-to-head with TE majors in the same courses, and performance on the TE Praxis TM exam. Mapping the T&E curricula onto the STL quantifies the level of T&E exposure while an evaluation of grades indicates if T&E content is being learned. Lastly, MST student performance on the TE Praxis TM test gives an external measure of T&E content knowledge.
Mapping T&E content onto STL
TCNJ’s TE program produces 10-15 graduates per year and, in order to teach, they must pass the TE Praxis TM . Analyses of the institutional reports provided by ETS over the last four years indicate that TCNJ’s TE graduates score roughly 30-40 points above the median. Moreover, the width of the distribution of TCNJ TE graduates, as measured by the total range of scores, has been one-half to one-third that of the national average. Assuming that TCNJ’s framework of T&E courses is a major contributor to the Praxis TM scores as well as to the overall success of TE graduates in technology teaching positions, and that the Praxis TM scores represent a measure of T&E competence, then the level of exposure that MST majors to the T&E course work would be a good indicator of T&E competence. This level of T&E exposure depends on whether the MST student specializes in math, science, or technology. MST majors with a math or science specialization complete a minimum of five T&E courses (20 cr.). MST majors with a technology specialization complete approximately nine T&E courses (36 cr.). Common additional courses include Engineering Design, Analog Circuits & Devices, Digital Electronics, Environmental and Biotechnical Systems and Architectural & Civil Engineering Design and Facilities Design & Management. TE majors take approximately 16 T&E courses (about 64 cr.)
To summarize, math and science specialization MST graduates take about 32% of the T&E course load of a TE major, while technology specialization students take approximately 56%. This number of courses represents a high level of T&E content, especially considering that typical teacher preparation programs require no T&E content, no “integrated-STEM” educational content, and only minimal math or science. Statistics available on the U.S. Department of Education’s Institute of Education Sciences (IES) website for National Center for Education Statistics (NCES) shows that an education major graduate in 1992-93, the most recent year that data was available, completed an average number of 6.3, 10.4 and 0.3 semester credits in math, science and engineering, respectively. An MST major exceeds these figures with a minimum of 15-20 credits in math, 15-20 credits in science and 20 credits in T&E.
The content of the T&E course load is better defined by mapping it onto the STL. The STL consist of twenty standards organized into five categories. Benchmarks are given for each of the twenty standards for four age groups; K-2, 3-5, 6-8 and 9-12. There are 101 benchmarks for grades K-5 and another 85 benchmarks for grades 6-8. Keeping in mind that there are two MST populations with differing amounts of T&E content, Figure 4 shows the results of the mapping process for grades K-2, 3-5 and 6-8.
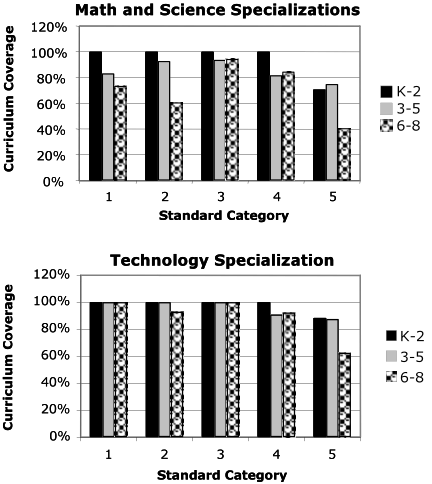
Figure 4. A mapping of TCNJ’s T&E curriculum onto Standards for Technological Literacy for the two specialization groups of (a) math or science and (b) technology.
This mapping indicates that, except for Standard category 5, the math and science specializations have 80-100% coverage for grades K-5, while the technology specialization has 90-100% coverage. The fifth category of the Standards includes benchmarks for seven very specific technologies and the narrowness of breadth of the MST program does not allow coverage of all of these technologies. In category 5, the MST program coverage is at the 60-70% level for math and science specializations, and above 80% for technology specializations.
Grades in T&E courses
In the previous section, it was shown that MST majors are exposed to most of the T&E content suggested by the STL. However, are MST students learning the T&E content? The analysis presented here shows that MST majors, compared head-to-head to TE students in the same T&E courses, achieve grades that are equal to or higher than TE students. In essence, the TE students serve as a standard of comparison and, given the history of good performance of the TE majors, this seems to be a valid comparison.
Figure 5 shows data from a 3-year period for four courses that include two required courses and two popular elective courses. These data represent grades for the 163 MST students enrolled in these courses. For individual assignments, MST students scored between 2% and 7% higher than TE students in these courses. Similar results were obtained for an upper level Architectural & Civil Engineering Design course that included intensive writing and human factors design assignments (see Figure 6). Investigations of several other courses, including the required courses of Creative Design and Integrated-MST for young learners yielded similar results.
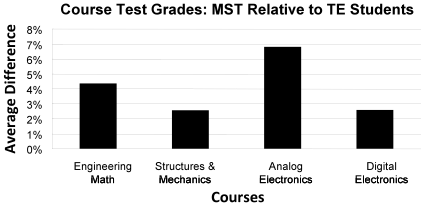
Figure 5. Grades of MST students relative to the TE students in four selected courses.
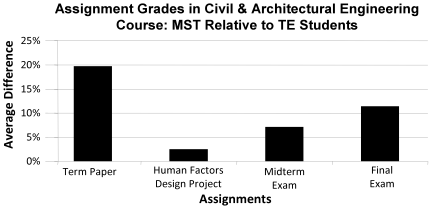
Figure 6. Grades of MST students relative to the TE students on four assignments in a selected course.
An analysis of grades over a three year period for a lab-intensive materials processing class produced the same result: MST grades were on par, or better, than TE students. This result was counterintuitive because MST majors start the program with clearly weaker skills and lower comfort with laboratory tools. However, MST students tend not to hesitate in asking for help in understanding a process and a TE student is often the one providing the help. This is mutually beneficial but it may not explain the unexpected differences.
In summary, MST students are not simply passing T&E courses but are actually performing on par or better than the TE students. This is a strong indication that MST students are learning substantial T&E content.
Technology Education Praxis TM results.
Approximately 15% of the MST students choose the technology specialization go on to obtain a Technology Education endorsement, requiring passing the TE Praxis TM . The TE Praxis TM scores for three MST majors were found to be between 630 and 640. These scores were within the national average performance range of about 620-680. These external data also suggest that MST graduates are learning substantial T&E content.
Discussion
Mutual Effects on the MST and TE Programs
In general, the MST and TE programs have had several positive impacts on each other. One important and desirable result is that TE & MST students receive a better understanding of the teaching skills required for a broader age range. MST majors are passionate about teaching K-5, while the TE majors are primarily interested in learning skills for grades 7-12. This difference in intended teaching age range among the majors leads to fruitful interactions in a variety of formal and informal settings, giving both majors more skills and experiences. This prepares each group to be better teachers, and to potentially fill broader roles in the school districts in which they will be employed.
A second effect concerns academics. MST majors in general tend to be more skilled in classic academic tasks like writing, research, and organization. This has a beneficial effect since, through interactions with MST majors. TE majors can improve their skills in these areas. There is also give-and-take because the TE majors have more skill and comfort with hands-on materials processing, so MST majors benefit by interacting with TE majors relative to these tasks.
A third effect deals with pedagogy. TE students especially early in their program are more interested in the technological aspects of their education. In contrast, as entering freshman MST students are interested in how to teach MST students also have teaching-related experiences earlier in their programs. Thus, in subsequent interactions, MST students can positively influence TE students relative to pedagogical concepts.
A fourth effect is social in nature, but likely has an important academic impact. TE majors are primarily male while MST majors are primarily female. This has led to substantial social interaction. For example, the students organize both a "Welcome Picnic" in the fall, with particular attention to incoming freshman, as well as a Spring "Semi-formal Dinner Dance". Additionally, MST participation in the regional Technology Education Collegiate Association (TECA) conference is increasing sharply, due to both professional and social forces. MST and TE majors interact at a significant level throughout the course of an average school week. In the last few years the level of social interaction has increased significantly, perhaps, due to the growth in the number of MST students which consequently has reached a critical mass. This informal "out-of-the-classroom" learning environment likely increases the content and practical knowledge of both student populations.
A fifth effect concerns gender diversity. The MST population is primarily female while the TE population is primarily male. This diversity results in several benefits, including a higher awareness and expectation of exemplary female role models in technology education.
The MST Program as a National Model for K-5 STEM Education Program
As mentioned earlier, the representation of STEM-trained K-5 teachers is low. Therefore, programs that can substantially increase the number of STEM-trained K-5 teachers should have a beneficial impact on K-5 student outcomes, resulting is higher skills and interest in STEM subjects. TCNJ’s MST program has increased the fraction of graduating STEM-trained K-5 teachers by about three-fold in the last five years. If an MST program is, by its nature, more attractive to students, then initiating such programs across the USA would increase the number of STEM-trained K-5 students on the national level.
A second reason to expect a positive impact from MST graduates is the inclusion of substantial T&E content and skills in an integrated fashion with the M- and S-components. Research indicates that the hands-on “active” model and make and open-ended problem skills are valuable in achieving high quality learning experiences in both STEM and non-STEM subjects ( Brophy, 2008 ; Hmelo-Silver, Duncan, Chinn, 2007 ; Lachapelle, 2007 ). These skills are just what are learned in the MST program. This gives existing Technology Education programs a substantial advantage in initiating valuable K-5 programs because they have well-established, education-based T&E course frameworks, facilities, and faculty.
Summary and Future work
In this paper, it was demonstrated that a multidisciplinary MST program has been successful both in terms of growth and content knowledge. The MST program should be particularly well-suited to today’s educational environment in which substantial numbers of students in STEM-related areas are lost, their scores are low on quantitative literacy, and they would likely score low on measures of technological literacy ( Steen, 2001 ). Even with the breadth of the multidisciplinary program, MST graduates scored significantly higher than non-MST majors on national Praxis TM tests for both math and science, while also scoring equivalently high on non-STEM subjects. Graduates also demonstrate high skills in T&E content that has substantial overlap with the STL. With extensive training and experience in all areas of STEM and integrated-STEM concepts, MST graduates are well prepared to thoroughly engage their prospective students in learning STEM and non-STEM subjects.
By means of summary the faculty believe there are five key attributes of the MST major:
-
Breadth through STEM
Through its multidisciplinary nature, STEM develops a broad, high quality skill set that closely matches what is needed by teachers in a K-5 classroom. Important among these skills is knowledge of each of the four STEM fields. The T&E portion of STEM is of critical importance since it provides a realistic context and relevant activities. -
Content integration
At all educational levels, but perhaps more importantly in the younger years, the interrelationships among the four elements of STEM are of vital importance. MST graduates have substantial experiences with these interrelationships. -
Attractive to students
The growth of the program indicates that the MST major is attractive to students and can bolster the overall enrollment in the program. -
Teacher modeling
All students in the T&E courses aspire to be teachers. Thus, unlike a general science or math course, a teaching context is always present as the students are engaged in the courses. -
Gender benefits
Most MST students are female, thus providing positive role models in STEM to female students in grades K-5.
If programs like that described herein were to be implemented across the nation, it could have a dramatic effect on the presence of technology education in the elementary school. For example, 35 TE programs with 30 MST graduates per year would yield over 1000 new integrated STEM teachers at the K-5 level each year. Given a 1000 to 1 impact ratio over the course of a teacher’s career, this would potentially impact at least 1 million students. This would have a significant impact on increasing the technological literacy of students in the lower grades and could result in considerable advantages to the credibility and acceptance of technology education as a vital part in K-12 education, as well as teacher preparation.
Steve O’Brien ( obriens@tcnj.edu ) is an Assistant Professor in the Department of Technological Studies at The College of New Jersey, Ewing
References
American Association for the Advancement of Science (1993), Benchmarks for science literacy: Project 2061 , New York: Oxford University Press.
Brophy, S., Klein, S., Portsmore, M., Rogers, C. (2008). Advancing engineering education in P-12 classrooms. Journal of Engineering Education, 97 (3) 369-387.
Carey, K., (2004, Winter). The real value of teachers: Using new information about teacher effectiveness to close the achievement gap, Thinking K-16, 8 (1), 3-32.
Educational Testing Service (2008). Understanding your Praxis TM scores (2008-09). [Retrieved July 27, 2009, from http://www.ets.org/portal/site/ets/menuitem.1488512ecfd5b8849a77b13bc3921509/?vgnextoid=69215a101d9b5010VgnVCM10000022f95190RCRD&vgnextchannel=5b8d43b2614ae010VgnVCM10000022f95190RCRD]
Hiebert, J., Morris, A. K., Berk, D., Janson, A. (2007). Preparing teachers to learn from teaching. Journal of Teacher Education, 58 (1), 47-61.
Hmelo-Silver, C. E., Duncan R. G., Chinn, C. A. (2007). Scaffolding and achievement in problem-based and inquiry learning: a response to Kirschner, Sweller, and Clark (2006), Educational Psychologist, I(2), 99–107.
International Technology Education Association, (2000). Standards for technological literacy: Content for the study of technology. Reston, VA: Author.
Karsnitz, J.R., O’Brien, S., Hutchinson, J.P. (2009). Engineering Design- an Introduction (1 st Ed.). New York: Delmar Cengage Learning.
Koch, J. & Feingold, B. (2006). Engineering a poem: an action research study. Journal of Technology Education, 18 (1), 54-65.
Lachapelle, C. P., Cunningham, C. M., Engineering is elementary: Children’s changing understandings of science and engineering. (2007). Paper presented at the American Society for Engineering Education Annual Conference and Exposition, Honolulu, Hawaii. June 24-27, 2007. Available online at http://www.asee.org/conferences/paper-search-form.cfm (accessed June 29, 2010).
McKay, M. & McGrath, B. (2000), Creating internet-based curriculum projects: a model for teacher professional development, T.H.E. Journal, 27 (11), 114-124.
Michaels, S., Shouse, A. & Schweingruber, H. (Eds.). (2008). Taking science to school; learning and teaching science in grades K-8, Washington, DC: National Academy Press.
National Commission on Teaching & America’s Future. (2000). Solving the dilemmas of teacher supply, demand, and standards: how we can ensure a competent, caring, and qualified teacher for every child (1 st ed.), New York, NY: Darling-Hammond, L.
National Education Association (2003). Status of the american public school teacher 2000-2001 (see for example http://www.nea.org/home/2233.htm)
Pearson, G. & Young, A. T. (Eds.) (2002). Technically speaking- Why all Americans need to know more about technology, ed., Washington, D.C., National Academic Press.
Sanders, M. (2009). STEM, STEM education, STEMmania, The Technology Teacher, 68 (4), 20-26.
Sechrist, C., Anagnostopoulos, P., Lewis, and Coburn, B. (Eds.), (1998). Technological literacy counts: outcomes of a workshop to enhance technological literacy of K-12 students, fie, vol. 3 (pp. 1282), 28th Annual Frontiers in Education. doi: 10.1109/FIE.1998.738673
Sullivan, D., Karsnitz, J., O'Brien, S. (2007, June), Development of a teacher education curriculum based on engineering principles and concepts. Paper presented at the American Society for Engineering Education Annual Conference and Exposition, Honolulu, Hawaii. June 24-27, 2007. Available online at http://www.asee.org/conferences/paper-search-form.cfm (accessed June 29, 2010).
Scelfo, J. (2007, Sept. 17). Come back, Mr. Chips. Newsweek.
Steen, Lynn. (2001). Mathematics and democracy: the case for quantitative literacy. Princeton, NJ: Woodrow Wilson National Foundation.
The Teaching Commission. (2004). Teaching at risk: a call to action. The CUNY Graduate Center, New York, NY.
Zubrowski, B. (2002). Integrating science into design technology projects: using a standard model in the design process, Journal of Technology Education, 13 (2), 48-67.