JTE v22n2 - The Effects of Solid Modeling and Visualization on Technical Problem Solving
The Effects of Solid Modeling and Visualization on Technical Problem Solving
Douglas Koch and Mark Sanders
Technology education and many other fields are placing increased emphasis on problem solving. The Standards for Technological Literacy (STL) state that “Problem solving is basic to technology” ( ITEA, 2000 , p. 90). Jonassen (2000, p. 63) contends that “most psychologists and educators regard problem solving as the most important learning outcome for life.” “Problem solving is a critical process skill that involves virtually all aspects of existence” ( Wu, Custer, & Dyrenfurth, 1996 , p. 56). “Virtually everyone, in their everyday and professional lives, regularly solves problems” ( Jonassen, 2000 , p. 63). All problems are not the same and must be approached differently than rote or component skills ( Westberry, 2003 ). The fields of Technology and Technology Education place strong emphasis on problem solving and application, as teachers strive to promote technological literacy.
Many would contend that technology education and related fields have been teaching and employing problem solving since their inception ( McCade, 1990 ; Todd 1999 ). Few will argue the importance of problem solving, yet little is known about it. It is unclear how to define problem solving. There are many definitions for problem solving, and it can be conducted through various means (Hill, 1997). To further complicate the matter, problem solving takes on many different meanings, depending on the type of problem or the specific problem being addressed. There is also a myriad of problem solving models and terminology currently in use ( Flowers, 2010 ).
STL ( ITEA/ITEEA, 2000/2002/2007 , p. 5) considers design the primary problem solving approach in technology education. Few, if any, technology education processes have received as much attention in the literature in recent years as problem solving has, particularly design, although design is not the only problem solving method. Custer (1995) considers design a major subset of technical problem solving. One unique aspect of design problems is that the designer “typically, does not know in advance what the goal state will be, although he [sic] usually has criteria to evaluate potential goal states” ( Carroll, Thomas, & Malhotra, 1980 , p. 143). For teaching problem solving and design, Williams (2000) suggested focusing on activities. The problem and the student determine what aspects of problem solving are needed in order to solve a particular problem. The most important aspects of problem solving he identifies are: evaluation, communication, modeling, generating ideas, research and investigation, producing, and documenting. The majority of these aspects are within the capabilities of many solid modeling programs. The problem solving aspects Williams identifies are very similar to a variety of problem solving models teachers present to their students. One issue with most of these models is that they are very linear and suggest that all problems are solved in this linear manner. Research on design shows that both experts and students develop flexible approaches to solving individual problems. When students are forced to follow a teacher-defined process, the students often use their own strategies and then do the work necessary to meet their teacher’s requirements ( Williams, 2000 ).
Technical problem solving encompasses and oftentimes involves design, but also includes other aspects and employs various technologies in reaching a solution. Boser (1993) states that technical problem solving “refers to the systematic way of investigating a situation and implementing solutions” (p. 12). Childress (1994) defines technical problem solving as:
The problem solving process... combined with the processes of technology in engineering, architecture, industrial workshops, research and development laboratories, the home, the office, and field, etc., and certainly the technology education laboratory. The processes of technology employed to solve problems of human need or want characterize this method. (p. 94)
Spatial visualization is an important component of the problem solving process, particularly in technical problem solving and design. Visualization has been correlated with problem solving ( Mack, 1992 ). One must be able to visualize, or “see” in one’s mind, a mental picture of possible solutions and outcomes to a particular problem. Visual thinking is constantly used and pervades all human activities. For almost all activities we undertake, we create or think visually ( Arnheim, 1974 ; McKim, 1980 ). Many cognitive tasks that we undertake involve cognitive representations ( Zhang, 1997 ). When you describe driving directions to someone or tell someone what your living room looks like, you see a visual image of those things in your mind. An important aspect of visualization is that it can be improved by practice. ( Blade, 1949 ; Brinkmann, 1966 ; Cohen, 1981 ; Rosenfeld, 1985 )
Programs that involve the study of technological processes have always taught technical design and other forms of standardized visual communications. The equipment and techniques have changed a great deal in the last few decades, as advancing computer technologies have made it possible to produce complex models using personal computers. The equipment and software for technical design is often very costly and can require a great deal of time and effort to learn its proper use. Current CAD programs have made visualization of designed objects easier by adding true three-dimensional functions and high quality, rendered images of those designs. The trend in industry has shifted greatly from simple 2D designs to these detailed 3D models. A question that remains unanswered is the extent to which these CAD programs aid students in problem solving, designing, communicating, or learning these concepts.
Long (2003) pointed out that increasing graphic realism does not always lead to better learning. “Like many things with technology, just because we can do something may not mean we should” (p.8). Godfrey (1999) contends that “viewing three-dimensional solid models removes it from its usual two-dimensional form of abstraction and makes it more suitable for use as a method for spatial visual learning” (p. 2).
The purpose of this study was to determine whether or not the use of solid modeling software increases participants’ success in solving a specified technical problem and how visualization affects their ability to solve a technical problem. Little is truly known about how individuals go about solving problems and what tools better equip them to solve certain problems. Jonassen (2003b) concludes, “The potential for research confirming positive relationships between modeling and problem solving is great” (p. 377) and goes so far as to state “no empirical research has examined the effects of using technology tools for representing problems on problem solving performance.” A great deal more research is needed to better understand how problems are solved and what methods and tools best prepare individuals to face future problems.
Purposes
The purpose of this study were to determine if (a) students’ visualization skills affect their problem solving ability; (b) the use of 3D modeling software in the design and production of a prototype for a technical design problem is more effective than using sketching; and (c) the use of 3D modeling software offsets any differences in low spatial visualization skills for solving a technical design problem.
The potential exists for students to be able to better visualize problems when designing with 3D representation. Research dealing with assembling objects shows that students tend to do better when they can view a physical or 3D object as opposed to 2D drawings ( Pillay, 1998 ).
Methodology
Design
The design for this study was an experimental posttest-only design. Each participant completed the Purdue Spatial Visualization Test–Visualization of Rotations (PSVT-R). The participants were randomly assigned to either the control group or the experimental group. The control group designed a solution to the design problem using sketching and then physically constructed their prototype with the provided materials. The experimental group participants each used ProDesktop solid modeling software and sketching to design their solutions and then constructed a prototype with the provided materials. The physical models or prototypes were then scored as either successful or unsuccessful.
Research Hypotheses. The following hypotheses were investigated in this study:
H 0 1 : Participants’ spatial visualization skills, as measured by the Purdue Spatial Visualization Test–Visualization of Rotations, will not affect their technical problem solving ability.
H 0 2 : Participants using solid modeling software to design solutions to technical problems will not show greater success in the construction of a physical model or prototype than those using sketching.
H 0 3 : Participants with lower visualization skills, as measured by the Purdue Spatial Visualization Test–Visualization of Rotations, will not perform better using solid modeling software than those with equal scores using sketching in the design and production of a prototype for a technical problem.
Selection of Participants
The experimental and control groups were comprised of 24 and 23, respectively, randomly assigned participants from the Industrial and Engineering Technology Program at Southeast Missouri State University. Each student was randomly assigned, irrespective of which class the student was enrolled in, to either the experimental or control group. Specifically, participants were students enrolled in an introductory or advanced computer-aided solid modeling course taught by the researcher. The majority of the participants were technology education, engineering technology, and graphics technology majors in different stages of their academic programs. The remainders of the participants were university studies majors, undeclared majors, or minors in engineering technology. Most of the participants had little previous experience with drafting or CAD. Few of the students had any formal exposure to solid modeling software prior to the instruction at Southeast Missouri State University.
Variables
Independent Variables. The independent variables in this study were: (a) the method the participants used to design their prototype, and (b) the participants’ spatial visualization ability. Participants in the control group used sketching in the design of their prototype, while experimental group used ProDesktop solid modeling software for the design of their prototype. Spatial visualization was measured with the Purdue Spatial Visualization Test–Visualization of Rotations (PSVT-R).
Sketching was selected as the control method because students in technology education are generally required to produce sketches of possible solutions to problems prior to constructing a solution. A survey by Römer, Weißhahn, Hacker, Pache, & Lindemann (2001) of 106 designers indicated that sketching was the dominant external aid for early stages of the design process. Sketching was used significantly more than simple models, complex models, and CAD in the development of solutions. CAD was used more for documentation and complex testing of solutions.
The Purdue Spatial Visualization Test–Visualization of Rotations (PSVT-R) instrument was designed to measure the participants’ ability to visualize the rotation of three-dimensional objects. This instrument was chosen because of its higher correlation with similar instruments measuring visualization such as the Shepard-Metzler tests. The format for the PSVT-R is thirty questions. For each question, an object is pictured in one position, then that object is pictured again, having been rotated to a different position. The participants are shown a second object and given five choices, one of which matches the rotation of the original object example. They are to select the object that shows the same rotation as the original example for that question. A sample PSVT-R question is shown in Figure 1(see next page). Bodner & Guay (1997) attest that these tests are “among the spatial test least likely to be confounded by analytic processing strategies.” (p. 13). The Minnesota Paper Form Board Test a similar test used to measure visualization but has a weaker correlation with other spatial visualization instruments and is likely to be confounded by analytic processing ( Bodner & Guay, 1997 ).
A shorter 20 questions Purdue Visualizations or Rotation (ROT) version of the PSVT-R was derived by removing 10 items from the instrument. Studies on reliability for the shortened ROT of chemistry students report Kuder-Richardson (KR20) internal consistency test values of .80, .78, and .80 with samples of 758, 850, 1273 respectively. They also reported Split Half reliabilities of .83, .80, .84, .85, .82, and .78 with samples of 757, 850, 127, 1273, 1648, and 158 respectively. The construct validity for the 30 item PSVT-R is supported by a study of five measures of spatial ability. The highest correlation was between the PSVT-R and the Shepard-Metzler test (r = 0.61, p < 0.001). The lowest correlation was between the PSVT-R and the Minnesota Paper Form Board (MPFB) test (r = 0.25, p < 0.01) ( Bodner & Guay, 1997 ). For this study the original 30 item PSVT-R test was used.
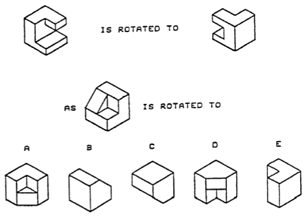
Sample PSVT-R problem
Dependent Variable. The dependent variable was participant performance in solving a technical design problem. The technical design problem used to measure problem solving performance was designed to require a substantial amount of design skill and effort within the limitations of time and resources. The problem selected for the study involved the conversion of rotational motion to reciprocal motion. Such a conversion is fundamental to many applications and can be found in many technical devices and systems, such as the internal combustion engine, windmills, and early water-powered devices. The problem also required the consideration of multiple planes or surfaces, adding to its complexity and requiring high level visualization and problem solving skills. Real world examples were not intentionally mentioned to the participants, but it was anticipated that the participants would associate or mentally transfer this problem to devices or mechanisms with which they were familiar. The problem solving activity studied in this research was an ill-defined design problem. That is, there was no set procedure for arriving at a solution, and there were many possible solutions.
The problem was also intended to have a cost high enough to benefit from the construction of the solid model for analysis and design purposes. The external representations created using solid modeling exhibit many of the characteristics of physical objects, as well as allowing for analysis and manipulation that is not possible on physical objects.
The participants were instructed to design a mechanism that would convert rotary motion to reciprocal motion and move a block forward a fixed amount within specified tolerances (see Appendix A). Upon completion of the design, the participants were instructed to construct a working model or prototype using supplied materials.
The prototype had to successfully advance three 1.5 in. by 1.5 in. by 3 in. blocks a distance of 3.5 in. with a tolerance of plus or minus 1/8 in.. The prototypes were dichotomously scored as either successful or not successful. If all three blocks were successfully advanced, the required 3.5 in. within the 1/8 in. tolerances in one of two possible attempts, the prototype was scored as a successful solution to the design problem. If the prototype failed to consecutively advance all 3 blocks during the attempts, it was scored as not successful.
The dichotomous value, either successful or not successful, was the dependent variable. This method of evaluation was selected because many ill-defined problem solving activities may have multiple, correct solutions. For this problem, the participants were only evaluated on mastering the stated objective. Other aspects of product design and manufacturing, such as creativity, aesthetics, cost, durability, and manufacturability, were not considered within the scope of this research.
Both groups were limited to three hours for completing the design and three hours for construction of the prototype, but they were not required to use that entire amount of time. Each group completed the design and construction of the prototypes over two consecutive days. During the first three hour session, the participants designed their solutions. The next day, the participants constructed their designed solution. They were instructed that they had to construct the design that they created in the previous session and were not allowed to change their designs. This was done to eliminate any influences they may have been exposed to between sessions. The completed prototypes were compared to the designs in order to verify that they did match.
Results
Descriptive Statistics
Both groups completed the PSVT-R prior to beginning the design problem. The mean score for the PSVT-R or the 47 participants was 22.26 with a standard deviation of 4.55. The mean score for the 23 participants in the control group was 21.49 with a standard deviation of 4.39. The mean score for the experimental groups 24 participants was 23 with a standard deviation of 4.66. There were 11 successfully constructed prototypes, five from the control group, and six from the experimental group (see Table 1 next page).
| Source | df | F | r 2 | p | ||
|---|---|---|---|---|---|---|
| Visualization Score 1 | 1.325 | .029 | .256 | |||
| Group | N | M | SD | Successful Completion of Prototype | ||
| Control | 23 | 21.49 | 4.39 | 5 | ||
| Experimental | 24 | 23.00 | 4.66 | 6 | ||
Hypotheses Tests
Even though random assignment was used for the control and experimental groups in order to control for any variation in spatial visualization abilities, the control and experimental groups’ visualization scores were analyzed using analysis of variance to ensure that there were no significant differences between the groups spatial visualization abilities as measured by the PSVT-R These results revealed that there were no significant differences between the groups, F (1, 45) = 1.325, p = .256, indicating the experimental and control groups were equivalent in spatial visualization (see Table 1).
The successful or unsuccessful completion of a working prototype and the visualization scores were processed using logistic regression to determine if any statistically significant differences existed between the groups. This methodology was selected because the dependent variable was dichotomous. Logistic regression was chosen over linear regression because the latter could result in predicted values greater than one (successful) or less than zero (unsuccessful) when testing dichotomous variables, and the effects of the independent variable could be greatly underestimated ( Pedhazur, 1997 , p. 715). They were also analyzed to determine if there was any interaction between the method of design and the visualization scores (see Table 2 on next page). The interaction was investigated to determine if using solid modeling software would offset low scores in visualization.
| Variable | B | B/SE | Wald | x 2 (df) | p |
|---|---|---|---|---|---|
| Note. * p <.05 | |||||
| Model 1 | 7.787(1)* | .005 | |||
| Constant | -9.018 | 3.539 | 6.494 | ||
| Visualization* | 0.332 | 0.144 | 5.313 | .021 | |
| Model 2 | 7.977(2)* | .019 | |||
| Constant | -9.057 | 3.536 | 6.559 | ||
| Visualization* | 0.339 | 0.146 | 5.402 | 020 | |
| Method | -0.242 | 0.767 | 0.100 | .752 | |
| Method 3 | 8.732(3)* | .033 | |||
| Constant | -6.671 | 4.010 | 2.768 | ||
| Visualization* | 0.239 | 0.169 | 1.986 | .159 | |
| Method | -6.503 | 7.405 | 0.771 | .380 | |
| Interaction | 0.256 | 0.299 | 0.731 | .393 | |
H 0 1 : As suggested in the literature, the analysis indicated that spatial visualization skills were a significant predictor of being able to successfully complete the design problem. The higher the spatial visualization score a participant had, the more likely they were to be able to solve the design problem and successfully produce a prototype that met the requirements to be considered successful.
The results from model one (see Table 2) indicated that spatial visualization was a significant predictor of being able to complete this technical design problem. The coefficient on the visualization variable has a Wald statistic equal to 5.313, which is significant at the .05 level ( p = .021). The overall model was significant at the .05 level according to the model chi-square statistic. The model predicts 77% of the responses correctly. The null hypothesis ( H 0 1 ) was rejected.
Does a participant’s visualization ability have an effect on their problem solving ability? The data from this study revealed that visualization ability has an effect on, or significantly correlates with, the participants being able to solve this technical design problem. The participants’ visualization ability, as measured by the PSVT-R was a significant predictor of their success for the given technical design problem.
H 0 2 : The results from step two indicated that there was no significant difference between participants who used solid modeling and those who used sketching to solve the given design problem. The results of the analysis supported the null hypothesis, thus the null hypothesis failed to be rejected.
Step two of the logistic regression analysis included the addition of the Method variable, which takes into account whether the participants used ProDesktop solid modeling software and possibly sketching or if they used only sketching. The model was significant at the .05 level ( p = .019) with a chi-square statistic of 7.977 ( df = 2). The Method was not significant at the .05 level ( p = .752) and a Wald statistic of 0.100. Five participants of the control, or sketching only, group constructed successful prototypes and six of the experimental, or ProDesktop, group constructed successful prototypes.
H 0 3 : Because there was no significant difference in performance between the two groups and no significant interaction between the method of design and spatial visualizations scores, the null hypothesis failed to be rejected. Using ProDesktop to design the solution did not offset differences in the participants’ visualization scores (see Table 2). The model was significant at the .05 level ( p = .033) with a chi-square statistic of 8.732 ( df = 3). The interaction was not significant at the .05 level ( p = .393) and a Wald statistic of 0.731. A graph of the logistic regression curves for the two methods used (sketching and solid modeling), which shows the predicted probability of successfully solving the problem compared to the visualization score, reveals some trends that contradict hypothesis three (see Figure 2).
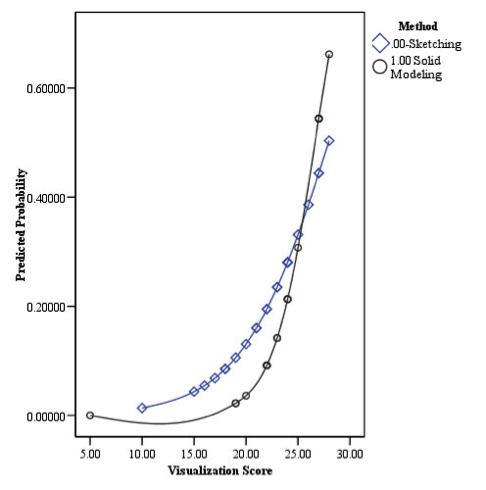
Logic Regression Curves for Sketching and Solid Modeling
Discussion and Implications
Discussion
Caution must be used when generalizing the results of this study because the participants consisted of 47 randomly assigned engineering technology students. The results from this study also suggest that because the interaction between the type of design method and spatial visualization ability did not result in a significant difference, the design method and visualization ability were homoscedastic for this particular problem. Using solid modeling software to design a solution did not offset low spatial visualization scores or offer any advantages to those with high visualization scores. Examination of Figure 2 provides some evidence that the opposite might be true. Though the results of the analysis of interaction was not significant, the graph reveals that the participants with lower visualization scores, under 24, that used sketching had higher probabilities of success than those that used solid modeling. The participants that used solid modeling showed a higher probability of success above a spatial visualization score of 24. In this case using solid modeling did not offset low visualization scores and increase the probability of solving the design problem. Using solid modeling actually decreased the probability of success for participants with low visualization scores and increased the probability of success for participants with high visualization scores. This could indicate many things, such as, high spatial visualization ability may be needed to effectively use and design with solid modeling software. It was hypothesized that using solid modeling would reduce the cognitive load on the participants. Several researchers contend that using various technologies could assist in problem solving, reducing cognitive load, and increase learning ( Jonassen, 2000 ; Pillay, 1998 ; Renkl & Atkinson, 2003 ). More research is needed to further investigate these findings and examine their significance and implications.
Examination of the prototypes produced by the participants reinforces several basic strategies regarding design problem solving and ill-structured problem solving activities. Eight non-successful solutions properly advanced the blocks, but they failed to limit the distance to the specified tolerance. Many of the participants seemed to feel that they had successfully completed the problem but overlooked the specific requirements. This points out the importance that the problem and the requirements for the problem be understood and reviewed.
Some participants failed to consider things such as the materials, tools, and time constraints. By looking at the design ideas and the prototypes, it becomes apparent that many participants chose solutions to the problem that may not have matched well with the available materials and tools. Several of the ideas appear to be viable solutions, if other materials were used, but not when trying to construct a solution from foam board using a utility knife. Many of the designs tried to incorporate threaded mechanisms and/or gears. The precision needed to produce functional gears and threads cannot easily be reached with the tools and materials provided. Here again, this could relate to a less than thorough understanding of the problem. The participants did not fully understand the materials they had available or how they could best be shaped with the provided tools. The available materials and resources are an important component of any problem, and understanding the properties and function of the materials as they relate to the particular design problem is important.
Some of these differences could also be because the participants were novices at solving problems of this nature. Experts are better able to retrieve and distinguish between pertinent information and information, or ideas, that offer no real advantage to arriving at a solution ( Wu, Custer, & Dyrenfurth, 1996 ). If they have not experienced problems within this context before, they may have experienced difficulty transferring similar schemas to this particular problem ( Bransford, Brown, & Cocking, 2000 ; Jitendra, 2002 ; Westberry, 2003 ).
Implications for the Classroom and Research
Continued research is spatial visualization and technical problem solving is needed. This study and related literature suggest that relatively little is known about how individuals solve technical design problems and how visualization and the use of technology affect the outcomes.
The study needs to be replicated with additional participants to further investigate the findings. As most design problems pose different challenges and opportunities, the use of different design problems, instead of one specific problem, could expand this study. A process to categorize different technical design problems would be beneficial to establish, and would aid in further analysis.
In the classroom, good problem solving practices need to be observed and implemented. Although there is still some controversy about whether or not a step-by-step procedure that works for all problems exists, good strategies still need to be employed. Many things were overlooked or not properly considered by the participants, such as the materials and tools they had to use. Another component of the problem that needs to be clearly understood is the objective of the solution. Participants need to completely understand the requirements and the goal of the problem. If they don’t know what the target is, it makes it very difficult to hit. It would be like shooting baskets on a basketball court while blindfolded. If they don’t know and truly understand the goal, it is difficult to achieve.
It was found that spatial visualization ability was a predictor of success for the technical design problem presented. This is an important concept that we seldom consider in the classroom. Many programs teach and require some kind of design or CAD classes, but the research on whether or not continued education in those classes improves visualization is somewhat mixed ( Frey & Baird, 2000 ; Devon et al., 1994 ). Many overlook materials that focus on teaching visualization and preparing students to be able to better visualize objects. As solid modeling is employed, this may become even more prevalent. How to best use solid modeling in the design process needs further exploration. It is a tool, and as with all tools, it needs to properly be employed. How it must be used in the educational setting may differ from how it is used in industry by experienced designers and engineers. This and other studies demonstrate that visualization is an important component of the process. Possible suggestions for the classroom would be to focus on visualization. Pretesting of students could be done to assess their spatial visualization abilities, so that students with lower visualization scores could be assisted or given some additional instruction that would help improve their abilities. If visualization abilities were known, students could be grouped to work on projects based on their abilities. Grouping students with high visualization skills with those of less developed visualization skills could help to ensure success of the projects, as well as provide exposure and practice to the students that are developing those skills.
Another important characteristic of technical problem solving and visualization is that these skills both need to be practiced. Whether or not these skills or abilities are perishable is a question that needs to be addressed. Teachers need to ensure that their students practice problem solving and visualization. Often students are given a design problem as a culmination of a class or program. Having a series of small technical design problems, which require multiple problem solving components and various visualization skills, would prepare students for larger, more difficult projects. While teachers typically use this approach for many subjects, when it comes to problem solving and visualization teachers often jump right in with both feet. Concepts like scaffolding, structuring, and sequencing need to be properly developed and practiced.
Several studies have showed the importance of visualization to problem solving. This study also supports that spatial visualization can be an important component and predictor of problem solving success. Educators need to continue to develop problem solving skills and visualization skills. Many times, the underlying principles of visualization are overlooked, and research of this kind points out that the implementation of activities and instruction that teach students the skills and abilities they need is the key to their success.
Douglas Koch ( dskoch@semo.edu ) is an Assistant Professor in the Department of Industrial and Engineering Technology at Southeast Missouri State University. Mark Sanders ( msanders@vt.edu ) is a Professor in Integrative STEM Education at Virginia Polytechnic Institute and State University.
References
Arnheim, R. (1974). Art and Visual Perception: A Psychology of the Creative Eye . Berkeley: University of California Press.
Blade, M. F. (1949). Experiment in visualization. Journal of Engineering Drawing, 13 , 20-21, 29.
Bodner, G. M., & Guay, R. B. (1997). The Purdue visualization of rotations test. The Chemical Educator, 2 (4).
Bransford, J. D., Brown, A. L., & Cocking, R. R. (Eds.). (2000). How people learn: Brain, mind, experience, and school . Washington, DC: National Academy Press.
Brinkmann, E. W. (1966). Programmed instruction as a technique for improving spatial visualization. Journal of Applied Psychology, 50 (2), 179-184.
Carroll, J. M., Thomas, J. C., & Malhotra, A. (1980). Presentation and representation in design problem-solving. British Journal of Psychology, 71 , 143-153.
Cohen, H. G. (1981). The use of manipulatives and their effect on the development of spatial conceptualizations . Paper, Educational resources Information Center, p. 7.
Custer, R. (1995). Examining the dimensions of technology. International Journal of Technology and Design Education, 5 , 219-244.
Devon, R., Engel, R. S., Foster, R. J., Sathianathan, D., & Turner, G. F. (1994). The effects of solid modeling software on 3-D visualization skills. Engineering Design Graphics Journal, 58 (2), 4-11.
Flowers, J. (2010). The Problem in Technology Education (A Definite Article). Journal of Technology Education, 21 (2), 10-20.
Frey, G., & Baird, D. (2000). Does rapid prototyping improve student visualization skills? Journal of Industrial Technology 16 (4), 1-6.
Gillespie, W. H. (1995). Using solid modeling tutorials to enhance visualization skills. Dissertation Abstracts International, 56 , 11A. (UMI No. AAI9606359)
Godfrey, G. S. (1999). Three-dimensional visualization using solid-model methods: A comparative study of engineering and technology students. Dissertation Abstracts International, 60 , 12A. (UMI No. AAI9955758)
Guay, R. B. (1977). Purdue Spatial Visualization Test–Visualization of Rotations . West Lafayette, Indiana: Purdue Research Foundation.
International Technology Education Association (ITEA), Technology for All Americans Project. (2000). Standards for technological literacy: Content for the study of technology . Reston, VA: Author.
Jitendra, A. (2002). Teaching students math problem-solving through graphic representations. Teaching Exceptional Children, 34 (4), 34-38.
Jonassen, D. H. (2000). Toward a design theory of problem solving. Educational Technology Research and Development, 48 (4), 63-85.
Jonassen, D. (2003a). Designing research-based instruction for story problems. Educational Psychology Review, 15 (3), 267-296.
Jonassen, D. (2003b). Using cognitive tools to represent problems. Journal of research on Technology in Education, 35 (3), 362-381.
Long, P. D. (2003). How much reality does simulation need? Syllabus: Technology for higher education, 16 (2), 6-8.
Mack, W. E. (1992). The Effect of Training in Computer-Aided Design on the Spatial Visualization Ability in Selected Gifted Adolescents. Dissertation Abstracts International, 53 , 03A. (UMI No. AAG9500831).
McCade, J. (1990). Problem solving: Much more than just design. Journal of Technology Education, 2 (1), 29-42.
McGee, M. G. (1979). Human spatial abilities: Psychometric studies and environmental, genetic, hormonal, and neurological influences. Psychological Bulletin 86 , 889-918.
McKim, R. H. (1980). Experiences in visual thinking (2nd ed.). Monterey, CA: Brooks/Cole Pub Co.
Pedhazer, E. J. (1997). Multiple regression in behavioral research (3rd ed.). Florida: Harcourt Inc.
Pillay, H. (1998). Cognitive processes and strategies employed by children to learn spatial representations. Learning and Instruction, 8 (1), 1-18.
Renkl, A., & Atkinson, R. K. (2003). Structuring the transition from example study to problem solving in cognitive skill acquisition: A cognitive load perspective. Educational Psychologist, 38 (1), 15-22.
Römer, A., Weißhahn, G., Hacker, W., Pache, M., & Lindemann, U. (2001). Effort-saving product representations in design-results of a questionnaire survey. Design Studies, 22 (6), 473-491.
Rosenfeld, D. W. (1985). Spatial relations ability skill training: The effect of a classroom exercise upon the skill level of spatial visualization of selected vocational education high school students. Dissertation Abstracts International, 46 , 06A. (UMI No. AAG8518151)
Todd, R. (1999). Design and technology yields a new paradigm for elementary schooling. Journal of Technology Studies, 25 (2), 26-33.
Westberry, R. (2003). Design and problem solving in technology education. In K. R. Helgeson & A. E. Schwaller (Eds.), Selecting instructional strategies for technology education: 52nd yearbook of the Council on Technology Teacher Education . New York: Glenco, McGraw-Hill.
Williams, P. J. (2000). Design: The only methodology of technology? Journal of Technology Education, 11 (2), 48-60.
Wu, T., Custer, R. L., & Dyrenfurth, M. J. (1996). Technological and personal problem solving styles: Is there a difference? Journal of Technology Education, 7 (2), 55-71.
Zhang, J. (1997). The nature of external representations in problem solving. Cognitive Science, 21 (2), 179-217.
APPENDIX A: PROCEDURES FOR TREATMENT GROUP
Design Challenge
Problem
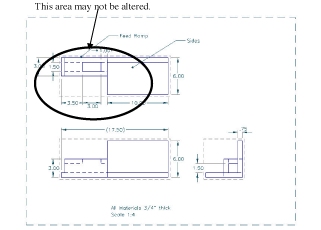
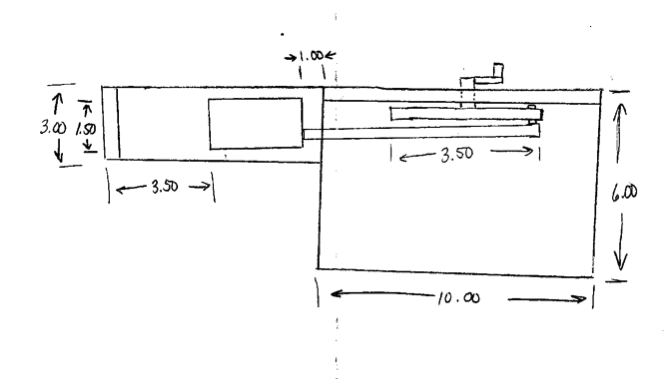
You are to design and develop a solution that advances 1.5 in. by 1.5 in. by 3 in. blocks, one at a time, a distance of 3.5 in. (see figure 1 and the video provided). You must include some type of handle to turn to advance the blocks. The blocks will be fed into the opening one at a time by hand. The mechanism you design must be powered by rotary motion, meaning you must turn or crank the handle to advance the blocks. Sliding a handle back and forth is not acceptable. The fixture that the blocks must fit in and be advanced through is provided.

Block
Fixture Through Which Blocks Must Fit and Be Advanced
Procedure for the Treatment Group. You will need to design a mechanism that converts rotary motion into reciprocal motion. You are to design the mechanism using ProDesktop. The drawings for the fixture and blocks are already drawn and your instructor will inform you where they are stored on your computer. Once your mechanism is designed you will be constructing a prototype from the materials listed below. The prototype must successfully advance 3 blocks 3-1/2 inches with a tolerance of plus or minus 1/8 th of an inch and should be reflective of your drawn design. Save all of your ProDesktop solution at the instructed location.
You may not alter the feed ramp end but you may alter the sides of the device in any way.
This area may not be altered.
Criteria Used to Evaluate Prototypes/Solutions Developed
- You have 3 hours to complete your design and 3 hours to construct the prototype/solution.
- You must include some type of crank that is turned to operate the solution.
- The device must advance 3 blocks within these tolerances in order to be successful.
- The blocks must be advanced 3.5 in. with a tolerance of plus or minus 1/8 th of an inch.
Materials Provided From Which Prototypes/Solutions May Be Constructed Hot glue gun, glue sticks, double sided tape, wood glue, masking tape, duct tape, 1/4" dowel rods, 3/8” dowel rods, 1/2” dowel rods, foam core board, 1/2” rigid foam, corrugated cardboard, 1/4” hardboard, 1/2” plywood, assorted nails, screws, bolts, and nuts.
APPENDIX B: EXAMPLES OF SUCCESFUL AND UNSUCCESSFUL PROTOTYPES
Successful Sketch
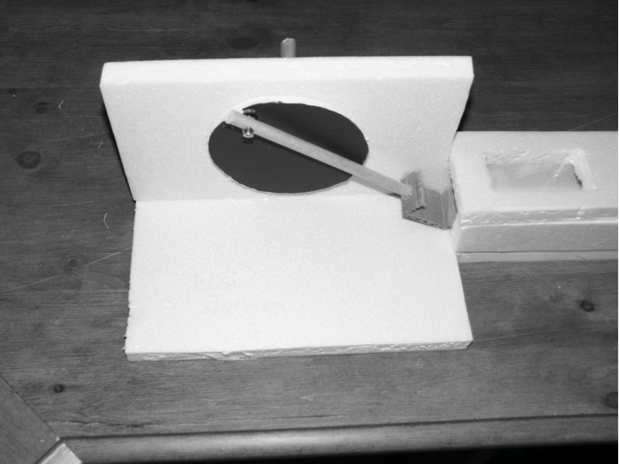
Successful Prototype Constructed from Sketch
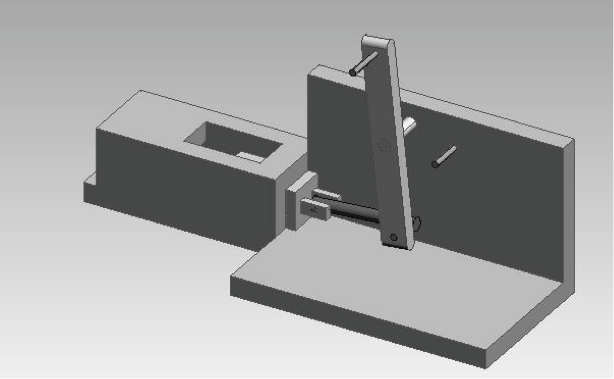
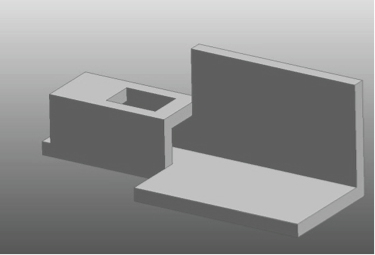
Unsuccessful ProDesktop Design
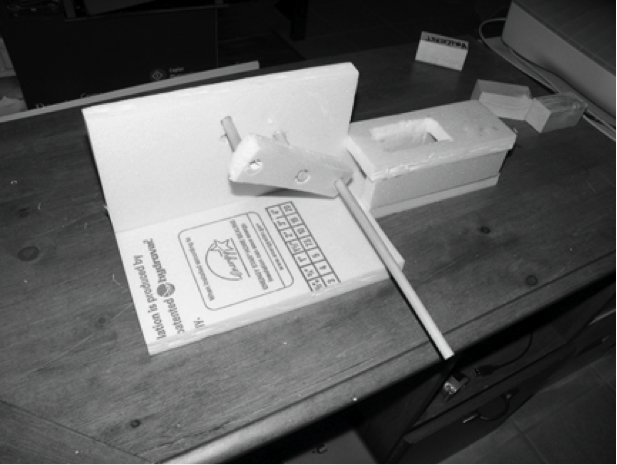
Unsuccessful Prototype Constructed from ProDesktop Design