Self-Report and Academic Factors in Relation to High School Students' Success in an Innovative Biotechnology Program
Self-Report and Academic Factors in Relation to High School Students' Success in an Innovative Biotechnology Program
Biotechnology constitutes one of the most challenging, cutting-edge, and rapidly growing fields in science today ( U.S. Department of Labor, 2008 ). Its products influence our daily lives on multiple levels and often improve our quality of life. Both the practical implications and the hands-on nature of this 'modern science' make the topic of biotechnology an attractive addition to the high school science curriculum ( France, 2007 ). The interdisciplinary nature of biotechnology also makes it an ideal candidate for future curricular offerings that strive to incorporate the K-12 Framework for Science Education ( National Research Council [NRC], 2012 ) and the Next Generation Science Standards ( NGSS ; http://www.nextgenscience.org/ ). Bybee (2011) noted that the shift from inquiry methods to the use of both science and engineering practices will likely be the greatest challenges related to the NGSS, and suggested that these practices should be thought of as both instructional strategies and learning outcomes. Indeed, the NGSS performance expectations place emphasis on combining practice and content in the assessment of student learning ( Bybee, 2012 ). Sneider (2012) suggested the use of existing learning activities as a first step in integrating technology and engineering practice into science teaching.
The literature provides both a conceptual base for integrating biotechnology into curricular offerings, as well as practical examples implemented by early adopters. Wells (1994) , for example, gathered biotechnology experts to compose a common taxonomic structure to guide the development of high school biotechnology curricula. Twenty panel members identified eight main areas, including topics that span both science (e.g., biochemistry, medicine, environmental science) and engineering (e.g., genetic engineering, food science, environmental safety). Similarly, an early survey of biology teachers captured recommendations for science and engineering content (the structure and function of DNA, understanding the genetic code, genetic engineering, cloning, and the biology of cancer), as well as the recommendation that this content be delivered through labs when possible ( Zeller,1994 ). Harms (2002) noted that providing students with the opportunity to practice biotechnology provides specific examples of applied science that generalize to a differentiated understanding of concepts.
A small number of studies have been published to describe the impact of biotechnology programs ( Bigler & Hanegan, 2011 ; Gabric, Hovance, Comstock, & Harhisch, 2005 ; Marchaim, 2001 ; Powell & Stiller, 2005 ; Santucci, Mini, Ferro, Martelli, & Trabalzini, 2004 ). Initial results are positive, indicating an increase in student interest and a positive shift in motivation to learn ( Powell & Stiller, 2005 ; Santucci et al., 2004 ). Knowledge gains have also been reported, though further investigation indicates that knowledge has been measured broadly. Dawson & Soames (2006) , for example, asked students to list as many examples as possible in relation to biotechnology, genetic engineering, and cloning. Correct examples were scored as indicators of knowledge. Pre-post assessments have also been used, as well as post-only open-ended questions ( Mueller, Knoblock, & Orvis, 2009 ). The latter method, in particular, indicated that students' ability to apply biotechnology knowledge was significantly improved if teachers used active rather than passive teaching techniques. Additional research with pre-post pencil-paper assessments suggests that hands-on classes that utilize professional equipment enhance student learning above and beyond the gains normally associated with these classes ( Bigler & Hanegan, 2011 ).
Framed within the context of the NGSS, these descriptions indicate that many biotechnology programs are providing students with opportunities to engage in science and engineering practice and that these experiences result in positive outcomes. The measures used in the literature to date have been specific to biotechnology rather the broader science and engineering practices embedded within the activities. None measured skill and few measured applied knowledge within the context of practice as envisioned by the NGSS. Assessment of these experiences may be a challenge given that it is difficult to assess student understanding of the various topics introduced via hands-on activities ( Steck, DiBase, Wang, & Boukhtiarov, 2012 ). As we move into the next generation of science standards, it will be critical to integrate the use of biotechnology techniques and equipment within the disciplinary core ideas of the NGSS, and to provide appropriate measures to document student learning within this context.
Background and Purpose
The need for a shift in science education that moves from the memorization of facts to learning by doing has been widely recognized for decades and now has the potential to be realized through the NGSS ( National Science Teachers Association, 1982 ; National Science Board, 2007 ; [NRC], 2012 ). One innovative program poised to respond to this shift is the UCSD ScienceBridge Tech Sites. With funding from the Howard Hughes Medical Institute (#51006101) and the United States Department of Education (#R305A080692), ScienceBridge has pilot tested the use of high school-based biotechnology production sites. Within this context, biotechnology is defined in relation to specific tasks related to genetic engineering, protein structure and function, and enzyme reactions. There are eight departments in the Tech Site model: Solutions and Aliquots, Microbial Media, Inventory Management, Risk Management, Facilities Management, Order Fulfillment, Customer Service, and Quality Assurance. Working within and across departments students engage in tasks such as creating solutions, maintaining live cultures, managing inventory, and distributing materials. The balance between entry level jobs and management positions that require more extensive scientific and technical expertise also reflect the biotechnology industry. Students can move from team to team across multiple semesters to acquire a well-rounded skill set.
Tech Site courses were offered to students through a district-level Regional Occupational Program (ROP) designed to provide career skills to students through community partnerships ( Mitchell, Adler, & Walker, 2011 ). Though implemented as a technology education course, the Tech Site's biotechnology focus is also appropriate for science and engineering courses. The NGSS Scientific and Engineering Practices embedded in the experiences include Asking Questions, Developing and Using Models, Planning and Carrying out Investigations, Analyzing and Interpreting Data, and Constructing Explanations and Designing Solutions. The science content largely focuses on Disciplinary Core Ideas within Life Sciences (LS1, LS2, LS3, and LS4) as well as Engineering, Technology, and Applications of Science (ETS2). Working collaboratively to manage kit production and delivery reiterates several additional NGSS ideas, including Connections to Engineering, Technology, and Applications of Science, the Nature of Science, and Science is a Human Endeavor.
Evaluation of the Tech Sites began in 2008 using a pre-post survey that was administered to students at the beginning and end of the course. In later years, student academic data were also gathered. The Tech Site evaluation is best categorized as a developmental evaluation, an approach that collects data to guide adaptation to the emergent and dynamic environments that occur during the development of projects, programs, and/or policy reforms ( Patton, 2011 ). The Tech Site evaluation is considered developmental because the data were collected as the project evolved in response to changes in the overall ScienceBridge program. For example, ScienceBridge created new biotech labs each year, thereby expanding the skill set required of Tech Site students. The individual Tech Sites also developed in nuanced ways based on the culture of both the individual school and district. The evaluation was also conducted at the crossroads of a policy change ( [NRC], 2012 ), and thus the data have the potential to serve as a developmental evaluation of indicators and methods that might prove useful to those interested in implementing biotechnology courses in response to the NGSS. This exploratory study investigates two questions:
- What self-report measures can be used to document success in a high school biotechnology course?
- What is the relation between self-report measures and more traditional forms of assessment, and can self-report measures be used to predict course success?
Method
Participants
Students from three high schools in two urban districts participated in the Tech Sites from 2010-2012. All students participated in the evaluation each year. In total, Tech Sites served 183 students over the course of this two year period; 178 participated in the evaluation (97%). Demographic characteristics are presented in Table 1. There were more females than males and over half of the students identified as Hispanic.
| n | % | |
|---|---|---|
| Gender | ||
| Male | 76 | 42.7 |
| Female | 102 | 57.3 |
| Missing | 0 | 0 |
| Grade | ||
| 10 th | 49 | 57.3 |
| 11 th | 55 | 30.9 |
| 12 th | 68 | 38.2 |
| Missing | 6 | 3.4 |
| Ethnicity | ||
| African American | 14 | 7.9 |
| American Indian | 2 | 1.1 |
| Asian | 51 | 28.7 |
| Hispanic | 99 | 55.6 |
| Native Hawaiian/Pacific Islander | 11 | 6.2 |
| White | 30 | 16.9 |
| Missing | 0 | 0 |
Measures
Pre- and post-surveys were administered to students online at the beginning and end of each term, respectively. One Tech Site allowed students to enroll for multiple terms; for these students, their initial pre data were used in comparison to post data from their final term of participation. Three survey constructs were of interest for the current study: students' attitudes toward science and both their self-reported awareness of and proficiency with biotechnology skills. Attitude was measured via a battery of survey items that differed each year (see the Appendix for survey scales and items). In 2010-2011, the science items from the STEM Semantics Survey were used (modified from Tyler-Wood, Knezek & Christensen, 2010 ). The battery consisted of five adjective pairs. Each pair included one negative and one positive adjective and a series of six open boxes that connected the two terms. Students were asked to choose the option between the adjective pair that best reflected their opinion of science. In 2011-2012 the Math Science Interest Scale ( Fouad & Smith, 1996 ) was used to measure students' interest in 20 specific science or math related activities by asking them to rate their interest on a five-point Likert scale: Strongly dislike, Dislike, Somewhat like, Like, Strongly like. To equate the different attitude ratings scales used, students' average scores on the five-point scale were multiplied by 6/5.
To measure students' awareness of biotechnology skills at the beginning of the Tech Site course, students rated a list of activities using three options: I had never heard of this skill before I started the Tech Site course; I had heard of this skill before starting the Tech Site course, but I had never used it myself; I had used this skill before I started the Tech Site course. Fifteen specific skills were rated in 2010-2011; six new items were added to the list in 2011-2012 to reflect new areas of focus within the program, bringing the total to 21 items. Using a different scale, students rated their proficiency with these skills at the beginning and end of each term: I cannot perform this skill; I can perform this skill but only with assistance; I can perform this skill well enough to do it on my own; I can perform this skill pretty well and could teach it to a friend if I had time to review; I can perform this skill very well and could teach it to a friend right now.
Three academic measures were used in the study. Students' scores on the California High School Exit Exam (CAHSEE) were used as a measure of baseline English/Language Arts (ELA) and Math ability (for reliability and validity information see California Department of Education, 2012 ). This state-based exam was created to ensure that students graduate with basic skills in each discipline. Students take the exam for the first time in 10th grade and then again in subsequent years if they do not achieve a passing score. For the purposes of the current study, students' final scores in both ELA and Math were used.
The second academic measure was students' final course grade, which included classroom participation in biotech production activities as well as scores on written and practical exams. The third academic measure was the score on an articulation exam offered by San Diego Miramar College's biotechnology program. Two of the Tech Sites were part of a college program that allows students to earn college course credit for their high school biotechnology class. All students with a course grade of B or higher in an approved class were eligible to take the written exam and those who pass the exam receive four units of college credit. The exam measures general biology/biotechnology content knowledge, understanding of computational/data analysis content, and understanding of important biotechnology techniques.
Results
As shown in Table 2, internal consistency estimates of reliability were computed for each construct on the student survey. The values for Cronbach's alpha ranged from .84 to .96 across constructs, indicating satisfactory reliability for each variable of interest. Based on this consistency, students' average score across items was used for further analysis of each construct (i.e., Attitude, Awareness, and Skill).
| n | # items | α | |
|---|---|---|---|
| Attitude | |||
| 2010-2011 Pre | 85 | 5 | .84 |
| 2010-2011 Post | 70 | 5 | .91 |
| 2011-2012 Pre | 99 | 20 | .91 |
| 2011-2012 Post | 71 | 20 | .92 |
| Awareness | |||
| 2010-2011 Pre | 79 | 15 | .91 |
| 2011-2012 Pre | 90 | 21 | .90 |
| Skill | |||
| 2010-2011 Pre | 74 | 15 | .94 |
| 2010-2011 Post | 73 | 15 | .93 |
| 2011-2012 Pre | 95 | 21 | .93 |
| 2011-2012 Post | 72 | 21 | .96 |
Paired-samples t tests were conducted to evaluate whether students' science attitudes and biotechnology skills improved after the program. As shown in Table 3(next page), results indicate that attitudes remained constant before and after participating in the Tech Site. Students' biotechnology skills improved significantly after the program.
| M | SD | df | t | p | |
|---|---|---|---|---|---|
| Science Attitude (out of 6) | |||||
| Pretest | 4.43 | .79 | 101 | -.24 | .81 |
| Posttest | 4.45 | 1.01 | |||
| Biotechnology Skill (out of | |||||
| Pretest | 2.49 | .86 | 93 | -11.72 | <.001 |
| Posttest | 3.69 | .90 |
Correlation coefficients were used to investigate the relation among key variables. Using the Bonferroni approach to control for Type I error across the 36 correlations, a p-value equal to or less than .001 (.05/36 = .0014) was required for significance. The results of the correlational analyses presented in Table 4 (next page) show that 13 out of 36 correlations were statistically significant. Moderate to high positive relations were found between all academic measures. There was no consistent pattern in how attitude related to the other variables. Skill at the end of the course was positively related to a number of variables, including a moderate relation to course grade and a high relation to exam score.
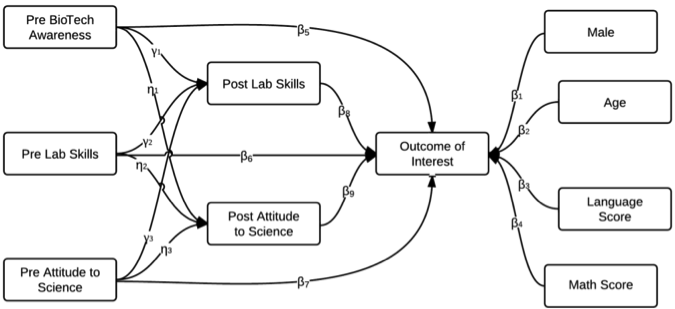
Two path analyses were also conducted, one for course grade and the other for exam score. Path model analyses were run using Mplus, Version 7. The following equations and Figure 1 describe the initial path model. Full information maximum likelihood estimators of parameters were used.
| 1 | 2 | 3 | 4 | 5 | 6 | 7 | 8 | ||
|---|---|---|---|---|---|---|---|---|---|
| Note: Highlighted cells are those that achieved statistical significance with the Bonferroni correction for Type I error. | |||||||||
| 1 | ELA Score | ||||||||
| 2 | Math Score | .50 | |||||||
| 3 | Math Score | -.06 | -.02 | ||||||
| 4 | Pre Attitude | .24 | .07 | .17 | |||||
| 5 | Pre Skill | .31 | .06 | .21 | .49 | ||||
| 6 | Post attitude | -.11 | -.08 | .60 | .14 | .10 | |||
| 7 | Post Skill | .16 | .20 | .16 | .38 | .36 | .31 | ||
| 8 | Course Grade | .35 | .28 | .08 | .21 | .18 | .26 | .31 | |
| 9 | Math Score | .46 | .55 | .21 | .37 | .30 | .19 | .50 | .32 |
y i =β 0 + β 1 Gender i + β 2 Age i + β 3 Language i + β 4 Math i + β 5 AwarePre i + β 6 SkilPre i + β 7 AttdPre i + β 8 SkilPost i + β 9 AttdPost i + ε i
SkilPost i = γ 0 + γ 1 AwarePre i + γ 2 SkilPre i + γ 3 AttdPre i + ξ i
AttdPost i = η 0 + η 1 AwarePre i + η 2 SkilPre i + η 3 AttdPre i + v i
Model fit statistics indicate a good fit of the model to the course grade data. RMSEA = 0.031, CFI = 0.986, and SRMR= 0.032. Direct effects are presented in Table 5 (next page) and indirect effects are presented in Table 6 (next page). Students' ELA and Math scores and post attitudes had a statistically significant association with their course grade (β 3 =0.091,p<.05; β 4 =0.065,p<.05; β 9 =3.536,p<.001). Post skills were significantly predicted by students' pre awareness (γ 1 =0.386,p<.01) and pre skills (γ 2 =0.244,p<.01). Post attitude was significantly predicted by pre attitude (η 3 =0.648,p<.001). Further, pre attitudes had a significant indirect effect on course grade through post attitudes (η 3 xβ 9 =2.291,p<.01).
| Estimate | S.E. | Asymptotic Z test | |
|---|---|---|---|
| +: p < .1; *: p < .05; **: p < .01; ***: p < .001 | |||
| Course Grade on | |||
| Male(β 1 ) | -2.637 | 1.484 | -1.777+ |
| Age(β 2 ) | 1.157 | .0735 | 1.574 |
| ELA Score(β 3 ) | 0.091 | 0.037 | 2.445* |
| Math Score(β 4 ) | 0.065 | 0.033 | 2.012* |
| Pre Awareness(β 5 ) | 1.533 | 2.01 | 0.763 |
| Pre Skill(β 6 ) | 0.422 | 1.141 | 0.37 |
| Pre Attitude(β 7 ) | -2.108 | 1.141 | -1.848+ |
| Post Skill(β 8 ) | 1.252 | 1.077 | 1.162 |
| Post Attitude(β 9 ) | 3.536 | 0.999 | 3.539*** |
| Post Skill on | |||
| Pre Awareness(γ 1 ) | 0.386 | 0.139 | 2.767** |
| Pre Skill(γ 2 ) | 0.244 | 0.077 | 3.151** |
| Pre Attitude(γ 3 ) | 0.066 | 0.063 | 1.046 |
| Post Attitude on | |||
| Pre Awareness(η 1 ) | 0.063 | 0.139 | 0.462 |
| Pre Skill(η 2 ) | -0.038 | 0.077 | -0.495 |
| Pre Attitude(η 3 ) | 0.648 | 0.061 | 10.611*** |
| Estimate | S.E. | Asymptotic Z test | |
|---|---|---|---|
| +: p < .1; *: p < .05; **: p < .01; ***: p < .001 | |||
| Course Grade on | |||
| Pre Awareness through Post Skill (γ 1 x β 8 ) | 0.483 | 0.455 | 1.085 |
| Pre Awareness through Post Attitude (η 1 x β 9 ) | 0.223 | 0.486 | 0.459 |
| Pre Skill through Post Skill (γ 2 x β 8 ) | 0.306 | 0.283 | 1.08 |
| Pre Skill through Post Attitude (η 2 x β 9 ) | -0.135 | 0.276 | -0.49 |
| Pre Attitude through Post Skill (γ 3 x β 8 ) | 0.082 | 0.108 | 0.762 |
| Pre Attitude through Post Attitude (η 3 x β 9 ) | 20291 | 0.685 | 3.345** |
Model fit statistics also indicated a good fit of the model to the exam score outcome. RMSEA=0.021, CFI=0.993, and SRMR=0.033. Table 7 presents the direct effects and Table 8 (next page) presents the indirect effects. Students' Math score and post skills had statistically significant associations with their exam score (β 4 =0.263,p<.01; β 8 =5.493,p<.05). Post skills were significantly predicted by pre-awareness (γ 1 =0.415,p<.01) and pre skills (γ 2 =0.236,p<.01). Post attitude was significantly predicted by pre attitude (η 3 =0.647,p<.001). None of the pre measures had a significant indirect effect on exam score through post attitude or skill.
| Estimate | S.E. | Asymptotic Z test | |
|---|---|---|---|
| +: p < .1; *: p < .05; **: p < .01; ***: p < .001 | |||
| Exam Score on | |||
| Male(β 1 ) | -3.78 | 3.424 | -1.104 |
| Age(β 2 ) | 3.796 | 2.432 | 1.561 |
| ELA Score(β 3 ) | 0.044 | 0.091 | 0.481 |
| Math Score(β 4 ) | 0.263 | 0.078 | 3.365** |
| Pre Awareness(β 5 ) | 7.526 | 4.404 | 1.709+ |
| Pre Skill(β 6 ) | 2.65 | 2.395 | 1.107 |
| Pre Attitude(β 7 ) | 4.372 | 3.31 | -1.321 |
| Post Skill(β 8 ) | 5.493 | 2.289 | 2.399* |
| Post Attitude(β 9 ) | 4.738 | 2.468 | 1.92+ |
| Post Skill on | 0.415 | 0.138 | 3.016** |
| Pre Awareness(γ 1 ) | 0.236 | 0.077 | 3.066** |
| Pre Skill(γ 2 ) | 0.056 | 0.063 | 0.888 |
| Pre Attitude(γ 3 ) | |||
| Post Attitude on | |||
| Pre Awareness(η 1 ) | 0.076 | 0.136 | 0.56 |
| Pre Skill(η 2 ) | 0.045 | 0.077 | -0.586 |
| Pre Attitude(η 3 ) | 0.647 | 0.061 | 10.62*** |
| Estimate | S.E. | Asymptotic Z test | |
|---|---|---|---|
| +: p < .1; *: p < .05; **: p < .01; ***: p < .001 | |||
| Exam Score on | 2.281 | 1.238 | 1.842+ |
| Pre Awareness through Post Skill (γ 1 x β 8 ) | 0.361 | 0.671 | 0.538 |
| Pre Awareness through Post Attitude (η 1 x β 9 ) | 1.294 | 0.677 | 1.912+ |
| Pre Skill through Post Skill (γ 2 x β 8 ) | -0.213 | 0.385 | -0.554 |
| Pre Skill through Post Attitude (η 2 x β 9 ) | -0.213 | 0.385 | -0.554 |
| Pre Attitude through Post Skill (γ 3 x β 8 ) | 0.306 | 0.365 | 0.838 |
| Pre Attitude through Post Attitude (η 3 x β 9 ) | 3.067 | 1.63 | 1.881+ |
Conclusions
This study was part of a developmental evaluation of the UCSD ScienceBridge Tech Site program and explored the relationships among self-report and objective academic measures. As with any exploratory research, the purpose of the current study was to understand a phenomenon in greater detail with the hope of identifying hypotheses that can be explored in future research.
Documenting pre-post change on key variables of interest is a common method of measuring impact in program evaluation studies, and this method was used throughout the first years of the Tech Site evaluation. Course success in this context was defined as a statistically significant increase in students' scores after the program. The current analysis indicates that the UCSD Tech Sites were effective at improving the biotechnology skills of students, while science attitudes remained unchanged.
Initial studies of high school biotechnology courses have suggested that student motivation and knowledge are impacted positively and that impact is most pronounced within the context of active learning strategies ( Bigler & Hanegan, 2011 ; Powell & Stiller, 2005 ; Santucci et al., 2004 ). The current study is the first of its kind to explore how student characteristics and biotechnology course outcomes relate to one another. Results indicated that students' general attitudes about science and their overall math skills predicted success across a number of measures, including both self-reported skill ratings as well as the more traditional measures of course grade and exam score. Further, the results demonstrate the association between skill, as measured through self-reported proficiency ratings, and achievement on an articulation exam. This link was particularly important for the program given that it was operated within the context of an ROP; it documented the relation between skills students learned in the course and the potential next steps in their educational and/or technical careers.
Implications
The results from the current study offer additional points of both intervention and evaluation for educators implementing biotechnology courses. The association between attitudes and knowledge in the literature includes a moderate correlation found among Israeli high school graduates ( Pe'er, Goldman, & Yavetz, 2007 ), as well as a weak correlation found for secondary students from five European countries ( Dijkstra & Goedhard, 2012 ). The results from the current study add to this literature by demonstrating that science attitudes may serve as a constant in relation to students' success in science courses. Science attitudes were predictive of academic outcomes despite the fact that there were not changes in attitude scores from pre to post. Ayendiz and Kaya (2012) concluded their study of Turkish high school students' science attitudes by stating that "classroom instruction has a significant impact on students' attitudes toward science (p. 44)." It is important to note that each of these international studies positioned their results within the context of either the educational and/or cultural system being studied. Future research should investigate the relation between attitude, attitude change, and academic outcomes among American students. Differences in how these variables interact in the context of biotechnology, engineering, and science courses should also be investigated. Should this research confirm that attitude plays a role in students' academic outcomes it would provide an additional leverage point for educators to utilize as they work to impact student learning.
The results from the current study also have implications for how student learning is measured. Norton (2004) suggested that teachers use formative assessment as a tool to allow students to collaborate with others and express ideas in their own unique and creative ways. The results from this study indicate that self-reported proficiency measures might serve as an accurate formative measure when data are being collected on specific skills. Students' proficiency ratings increased across the life of the Tech Site, were correlated from the beginning to the end of the course, and post proficiency ratings also correlated with both course grade and exam scores. The proficiency ratings conducted as part of this evaluation are also practical for today's biotechnology classroom; they were quick to administer and required no additional materials or resources.
It is somewhat surprising that students' self-assessments were also predictive of exam scores. As researchers begin to focus on ways to measure students' proficiency with science and engineering practice in relation to the NGSS, it may be useful to consider whether and how self-assessment of these skills provides a valuable measure of student learning across disciplines. Future research should validate the utility of this idea by comparing students' self-reported skills with those measured through objective performance-based assessments such as practical exams. Proficiency skill ratings may prove a valuable response to the challenges associated with assessing lab-based, problem-based, and hands-on learning experiences ( Savin-Baden, 2004 ; Steck et al., 2012 ) at a time when these learning experiences are likely to become more rather than less common.
The topic of biotechnology has been a new source of study within recent years as educators and researchers grapple with ways to achieve and measure student learning in relation to this modern science. The thrust of the NGSS aligns nicely with the topic of biotechnology and provides a host of new challenges related to establishing integrated curricular materials and assessments that move beyond content to measure science and engineering practice. Whether biotechnology courses continue to be implemented within the context of technical programs such as ROP, as engineering programs, or by science educators trying to align with the NGSS, the results from this exploratory study document student characteristics to keep in mind as educators and policymakers consider whether and how to incorporate biotechnology into high school curricula. This study also highlights potential measurement strategies for educators and researchers to use to understand student learning in relation to this content.
Karen Peterman ( karenpetermanphd@gmail.com ) is President of Karen Peterman Consulting Company, Durham, North Carolina. Yi Pan (y i.pan@unc.edu ) is a statistician at Frank Porter Graham Child Development Center, University of North Carolina at Chapel Hill. Jane Robertson ( janer009@gmail.com ) is Assistant Professor of Practice in the Department of Statistics, Virginia Tech. Shelley Glenn Lee ( sglenn@sea.ucsd.edu ) is Academic Coordinator, Skaggs School of Pharmacy and Pharmaceutical Sciences, University of California San Diego.
References
Ayendiz, M. & Kaya, E. (2012). Factors impacting Turkish students' attitudes toward science and their academic performance in science. Journal of Turkish Science Education, 9 (2), 25-48. Retrieved from http://www.tused.org/internet/tused/archive/v9/i2/text/tusedv9i2s3.pdf
Bigler, A. M. & Hanegan, N. L. (2011). Student content knowledge increases after participation in a hands-on biotechnology intervention. Journal of Science Education & Technology, 20 (3), 246-257. doi: 10.1007/s10956-010-9250-7
Bybee, R.W. (2011). Scientific and engineering practices in K-12 classrooms. Science Teacher, 78 , 34-40. doi: 10.1525/abt.2012.74.8.3
Bybee, R.W. (2012). The next generation of science standards: Implications for biology education. The American Biology Teacher, 74 (8), 542-549. doi: http://dx.doi.org/10.1525/abt.2012.74.8.3
California Department of Education (2012). California High School Exit Examination Technical Report. Retrieved from Educational Testing Services website: http://www.ets.org/s/cahsee/pdf/July_2010%E2%80%93May_2011_Technical_Report.pdf
Dawson, V. & Soames, C. (2006). The effect of biotechnology education in Australian high school students' understandings and attitudes about biotechnology processes, Research in Science & Technological Education, 24 (2), 183-198. doi: 10.1080/02635140600811569
Dijkstra, E.M. & Goedhart, M.J. (2012). Development and validation of the ACSI: Measuring students' science attitudes, pro-environmental behavior, climate change attitudes and knowledge. Environmental Education Research, 18 (6), 733-749. doi:10.1080/13504622.2012.662213
Fouad, N.A. & Smith. P.L. (1996). A test of a social-cognitive model for middle school students: Math and science. Journal of Counseling Psychology, 43 (3), 338-346. doi: 10.1037/0022-0167.43.3.338
France, B. (2007). Location, location, location: Positioning biotechnology education for the 21st century. Studies in Science Education (43) , 88-122. doi: 10.1080/03057260708560228
Gabric, K. M., Hovance, C. Z., Comstock, S. L. & Harhisch, D. L. (2005). Scientists in their own classroom: The use of Type II technology in the science classroom. Computers in the Schools, 22 (3/4), 77-91. doi: 10.1300/J025v22n03_07
Harms, U. (2002). Biotechnology education in schools. Electronic Journal of Biotechnology, 5 (3): 205-211. doi: 10.2225/vol5-issue3-fulltext-i03
Marchaim, U. (2001). High-school student research at Migal science institute in Israel. Journal of Biological Education, 35 (4), 178-182. doi: 10.1080/00219266.2001.9655774
Mitchell, D.E., Adler, L., & Walker, C.L. (2011). California career technical education: 2010 longitudinal study technical report . Riverside, CA: University of California School Improvement Research Group.
Mueller, A.L., Knoblock, N.A., & Orvis, K.S. (2009, May). The effects of an active-learning biotechnology and genomics unit on high school students' knowledge, motivation, and learning experiences . Paper presented at the American Association for Agricultural Education Research, Salt Lake City, UT. Retrieved from http://www.aaaeonline.org/uploads/allconferences/AAAE_conf_2009/papers/19.pdf
National Research Council. (2012). A Framework for K-12 Science Education: Practices, Crosscutting Concepts, and Core Ideas . Committee on a Conceptual Framework for the New K-12 Science Education Standards. Washington, DC: National Academies Press.
National Science Board. (2007). National action plan for addressing the critical needs of the U.S. science, technology, engineering and mathematics education system . Arlington, VA: National Science Foundation.
National Science Teachers Association (1982). Science-technology-society: Science education for the 1980s (NSTA Position Statement). Washington D.C.: National Science Teachers Association.
Next Generation Science Standards (2013). Retrieved from http://www.nextgenscience.org/
Norton, L. (2004). Using assessment criteria as learning criteria: A case study in psychology. Assessment and Evaluation in Higher Education, 29 (6), 687-702. doi: 10.1080/0260293042000227236.
Patton, M.Q. (2011). Developmental evaluation: Applying complexity concepts to enhance innovation and use . New York, NY: Guilford Press.
Pe'er, S., Goldman, D. & Yavetz, B. (2007). Environmental literacy in teacher training: Attitudes, knowledge, and environmental behavior of beginning students. The Journal of Environmental Education, 39 (1), 45-59. doi: 10.3200/JOEE.39.1.45-59
Powell, K. & Stiller, J. (2005). What's living in your world? Building research partnerships for inquiry-based learning. The Science Teacher, 72 (9), 20-25. Retrieved from http://learningcenter.nsta.org/files/tst0512_20.pdf
Santucci, A., Mini, R., Ferro, E., Martelli, P., & Trabalzini, L. (2004). Innovative tools for scientific and technological education in Italian secondary schools. Biochemistry and Molecular Biology Education, 32 (2), 78-83. doi: 10.1002/bmb.2004.494032020317
Savin-Baden, M. (2004). Understanding the impact of assessment on students in problem-based learning. Innovations in Education and Teaching International, 41 (2), 223-233. doi: 10.1080/1470329042000208729.
Sneider, C. (2012). Core ideas of engineering and technology: Understanding A Framework for K-12 Science Education. Science and Children, 49 (5), 10-14. doi: http://dx.doi.org/10.1525/abt.2012.74.8.3
Steck, T.R., DiBiase, W., Wang, C., & Boukhtiarov, A. (2012). The use of open-ended problem-based learning scenarios in an interdisciplinary biotechnology class: Evaluation of a problem-based learning course across three years. Journal of Microbiology & Biology Education, 13 (1), 2-10. doi: http://dx.doi.org/10.1128/jmbe.v13i1.389.
Thomas, J.W., Bol, L., Warkentin, R.W., Wilson, M., Strage, A., & Rohwer, W.D. Jr. (1993). Interrelationships among students' study activities, self-concept of academic ability, and achievement as a function of characteristics of high-school biology courses. Applied Cognitive Psychology, 7 (6), 499-532. doi: 10.1002/acp.2350070605
United States Department of Labor (2008). High growth industry profile: Biotechnology. Retrieved from http://www.doleta.gov/brg/indprof/Biotech_profile.cfm .
Tyler-Wood, T., Knezek, G., Christensen, R. (2010). Instruments for assessing interest in STEM content and careers. Journal of Technology and Teacher Education, 18 (2), 341-363. Retrieved from http://www.editlib.org/p/32311
Wells, J.G. (1994). Establishing a taxonomic structure for the study of biotechnology in secondary school technology education. Journal of Technology Education, 6 (1), 58-75. Retrieved from http://scholar.lib.vt.edu/ejournals/JTE/v6n1/wells.jte-v6n1.html
Zeller, M.F. (1994). Biotechnology in the high school biology curriculum: The future is here! The American Biology Teacher, 56 (8), 460-464. doi: 10.2307/4449889
Appendix
Modified item from
Tyler-Wood, Knezek & Christensen (2010)
In my opinion, science is:
| Unplesant | Plesant | ||||||
| Fresh | Suffocating | ||||||
| Dull | Exciting | ||||||
| Likable | Unlikable | ||||||
| Uncomfortable | Comfortable |
Math Science Interest Scale ( Fouad & Smith, 1996 ; Strongly Dislike, Dislike, Somewhat Like, Like, Strongly Like)
Visiting a Science Museum
Listening to a famous scientist talk
Solving computer problems
Solving math puzzles
Touring a science lab
Joining a science club
Creating new technology
Using a calculator
Working with plants and animals
Taking classes in science
Working in a medical lab
Reading about science discoveries
Participating in a science fair
Working in a science laboratory
Learning about energy and electricity
Working as an astronomer
Taking classes in math
Working with a chemistry set
Inventing
Watching a science program on TV
Awareness and Proficiency Ratings of Biotechnology Skills
Awareness Scale: I had never heard of this skill before I started the Tech Site course, I had heard of this skill before starting the Tech Site course, but I had never used it myself, I had used this skill before I started the Tech Site course
Proficiency Scale: I cannot perform this skill, I can perform this skill but only with assistance, I can perform this skill well enough to do it on my own, I can perform this skill and could teach it to a friend if I had time to review, I can perform this skill very well and could teach it to a friend right now
Pipetting
Micropipetting
Making solutions
Diluting solutions
Making media (agar)
Pouring plates
Streaking plates
Performing transformations
Calculating concentrations
Performing sterile techniques
Quality assurance testing
Handling microorganisms
Using a microscope
Using SOPs (Standard Operating Procedures)
Measuring pH
Using the metric system
Making a graph
Interpreting a graph
Using a centrifuge
Protein purification
Observing enzymatic activity