This article summarizes findings from a recent study of 451 Career Technical Education (CTE) and non-CTE students as drawn from seven high schools supported by an area career technical center. One aspect of this study examined each group’s academic standing and their socioeconomic status, including the household living arrangements and the family income level present in those households.
The marketing of career technical education (CTE) continues to be a significant role played by CTE educators. Students must elect to take CTE courses and thus be convinced of their merits within a society that increasingly emphasizes academics and the value of a college education. Significant marketing efforts have occurred in the recent past to help all students realize that CTE programming is a very viable path to work as well as to higher education ( Ries, 1999 ). Yet, as with any good marketing efforts, the profile of potential customers is essential so messages can be tailored to them. Understanding the type of students who typically enroll in career and technical education can assist CTE educators in targeting specific groups of potential students, and in developing strategies to expand the scope of influence of CTE into other student populations.
So what do we currently know about such students? In regard to academic standing , vocational education has often been considered the track for low-achieving, non college-bound students. For example, the National Center for Education Statistics (NCES), between 1982-1994, found that students with lower GPAs generally completed more vocational credits. More recently, Levesque and Hudson (2003) found that although CTE attempts to appeal to a wide range of academic performers, those students from the highest academic achievement groups were less likely to be in a CTE concentration. Some special CTE college-preparatory schools such as Harford Tech ( Bowden, 1998 ) and Chicago Ag ( Vo, 1997 ) do draw from a broad mix of the achievement spectrum. These types of schools, however, may be quite different than a more typical area CTE center.
In reference to income level , Campbell (1986) found that a higher proportion of low socioeconomic students are enrolled in CTE. Levesque and Hudson (2003) , in a study of 1998 high school graduates across the nation, also found that those identified as being in a lower economic category were found in higher concentrations in CTE than their non-CTE counterparts. No detailed explanations were offered by these authors as to why that dynamic exists, but others note that students without the financial means to pursue more advanced postsecondary training may be directed toward CTE in order to gain marketable work-related skills ( Gaunt, 2006 ).
The National Center for Education Statistics (NCES) has reported social living arrangement data for high school sophomores nationwide. Their data indicated that such students living with both parents, either biological or adoptive, comprise approximately 57 percent of the population. Twenty-two percent live in a single-parent household, while 17 percent live with their mother or father and a stepparent. Four percent were found to live in a variety of other arrangements ( NCES, 2002 ). However, NCES does not break down such data to look at CTE compared to non-CTE students, nor could any specific studies on the household make-up of CTE students be found. Thus, we currently do not know whether students in CTE reflect the general population of students with regard to their living arrangements (i.e., living with both parents, in single parent households, with other adults, and so forth), or whether they are found in greater concentrations in certain categories.
Based upon these previous research studies, one could conclude that a typical CTE student would have lower grades and come from a lower-income family when compared to non-CTE students. No real information regarding issues that may account for such lower household income exists (e.g., household living arrangements). Yet, according to Kerka (2000) , “opportunities for challenging careers and good salaries are changing the demographics of today’s CTE students” (p. 1). This suggests that the type of students being served in CTE programs today may be changing, yet most CTE programs do not have current profiles of their students.
To this end, we undertook a study involving a group of CTE and non-CTE high school students in Michigan. One aspect of this study examined the academic standing and socioeconomic status (e.g., household makeup and income level) of such students.
Career and technical education is delivered in many ways throughout the State of Michigan, from comprehensive and career technical high schools to area career technical centers. The setting for this study was an area career technical center located in the upper part of Michigan’s Lower Peninsula. This center is typical in many respects to other average-sized area CTE centers throughout the state, serving students in that region since 1971. Students from seven local districts enroll in 13 career technical programs available at the center (with most beginning their junior year with plans to complete a two-year program by the end of their senior year).
In this study, a survey of all high school seniors (both those attending CTE programs and those not) from the seven high schools that feed into this area center was conducted. The survey instrument we created for the study was pilot-tested with two groups of high school juniors from the same schools. The final survey was administered to all high school seniors in attendance on a given day within their Government class. The teacher for each Government class was provided with a script to read as they distributed the survey. Following the process approved by a university human subjects review board, the surveys were not coded in any way, and thus the responses were completely anonymous.
Overall, 451 seniors responded to the survey, of which 126 were enrolled in a CTE program at the area center, and 325 who were not participating in CTE programs. The survey gathered information on students’ academic standing and socioeconomic status and captured the perceptions of students toward the area center, as well as what people or other factors influenced their decision to attend or not.
This study resulted in numerous findings of interest to the broader CTE world, including a profile of students, as well as perceptions of CTE and non-CTE students, and factors that influenced their curriculum decisions ( Gaunt, 2006 ; Gaunt & Bierlein Palmer, 2005 ). Given limits on the length of this article, only pieces associated with the current profile are reported here.
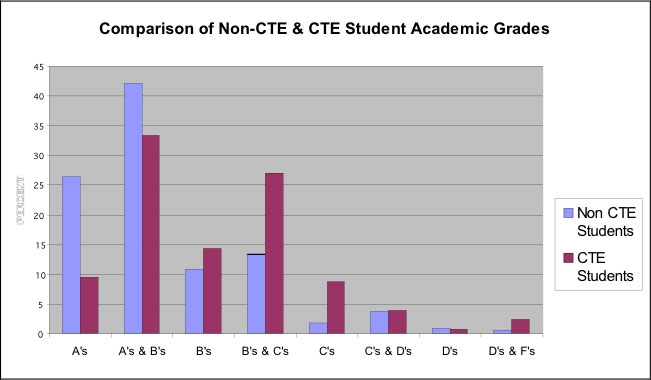
Students were asked to indicate what grades they usually receive in school. Students responded along an eight-point scale, ranging from Mostly A’s, Mostly A’s and B’s, Mostly B’s, Mostly B’s and C’s, Mostly C’s, Mostly C’s and D’s, Mostly D’s, to Mostly D’s and F’s. Frequencies and percentages were calculated for non-CTE and CTE students in each grade classification, with Figure 1 depicting these percentages.
In the A’s classification, 26.5% of the non-CTE group, and 9.5% of the CTE group were represented. In the A’s & B’s classification, 42.2% of the non-CTE group, and 33.3% of the CTE group were represented. In the B’s classification, 10.8% of the non-CTE group, and 14.3% of the CTE group were represented. Twice the percentage was represented by the CTE group in the B’s & C’s classification, at 27%, as compared to 13.5% for the non-CTE group. As the grade classifications become lower, the greater percentage is most often found in the CTE group, except in the D’s classification where 0.9% of the non-CTE group is represented, as compared to 0.8% of the CTE group.
Overall, the median non-CTE grade is in the “A’s & B’s” classification and the median CTE grade is in the “B’s” classification. Thus, the grades of non-CTE students are higher overall than those of CTE students by approximately one grade classification. The Mann-Whitney test indicated that there was a significant difference (p <.0001) between non-CTE and CTE students with respect to academic grades.
This finding is consistent with previous research by Levesque and Hudson (2003) that indicated that students from the highest academic achievement groups were less likely to be in a CTE concentration. Other researchers also identified that students who perform lower academically were more likely to concentrate in CTE ( National Center for Education Statistics, 2002 ).
Students were asked to select which statement best described their family situation in reference to income. Options included: (1) your family has a hard time getting enough money for food, clothing, and basic living costs; (2) your family has just enough money for food, clothing, and basic living costs; (3) your family has a few problems buying what your family needs; and (4) your family has no problems buying what your family needs and is able to buy special things. Frequencies and percentages were calculated for non-CTE and CTE students in each economic situation classification, with Figure 2 showing a comparison of these data.
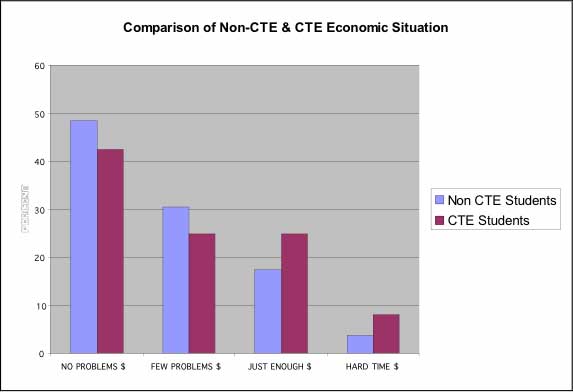
In the no financial problems classification, 48.5% of the non-CTE group, and 42.4% of the CTE group were represented. In the few financial problems classification, 30.4% of the non-CTE group, and 24.8% of the CTE group were represented. In the just enough to get by classification, 17.4% of the non-CTE group, and 24.8% of the CTE group were represented. In the hard time getting by classification, 3.7% of the non-CTE group, and 8.0% of the CTE group were represented.
The Mann-Whitney test indicated that there was a significant difference (p <.047) between non-CTE and CTE students with respect to their economic situation. This means that the financial situation of non-CTE students was slightly better overall than that of CTE students. Stated conversely, CTE students are more disadvantaged financially. The results of this study support what has been previously found in the research regarding the economic status of CTE students.
Students were asked to identify their social living arrangements, by indicating who they live with, including: (1) both your mother and your father; (2) your mother and a stepfather; (3) your father and a stepmother; (4) with father only; (5) with mother only; (6) your mother some of the time and your father some of the time; (7) with other relatives; and (8) with other adults. Frequencies and percentages were calculated for non- CTE and CTE students in each social living arrangement classification, with Figure 3 showing a comparison.
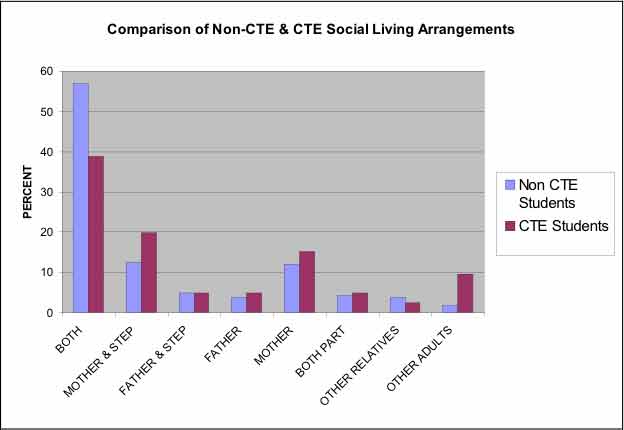
In the mother & father classification, 57.0% of the non-CTE group, and 38.9% of the CTE group were represented. In the mother & stepfather classification, 12.6% of the non-CTE group, and 19.8% of the CTE group were represented. Only 3% separated the groups in the mother only classification, at 12.0% for the non-CTE group and 15.0% for the CTE group. The other classifications were much closer between the groups, within 1.3%, except in the other adult classification. In that classification only 1.9% of the non- CTE group were represented, as opposed to 9.5% of the CTE group
Further analysis via Chi-Square revealed a statistically significant difference between CTE and non-CTE students with regard to their social living arrangements. Overall, CTE students live with both parents less often than non-CTE students, and are more commonly found in living arrangements without either parent present.
Unlike the previous findings related to income and grades, no previous research or data profiling the social living arrangements of CTE students could be found. Instead, we compared national data collected on general population of students ( NCES, 2002 ) to that found in our study. Although our categories are not defined exactly the same as those in the federal NCES study, they are very similar (as depicted in Table 1). One can note that the data collected from the non-CTE students in this study are quite close to that collected for the national sample of students, while results for the non-CTE students are very different.
Table 1|
NCES Study
All High School Sophomores |
Gaunt/ Bierlein Palmer Study
Non-CTE Students CTE Students |
|
|---|---|---|
| Both Parents | Mother & Father | |
| 57% | 57.0% | 38.9% |
| Single Parent | Mother Only, Father Only, Mother Some or Father Some | |
| 22% | 20.0% | 24.6% |
| Mother or Father and a Stepparent | Mother & Stepfather and Father & Stepmother | |
| 17% | 17.5% | 24.6% |
| Other Arrangements | Other Relatives and Other Adults | |
| 4% | 5.5% | 11.9% |
NCES reports that 57% of all students live with both parents and this study found the identical percent for non-CTE students (57%). CTE students, in contrast, live with their Mother and Father in only 38.9% of the cases. The NCES study reports that 22% of all students live in a single-parent household, while this total for non-CTE students in this study is 20% (compared to 24.6% for CTE students). NCES reports that 17% of all students live with their mother or father and a stepparent, while this study found a similar result for non-CTE (17.5%), but a much higher level for CTE students (24.6%). Finally, the NCES study reports that 4% were found to live in a variety of other arrangements, while this study found this to be 5.5% for non-CTE students, and 11.9% of the CTE students.
Overall, the data from this sample of non-CTE Michigan seniors mirrors that found for the national sample of students. Yet the data from the CTE students reflects significant differences, especially in the number who are not living with either of their parents or stepparents. Nearly 12% of them are living with relatives or other adults, compared to 5.5% of the non-CTE students.
To ensure that CTE will remain an option on the secondary curricular landscape, CTE educators must continually seek ways to maintain and enhance enrollment. There are many factors that influence a student’s curricular decision-making process, and one is marketing efforts used to describe and sell programs. And to be most effective, it is essential to know a profile of the individuals to whom you are marketing your product and to determine if that profile is changing overtime.
To this end, this research revealed that the typical CTE student in this sample performs somewhat lower academically (although by only one grade classification), lives less often with both parents while more commonly residing without either parent present, and is more economically disadvantaged.
In reference to income and academic standing, this profile is similar to that found by most other researchers during the past decade. Despite ongoing initiatives in CTE to raise the bar on academic content in CTE and to appeal to a broad mix of student ability levels, there still are significant differences between CTE and non-CTE students (at least within this somewhat “typical” area CTE center). The income and grade disparities between CTE and non-CTE students may be lessening, but they are still key factors to be considered.
The most striking information resulting from this study is that nearly 12% of the CTE students reported living in an environment with other relatives or other adults (i.e., no mother or stepmother or father or stepfather). This compares to 5.5% of the non-CTE students in this sample, and 4% of all students nationwide. Without judging whether such arrangements are good or not, CTE educators need to consider this information as classes are scheduled and programs are marketed. Such students are more likely to have other issues happening within their lives than those who come from homes in which a parent or step parent are present.
Readers could conclude that these findings are an anomaly to this group of 451 seniors in Michigan. However, the overall profile of non-CTE students within this sample is too similar to the overall national profile to disregard that these CTE-based findings might indeed represent a snapshot of other CTE populations. We encourage readers to collect similar data from the populations they serve, and suggest researchers at the national level to collect data allowing disaggregation of CTE and non-CTE data for things such as social living conditions.
Successful marketing requires knowing who your audience is and effectively packaging your product toward their needs. Having such knowledge allows CTE personnel to target students of similar backgrounds, and more aggressively create strategies to recruit the atypical student. Given this profile of CTE and non-CTE students, educators have two broad options available to them in regard to recruitment and enrollment strategies. They may (1) specifically target students who represent this profile, expecting that they represent those most likely to ultimately enroll in CTE, and/or they may (2) seek to actively pursue those students who are more academically and economically advantaged and who more commonly disregard CTE as a viable option. Whatever approach is taken, current demographic information is essential to allow more targeted marketing of CTE programming.
Bowden, T. (1998). Harford technical high school turn-around: Miracle or marketing? Tech Directions, 58 (5), 12–19.
Campbell, P. (1986). Vocational education: Access, equity, and consequence. Educational Horizons, 65 (1), 10-15.
Gaunt, D. (2006). High school seniors' perceptions of career and technical education and factors influencing their decision to attend an area career technical center (doctoral dissertation, Western Michigan University, 2005). Digital Dissertations . AAT 3183588.
Gaunt, D., & Bierlein Palmer, L. (2005, November/December). Positive student attitudes toward CTE: It can be done! Techniques, 80 (8), 44-47.
Kerka, S. (2000). Career and technical education: A new look . Columbus Dissemination Center for Career and Technical Education, The Ohio State University (ED 448 319). Retrieved April 18, 2004, from http://www.nccte.org/publications/infosynthesis/in-brief/in-brief08/index.asp .
Levesque, K., & Hudson, L. (2003). Trends in high school vocational/technical coursetaking, 1982-1998 . Washington, DC: National Center for Education Statistics, 2003-025.
National Center for Education Statistics (2002). Retrieved February 06, 2005, from http://nces.ed.gov/programs/quarterly/vol_6/1_2/4_1.asp
Ries, E. (1999). Packed by popular demand. Techniques, 74 (3), 22-25.
Vo, C. (1997, January). Not for my child. Techniques, 71 , 20-23.