Correlation Between Weather Conditions and Rhododendron Flower Bud Formation
Russell Gilkey
Kingsport, Tennessee
Summary
Flower bud set on rhododendrons in the garden depends on a number of factors. Among them are rainfall, temperature, light, nutrition, plant age and health, and bud set and bloom the preceding season. It is the contribution and interaction of these factors and undoubtedly others, e.g., timing, that govern the formation of the flower and/ or growth buds. Observations of flower bud set and weather conditions over a period of 17 years indicated that an increase in flower buds occurred when (1) the previous year's buds were blasted by cold weather; (2) bud set the previous year was poor; (3) the plants were fertilized, after blooming, with slow release fertilizer; (4) summer rainfall was lower and (5) temperatures higher than normal and (6) there were fewer cloudy summer days. The magnitude of the effect on flower bud set seemed to decrease from (1) to (6). The difficulty of a satisfactory explanation for the change (increase or decrease) in flower bud set for certain years in the span of 17 years points out the complexity of the process.
The fact that the number of flower buds on my rhododendrons has varied so much from year to year has intrigued me for some time, but inertia kept me from trying to find out why. Then at one of our Southeastern Chapter meetings, in the fall of 1992, Augie Kehr asked what kind of bud set the attendees had that year. Everyone reported a poor bud set. The next question was why. The subject was kicked around, but there was no overall agreement. Augie then suggested that someone should determine the bud set experience of rhododendron growers in the area and see if it could be correlated with weather conditions. That was the impetus I needed to take advantage of my propensity for a record keeping.
| TABLE 1: Rhododendron Flower Bud Count | |||||||
| Year | Total No. Buds | No. Plants Counted | No. Plants Whose Buds | Change in No. of Buds From Previous Year | |||
| Increased | Decreased | No Change | Increased | Decreased | |||
| 1977 | 1197 | 25 | |||||
| 1978 | 1016 | 25 | 3 | 10 | 12 | 203 | |
| 1979 | 1412 | 27 | 14 | 5 | 8 | 391 | |
| 1980 | 1743 | 28 | 15 | 3 | 10 | 325 | |
| 1981 | 1369 | 29 | 9 | 12 | 8 | 474 | |
| 1982 | 3972 | 42 | 36 | 2 | 4 | 2517 | |
| 1983 | 1252 | 45 | 2 | 34 | 9 | 2739 | |
| 1984 | 2729 | 46 | 34 | 6 | 6 | 1424 | |
| 1985 | 2633 | 47 | 15 | 15 | 17 | 661* | |
| 1986 | 1376 | 45 | 7 | 15 | 23 | 1181 | |
| 1987 | 2168 | 54 | 24 | 11 | 19 | 694 | |
| 1988 | 2916 | 62 | 18 | 24 | 20 | 602 | |
| 1989 | 1389 | 68 | 8 | 29 | 31 | 1515 | |
| 1990 | 3644 | 84 | 47 | 7 | 30 | 2030 | |
| 1991 | 5120 | 103 | 61 | 14 | 28 | 1329 | |
| 1992 | 2479 | 116 | 15 | 73 | 28 | 2478 | |
| 1993 | 6440 | 116 | 97 | 6 | 13 | 3927 | |
| 1994 | 7881 | 115 | 51 | 39 | 25 | 1404 | |
| * 757 buds from 11 plants that were winter killed were not included in change from 1984. There were 104 buds from 12 plants that started blooming in 1985. There was therefore a gain of 557 buds on living 1984 plants. There was a bud loss of 96 (757-661) on total count. | |||||||
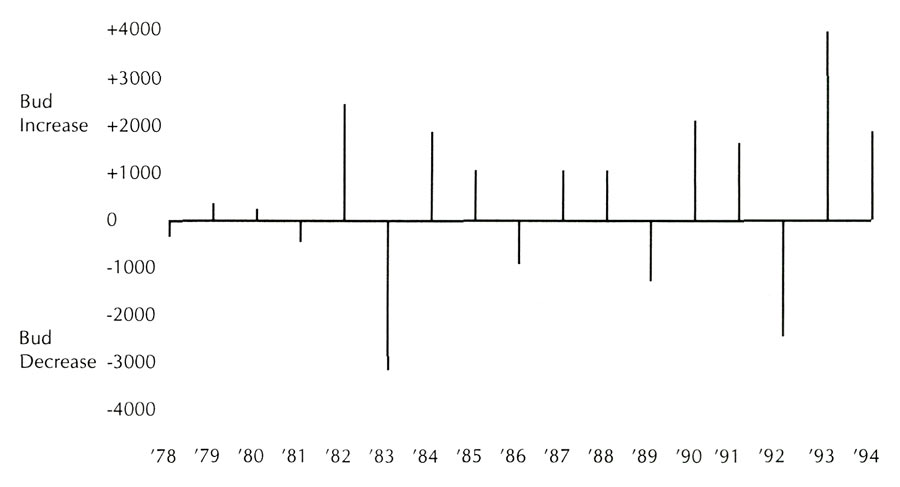
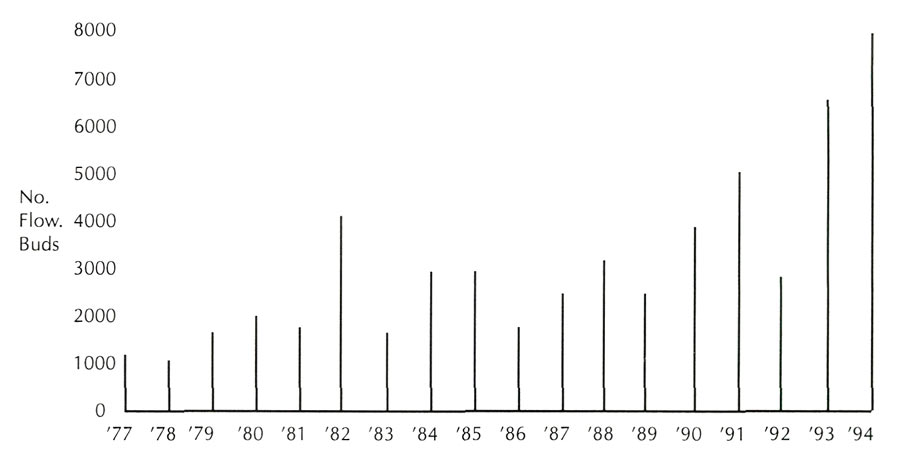
Over the years a record has been kept by me of the number of flower buds on every rhododendron in the yard. The following year, the number that bloomed were counted as the faded trusses were deadheaded. This also served as a check on bud count. If there was a discrepancy, it usually was that more blooms were counted than flower buds. If that was the case, bloom count was used. Bud counting was started in 1973 but wasn't reliably done for every plant until 1977. The bud counting data is presented in Table I and shown graphically in Figures 1 and 2. There is an uptrend in the total number of buds since more rhododendrons were planted every year. The meaningful data is the increase or decrease in the number of buds from year to year. You may notice that there is a discrepancy in the total number of buds for a given year and the value you should get by bud increase or decrease from the previous year. This is because of the plants that are listed as "no change." A change of two buds for a plant with 20 buds doesn't qualify as a significant change. Also if there were less than 5-10% (depending on number of buds) change in number of buds, the plant was listed as "no change." Try counting 300 buds and you can understand why. The only way I have discovered to count hundreds of buds on a plant is to start with the lowest branch and work out that branch one branch at a time to the end. Then proceed to the next branch up the trunk and so on to the topmost branch. It can get tedious. The bud counting was done on several fairly warm days in late December or January when other outdoor chores were no longer necessary. The variables that were considered as possibly affecting flower bud set of my garden rhododendrons were light, moisture, nutrition, temperature and previous blooming behavior. Deadheading was not a variable since all the plants were deadheaded every year. Disease (dieback, e.g.) and branches sheared off by falling tree limbs would affect the bud count but were judged to be minor enough not to have a significant effect on the total count. One exception would be 1985 when several plants were killed by a January freeze (-21 °F), and a fair amount of dead wood was pruned out of others. It should be noted that in spite of this the bud count of living plants increased.
|
| Figure 1 Change in Rhododendron Flower Bud Count from Previous Year |
|
| Figure 2. Total Number of Rhododendron Flower Buds Counted Each Year |
The next step was to collect data on weather conditions for the years 1977-1994. Rainfall data was available from my records, using a Tru-Chek rain gauge, of rainfall in the yard. In 1986 an irrigation system consisting of garden hoses, sprinkler heads and Y valves was installed. From the gallons of water used (city water bills 1984-1994) in the June, July, August period, the inches of irrigation water could be calculated for the area being watered. This amount, added to the rainfall, presents a somewhat more accurate account of the moisture available to the plants. However, in hot, dry months, the plants were still somewhat stressed. The trees on my two lots also love w
ater. A trip to the National Oceanic and Atmospheric Administration office at the Tri-City Airport yielded a publication titled "1992 Local Climatological Data Annual Summary With Comparative Data." Included in this publication were monthly average temperatures for 1963-1992 and monthly cooling degree days for 1969-1992. Another form from NOAA listed monthly clear, partly cloudy and cloudy days for 1971-1992. The missing data for 1993 and 1994 was obtained by phone call. The Tri-City Airport is about 8 miles from my house as the crow flies. Weather conditions at my house should therefore approximate those at the airport.
| TABLE II: Comparison of Change in Rhododendron Bud Count With Variation in Weather Conditions Deviation Each Year From Average for All Years | ||||||
| Change in No. of Buds From Previous Year | June, July, August Rainfall | June, July, August Irrigation Plus Rainfall | June, July, August Cooling Degree Days | June, July, August Clear Plus Partly Cloudy Days | Average May Temp. | |
| Year | (+) Increased or (-) Decreased | |||||
| 1977 | -2.44 | +73 | +4 | +3.1 | ||
| 1978 | -203 | +2.73 | -18 | +6 | -1.4 | |
| 1979 | +391 | +0.94 | -257 | -6 | +0.1 | |
| 1980 | +325 | -3.75 | +92 | +10 | +0.5 | |
| 1981 | -474 | -0.62 | +37 | -7 | -2.4 | |
| 1982* | +2517 | +9.42 | -70 | -4 | +4.5 | |
| 1983 | -2739 | -0.35 | -69 | +10 | -2.8 | |
| 1984* | +1424 | -0.11 | -1.32 | -132 | +1 | -4.3 |
| 1985* | +661 | -0.07 | -1.01 | -201 | -9 | +0.1 |
| 1986 | -1181 | -1.40 | +0.36 | +115 | +14 | +1.1 |
| 1987 | +694 | -5.49 | -1.64 | +209 | -5 | +5.6 |
| 1988 | +602 | -4.15 | -0.82 | +143 | +11 | -1.4 |
| 1989 | -1515 | +3.04 | +1.74 | -15 | -13 | -3.9 |
| 1990# | +2030 | -1.73 | -3.11 | +18 | +2 | 0 |
| 1991# | +1329 | +2.89 | +1.43 | +20 | -4 | +5.9 |
| 1992# | -2478 | +3.02 | +3.10 | -157 | -21 | -2.5 |
| 1993# | +3927 | -6.03 | -1.83 | +168 | +12 | +1.0 |
| 1994# | +1404 | +3.93 | +3.15 | +49 | 0 | -2.9 |
| Average for '77-'94 | 11.43 in | 12.89 in. | 823 | 58 days | 63.7°F | |
|
* Severe winter flower bud blast occurred in these years.
# Slow-release fertilizer was applied in these years. |
||||||
Instead of tabulating the weather condition data per se, each set of data was averaged over the period 1977-1994 and the deviation (+ or -) from average of that condition for each year is listed in Table II. The flower bud count increase or decrease is shown for comparison. This data was picked because it showed the best correlation between weather conditions and flower bud set. The months of June, July and August were chosen because that's mainly when flower bud initiation and development would occur. Including May, using any one month or trying various combinations of May, June, July and August did not improve the correlation over the entire span of years.
Extra fertilization and heavy winter bud blast are also shown in Table II. My fertilization record leaves something to be desired. Miracid was used in June most years but wasn't written down every time. However, starting in 1990, after reading an article in the Journal (44:2, 84-87, 1990) by George Ryan, "Phosphorus and Nitrogen Nutrition of Rhododendrons," a solid mixture of 4/1 by volume of Agrinite (composted sewage sludge, 7% N)/ triple phosphate (45% P) was sprinkled around each rhododendron. From 1-8 tablespoons of the mixture was used depending on the size of the plant. The tendency was to increase the amount each year within that range. Dates of application were 5-24, 6-14, 7-23, 5-7 and 5-28 for 1990-1994, respectively. My feeling is that the one shot Miracid fertilization is not as effective in promoting flower bud formation as the slow release type. Application in late July in 1992 may have been too late to do much good.
Flower bud blast due to severe winter weather was approximately 65%, 70%, 98% and 50% for 1982, 1984, 1985 and 1994, respectively. Some bud blast occurred in other years on borderline hardy varieties but not to an extent to significantly affect the potential flower bud development and total bud count.
Is there a correlation between flower bud set and any of these items? Before attempting to address this question, a prediction must be made concerning the expected change (increase or decrease) in bud set with a change (+ or - from average) in condition. An increase in flower bud set is predicted for a decrease in rainfall, an increase in cooling degree days (hot weather), an increase in May temperature, an increase in clear plus partly cloudy days, timely application of fertilizer, severe winter kill of prior year's flower buds and for the year following a year with poor flower bud set. A decrease in flower bud set is predicted for the opposite change in these conditions. A possible explanation could be proposed for each prediction. For instance, a decrease in rainfall would stress the plant and flower bud set might increase because of the plant's struggle for survival by means of flowering and seed production to reproduce itself. Since many of the predictions would likewise be based on supposition rather than experimental evidence, no further attempt will be made to justify the predictions.
These predictions can be tested by comparing the data in Table II. A change (+ or -) from average for rainfall is in agreement with an increase or decrease in flower bud set in 10 out of 17 years. For rainfall plus irrigation the agreement is 8 out of 11 years. For cooling degree days the agreement is 10 out of 17 years. For May temperature the agreement is 13 out of 17 years. For clear plus partly cloudy days the agreement is 8 out of 16 years. If the bud-blast years of 1982, 1984, 1985 and 1994 are excluded and only the largest deviations from average are used, agreement with increase or decrease in bud count for the preceding conditions would be 7 out of 8, 2 out of 2, 4 out of 6, 6 out of 6 and 5 out of 7 years, respectively. The test for winter bud blast correlates with increase in flower bud count in 4 out of 4 years and for slow-release fertilization in 4 out of 5 years. An alternate year blooming cycle occurs in 11 out of 16 years. Whether the cycle is every other year or every third year is an interesting question for which I have no answer. The one exception with slow-release fertilization is not a true test since the fertilizer was not applied until July in 1992. Another indication that fertilizer application is increasing the number of flower buds is that there was an increase of about 4,900 buds from 1988 to 1994. Plants starting to bloom after 1988 accounted for only 2,300 of these increased buds.
Has a good correlation between weather conditions and flower bud formation in the garden been established? The answer is no, but some correlation certainly can't be ruled out. The trouble is there are many years that weather condition deviation from average doesn't seem great enough to have the observed effect on bud count. There are also non-conforming years (e.g., 1991) that are hard to explain. You have to assume that May temperature and fertilization outweigh all the negative factors. What is apparent is that many complicating factors are involved. There are undoubtedly interactions and some variables that are either unknown or haven't been considered. Take, for instance, length of dry spell or heat wave, and several moderate rains vs. a frog strangler. Timing could be a critical factor in determining how, where and when plant hormones are triggered. However, based on observations and the magnitude of bud set change for the entire period, the factors presented here, in order of greatest to least effect on flower bud formation, would be ranked: bud blast, alternate year blooming, fertilization, May temperature, rainfall, hot weather and number of clear and partly cloudy days. It should be pointed out that all plants did not follow the pattern of bud increase or decrease shown in Table I. There were always some that didn't keep in step and tended to march to a different drummer. All this may be food for thought, but what home gardeners are really interested in is what they can do to increase flower buds on their rhododendrons. Applying slow-release fertilizer after they bloom (late May in my area) is a good bet. You already know that more light, short of damage to foliage, works. If you want to have a consistent but average bud set from year to year, after October pinch out a number of flower buds in years with a heavy bud set. Withholding water in periods of summer stress is not recommended. Stress also leads to disease. There is not much you can do about May temperature. Anyway, that could very well be just a coincidence. Finally, keep your rhododendrons healthy. Some of these suggestions are not guaranteed since they haven't been proven by experimentation, so try them on a few plants before going whole hog.
Russell Gilkey is a member of the Southeastern Chapter.