Overview
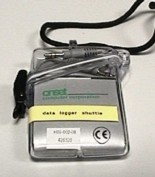
To ensure that the climate in the rare book room and basement storage area will not damage any materials they house, we have purchased two data loggers. These loggers are configured to record temperature and relative humidity every hour, and can store months of data at a time. To transfer the data back to a computer for analysis, we use a "shuttle" (pictured at right) that connects to the loggers. We then connect the shuttle to a PC with the proper cables and software (such as the machine at the front desk in Special Collections). The data can then be offloaded from the shuttle and saved for analysis. The overall sequence is as follows:
- Transfer the data from the logger to the "shuttle".
- Transfer the data from the shuttle to a PC.
- Save the data in a usable form.
Read on for a more detailed explanation.
The Hobo Shuttle
Transferring Data from the Logger to the Shuttle
- The shuttle should contain a short cable. Plug one end of the short
cable into the shuttle. Unscrew the cap from the logger, and plug the
other end of the cable into the logger.
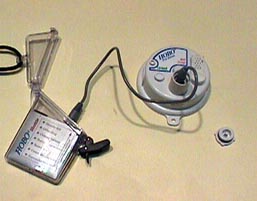
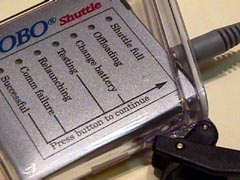
- Press the black button on the shuttle to transfer the data from the
logger to the shuttle.
- The logger's memory is now cleared. Note: you can transfer data off of more than one logger without risk of losing data (i.e. you can collect data from both loggers using the shuttle, then take the shuttle containing both sets of data to a PC).
Transferring Data from the Shuttle to a PC
- Connect the free end of the cable labelled "data logger transfer
cable" to the shuttle.

- Launch the Boxcar Pro software by double-clicking on its icon (see
below.)

- Click "Hobo Shuttle Readout" under the "Logger" menu to download
the data.
- You should see a progress bar, something like:
- Fill out the list of parameters to view, then click "OK".
- Your screen should have a graph, something like
- Save the raw data set by selecting "Save As" under the "File"
menu.
- Export the data to a text file for use with Excel by selecting
"Export > Microsoft Excel" under the "File" menu.
- Select the fields to export to the Excel file, then click
"Export".
- Save a tab-delimited text file containing your data (see
below).
- A progress bar like the following will appear:
- Open the data using Excel. You'll probably need to change the
"files of type" window to read something like "all files" (see
below).
- Make sure the "Original data type" is set to "Delimited" then click
"Next".
- Make sure "Tab" is checked under the "Delimiters" heading, then
click "Finish".
- Highlight the first column (containing the dates) by clicking the
letter at the top of the column.
- Select "Cell" under the "Format" menu.
- Change the format of the date column to display both the date and
time.
- Save the data as an excel file.
- Change "Save as Type" to "Excel Workbook" and click "Save".
- The data from the logger has now been saved to an Excel file.