CATALYST v24n2 - Continuing Education in Canada: The Metro Colleges' Continuing Education Survey
Continuing Education in Canada: The Metro Colleges' Continuing Education Survey
Cindy Dundon Hazell
This research was made possible through the cooperation and enthusiasm of the heads of continuing education of the Metro area colleges and their staff. I gratefully acknowledge the support and encouragement of Kathryn Barber, chair, Continuing Education Corporate, Humber College; Gary Britton, dean, Continuing Education, Sheridan College; Danny Cushing, dean, Continuing Education/Marketing, George Brown College; David Drake, dean, Continuing Education, Centennial College; Mark Toljagic, researcher, Centennial College; and all of my own staff in the faculty of Continuing Education at Seneca College. I would also like to acknowledge the continued assistance of Ted Hodge of Compustat Consultants throughout all stages of the research project and during the preparation of this article. In this article, Greater Metro refers to Metropolitan Toronto, which consists of the city of Toronto and five surrounding area municipalities in Ontario, Canada. It is the most populous metropolitan area in Canada with a 1991 population of 2,275,770. More than seven million people (about one quarter of Canada's population) live within a 100-mile radius of downtown Toronto; about one quarter of all new immigrants to Canada now come to the Toronto area.
When the concept of Ontario Colleges of Applied Arts and Technology was introduced in the provincial legislature in May, 1965, the then Minister of Education, the Honorable William Davis, emphasized that the new system was to be seen as an alternative to university and, hence, would be a significant and deliberate response to one of the government's key educational priorities: increased accessibility for all sectors of society. As such, the new colleges were clearly differentiated from the transfer institutions in some parts of western Canada and in the United States. According to Davis, "This Bill marks a major step forward in the development of our educational system; it provides for the introduction of a new level and type of education...it goes far towards making a reality of the promise--indeed of the stated policy--of this Government to provide through education and training, not only an equality of opportunity to all sectors of our population, but the fullest possible development of each individual to the limit of his ability" ( Ontario Department of Education, 1967, p. 5 ). In his closing remarks, Davis added, "I have no intention of permitting any group of young people to be forgotten and deprived, or any group of adults needing retraining for a new world of work in a new age to be neglected..." (p. 16).
In his address, Davis had emphasized that these new opportunities were to be provided "for full-time and for part-time students, in day and in evening courses, and planned to meet the relevant needs of all adults within a community, at all socio-economic levels, of all kinds of interests and aptitudes, and at all stages of educational achievement" (p. 8).
Today there are 23 colleges operating out of over 100 locations across Ontario, and according to recent enrollment reports, over 123,000 full-time postsecondary students and more than 800,000 part-time registrations annually. According to a recent environmental scan prepared by the Association of Colleges of Applied Arts and Technology of Ontario (1993), the part-time postsecondary enrollments alone have increased in the last 10 years by over 72%.
Over the past 20 years, however, a number of studies have been conducted that indicate certain elitist trends and patterns of participation in Canadian adult education. The findings of the CAAE survey in 1982 included a plea for immediate public attention to the participation patterns that were being revealed. Their concerns were underscored by the results of the Devereux survey (1984) entitled "One in Every Five: A Survey of Adult Education in Canada," which showed a significant correlation between socio-economic factors and participation rates. In turn, Devereux's findings proved to be consistent with those of a number of subsequent studies ( Livingstone, Hart, & Davie, 1985, 1987, 1989, 1991, and 1993 ). In short, the data repeatedly showed that those who were already the most educated and most affluent in our society were also the ones most likely to access adult or continuing education courses.
In an unpublished manuscript by Davie (1993), however, some interesting changes in social class and geographical variables are revealed by examining the available database of time series data from the last four Livingstone, Hart, and Davie Ontario surveys. According to Davie, the data suggests that significant changes are occurring in Ontario in the direction of broadening accessibility to adult education. Recent data collected in the Metro Colleges of Applied Arts and Technology support this observation.
In the summer of 1992, the heads of Continuing Education for the five colleges in the Greater Metro area identified a need for further information about their student population. The colleges had experienced a steady and unrelenting growth in continuing education activity levels over a period of 10 years and, in some colleges, it appeared that significant numbers of new immigrants and second language students were enrolling. Aware that recent data were available on adult education trends and patterns both provincially and nationally, the heads felt there was still a lack of information specific to the part-time studies activity in Ontario's colleges. Most of the individual colleges had conducted student surveys either periodically or on a semester basis, but there was no system-wide database of information nor comparative benchmark for measuring individual college performance. Motivated by the colleges' original mandate, the Metro heads committed to a joint survey of their continuing education students and established the following research objectives:
- To create a shared data base to contribute to planning and decision-making at each institution.
- To provide a Metro-wide profile of continuing education at the colleges--both in terms of programming and students--to help focus college system attention on vital issues.
- To gain comparative data for each college to assess performance, college services, and trends.
- To provide a prototype case demonstrating the benefits of cooperative research, and to identify additional research needs and opportunities.
- To benefit from the efficiencies of shared cost and consistency of surveying, data processing, and reporting.
This paper, therefore, is intended to highlight the findings of the Metro Colleges' continuing Education Survey conducted in February, 1993. This project is particularly significant because of the size and scope of the database, and because it represents the first collaborative approach to research undertaken in continuing education in the history of the Ontario system. The complete set of data is available in various report formats through any of the heads of Continuing Education. A summary report is also available through the cooperation of the Association of Colleges of Applied Arts and Technology of Ontario.
The Metro Colleges' Continuing Education survey was supported financially through the part-time student advisory committees at each college. The survey was a comprehensive one, including questions related to student demographics, reasons for enrolling, student preferences, and student satisfaction with course content, teaching and services. This article will focus, however, on those findings that help us better understand the profile of the continuing education student in the Greater Metro area--and the colleges' success in meeting these students' educational needs.
Methodology
This research was conducted using an in-class student feedback survey, which was developed by the heads of Continuing Education, with the assistance of Compustat Consultants of Laurel, Ontario, based on input from college faculty, staff, and students. The questions were piloted in the fall of 1992 with a group of 736 students representing a cross-section of credit and noncredit programs and coming from various campus locations. Advice was sought from consultants who specialize in working with second language students. The pilot survey afforded the colleges the opportunity to test the survey instrument and the process of implementation before administering on a much larger scale.
Finally, over a two-week period in February, 1993 (February 22 to March 8), the 20-minute survey was administered to all continuing education students in class in the Greater Metro area at that time. From 2,940 classes, 41,367 students completed the survey. (All credit and noncredit classes in progress were included except those located in non-college locations and those studying through independent/distance learning methodologies.) Approximately 85% of the available classes were surveyed, with an in-class return rate of 75%. In general, the division/faculty and campus/location ratios for each college were proportionately represented in the completed surveys.
To ensure the respondents complete confidentiality, student volunteers were used to deliver individually labelled kits and instruction scripts to each class, and to collect the completed surveys afterwards. Those students who self-identified as being enrolled simultaneously in a full-time program were separated out from the main database for analysis purposes. Approximately 15% of the surveys represented students who indicated they were taking more than one course during the survey period; with the exception of one or two questions, these responses were included in the analysis since they contained feedback that was specific to individual courses, locations, instructors, etc.
The data generated by this survey was summarized by customized program into several report formats, providing invaluable feedback to the heads of Continuing Education with increasing levels of detail, e.g., comparison by college, by campus, by division or faculty, and by program area. Each college now owns the complete database of information and several of the heads have requested further cross-tabulations that are proving useful to the planning and decision-making cycle.
Highlights of the Survey
In addition to demographic variables, additional areas were also examined in the study. The highlights include age, gender, employment status, financing for part-time students, customer loyalty, educational background, cultural diversity, registration preferences, satisfaction with teaching and learning, and meeting diversity of needs.
Age
The typical profile of the adult education participant, according to the previously cited studies, is that of a young, female, well-educated, white collar worker ( Devereux, 1984 ). In the Metro Colleges' survey, over 70% of the respondents were from the 25-44 years of age range--and more than one third were over 35 years old. Although complete data are not available for the colleges prior to this survey, the records kept by some colleges confirm that, not surprisingly, the continuing education population in Metro is an aging one.Gender
Consistent with the findings of previous adult education studies, the data indicate that 56% of CE students in the Greater Metro Colleges are female. This ratio varied noticeably, however, program by program and college by college, probably reflecting the differences among the colleges in program mix. In fact, Figure 1 shows that there were two colleges with more male than female respondents. Data available in some of the colleges suggest that male participation rates have increased in recent years, possibly reflecting an increase in the demand for technical skills upgrading and retraining type courses.Employment Status
It has traditionally been believed that the continuing education student is typically employed full time during the day and is studying, for the most part, one or two evenings a week. In one of the Metro Colleges, for example, information was collected in 1986 indicating that 83% of their CE students were employed full time. In the 1993 Metro Colleges' Continuing Education Survey, however, only 63% of the respondents identified themselves as full-time workers. Most likely reflecting our current economic times, another 13% reported themselves as working part time and 12% were unemployed. Consistent with this changing trend, the colleges have begun to offer courses in recent years at nontraditional times during the day and evening and on weekends. This notwithstanding, many students indicated that they still prefer the traditional evening start times, with 33% responding that they would not take a course at all if it were only offered on the weekend.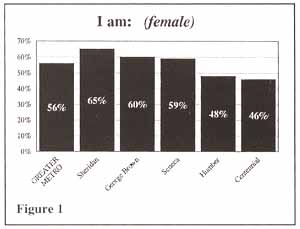
Financing Part-time Students
In a related question, students were asked whether or not their employers supported their studies either financially and/or in time off work. Two thirds of the respondents indicated that they received no support from their employers or responded that the question was "not applicable," e.g., they were not employed. This is especially significant when we consider the students' response to another question regarding barriers to success in CE: The greatest barrier cited at all colleges by far was finances (15% Metro-wide, followed by language skills at 7%). In response to this feedback, several of the colleges have already begun to increase financial aid through bursaries and scholarships, previously accessible only to full-time students.Customer Loyalty
At all but one of the colleges, the most important reason cited for choosing to register in a particular college was 'location,' ranging from 20% at a downtown college to 56% at a college located in a suburban community. Approximately 71% of the respondents across Metro indicated that they were repeat students at the same college, although 40% had taken courses at another college. Seventy-three percent of the students indicated that they intended to register in another continuing education course at the same college in the next semester, with another 19% not sure.Across Metro, most students (78%) reported that they were taking their current course for career-related reasons: "improving myself in my current career" (35%), "preparing for a change of careers" (24%), "seeking an entry level position" (9%), "seeking a credit towards a full-time program" (10%). In contrast, most likely reflecting the challenges of our current economy, only 6% of the Metro respondents cited "pursuing a hobby or interest" as their main motivation. Seventy-five percent of the respondents indicated that they were working towards a college certificate or diploma or professional designation.
Educational Background
The Metro Colleges' survey results concur with previous studies regarding the attraction of continuing and adult education courses to those who already have some postsecondary education--though to a lesser degree. Figure 2 shows the students' responses to a question asking for the highest level of previous education attained. The results show that just over half of the Metro respondents (53%) had already completed some level of postsecondary education, with 23% holding university degrees and 30% indicating that they were previous graduates of a college certificate and/or diploma program, e.g., ranging from a short certificate program to the equivalent of three years' (full-time) duration. Consistent with the colleges' original mandate, however, almost one third of the respondents were Grade 12 graduates, 13% were OAC graduates, and 6% had less than Grade 12.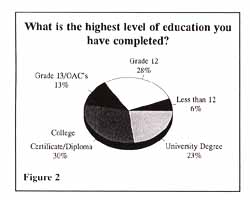
Cultural Diversity
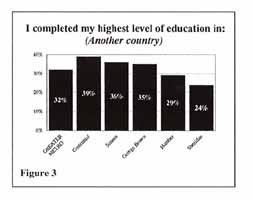
Several indicators were used to reveal the cultural diversity that seems so evident in the halls of many of the Metro Colleges today, and to determine the colleges' success in responding to diverse needs. Figure 3 shows that just under one third of the students had achieved their highest level of education in a country other than Canada, with noticeable variation among the colleges (ranging from 24% to 39%). Of those holding university degrees, 36% across Metro attained their degree outside Canada, with up to 46% at one college.
Thirty one percent of the students across Metro indicated that English was not their first language, again varying from only 19% at one college to 40% at another (Figure 4). At two Colleges, almost 50% of those students holding university degrees indicated that English was not their first language. When asked whether English skills had caused problems in their course, 10% of the students in Metro said 'yes.'
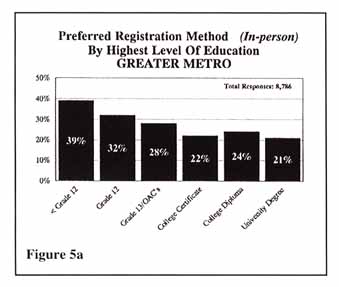
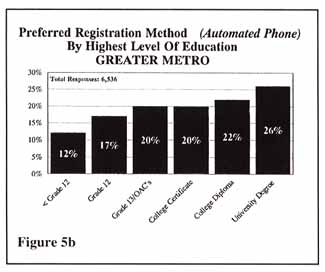
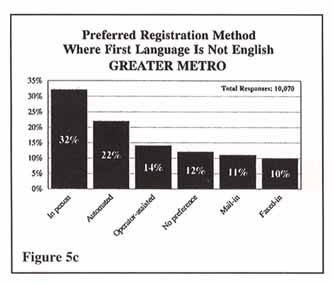
Registration Preferences 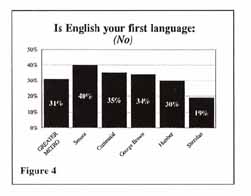
One of the frequent complaints heard in the college system in recent years has been the difficulty students have had in obtaining accurate program information and registering for their courses. With unprecedented numbers of students attempting to register at peak times each semester, many of the colleges have begun experimenting with alternative methods of registration, e.g., fax and automated telephone. In a question that asked students to indicate their preferred registration method, some interesting patterns were revealed. Figures 5a, 5b, and 5c suggest a correlation between educational background and English language skill, and preferred methods of registration: As education increased, larger percentages of students reported a preference of automated and fax methods; preference for "in-person" registration, however, appears to be greatest for students with less education and for those whose first language is not English. As high technology continues to make automated methods more feasible for the colleges, these data will likely raise important trade-off questions surrounding efficiency versus access.
Student Satisfaction With Teaching and Learning
One very important finding for the colleges was that students were well satisfied with their courses and instructors. In a section of the survey entitled "Teaching and Learning," the students were asked to rate their course content, course materials, and instructors using four possible ratings of "excellent," "good," "fair," and "not satisfactory." Overall, 81% of the respondents were well satisfied with their course content, rating it either "good" or "excellent"; 90% were well satisfied with their instructor's knowledge of the subject; and 80% were well satisfied with their instructor's presentation of the course material.Meeting Diverse Needs
The variation among the colleges in cultural diversity, however, leads to some interesting cross-tabulation of data, and has revealed some significant differences in student satisfaction. One of the most intriguing analyses involves a cross-tabulation of student profile data with data indicating which students rated their "instructor's knowledge of the subject" as "excellent" (Figures 6 and 7). Indeed, the results indicate that those students whose first language is not English were 16% less likely to rate their instructor's knowledge as excellent. Similarly, whereas 59% of those educated in Ontario felt that their instructor's knowledge was "excellent," only 48% of those educated in another country felt the same way. Among those who indicated that English was not a problem in their current course, 57% rated their instructor as "excellent," compared to 44% of their colleagues who admitted to having problems with English.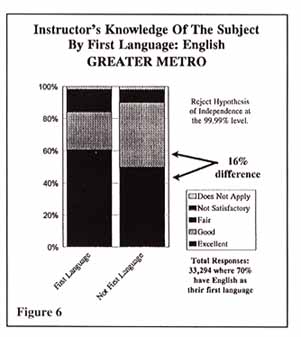
Similar differences exist in the responses to questions concerning student satisfaction with academic and student support services. In general, those students whose first language is not English, and those students who were educated in another country, were less likely to rate their experiences as "excellent." It would appear that the colleges have been less successful in meeting these students' academic and support service needs than those of their English speaking, Canadian educated classmates.
Analysis 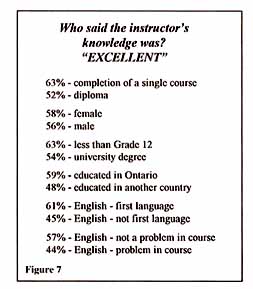
These patterns pose some important challenges to the Metro Colleges. With upwards of one third of Metro's continuing education students coming from different cultures, with different languages being spoken in the home, and with diverse educational backgrounds, it is incumbent upon the colleges to find ways to more effectively respond to these students' needs. Many of the colleges now include courses on "cultural diversity in the classroom" as part of their professional development programs for part-time teachers. Some have hired counsellors from designated ethnic groups to increase academic support for students. Part-time students in some colleges now have access to English skills assessment services, advisement programs, and writing clinics that were previously only available during the day for full-time students.
It has also been suggested that there may be important differences in the expectations and perceptions of adult student from other cultures with which we are not yet familiar. What impact do cultural traditions and mores have on an adult student's expectations of his or her educational experience? How do language and context differences affect the student's interpretation of that experience? Since the main difference in response patterns appears to be in the ratings of "excellent" and "good," are there cultural differences that affect a student's willingness to use the term "excellent"? It would seem worthwhile to pursue further, qualitative research into the differing expectations and perceptions of multicultural adult students. As the heads of Continuing Education in Metro continue to realize the benefits of this first collaborative project, and with such a significant database to use as a foundation, the colleges are in a good position to take a leadership role in this regard.
Summary
This article has introduced the 1994 Metro Colleges' Continuing Education survey and highlighted those findings that help us better understand the profile of the colleges' diverse student population. Student satisfaction data is also briefly introduced, indicating differences in satisfaction ratings between those students with and without English as their first language, and between those educated in Canada and outside. In general, the colleges appear to be most successful in meeting the educational and support service needs of English speaking, Canadian educated students.
This notwithstanding, the data confirm that the Metro Colleges are, indeed, playing a significant role in making postsecondary education and training opportunities accessible to broad sectors of the adult population. The challenge ahead will be to develop a better understanding of the diversity among our students and to find ways to more effectively respond to their educational needs. The colleges are currently involved in the planning of a 1995 collaborative survey.
References
Livingstone. Association of Colleges of Applied Arts and Technology of Ontario. (1993). Environmental Scan. Toronto: Association of Colleges of Applied Arts and Technology.
Davie, L. E. (1993). Changing Demographic Patterns in Adult Education Participation: 1986-1992 . Unpublished manuscript.
Devereux, M. S. (1984). One in every five: A survey of adult education in Canada . Ottawa: Ministry of Supply and Services Canada.
Ontario Department of Education. (1967). Colleges of Applied Arts and Technology Basic Documents . Toronto: Ontario Department of Education.