
JOTS v39n1 - Small & Medium Enterprises - Their Views of Product Data Management Tools
Small & Medium Enterprises -Their Views of Product Data Management Tools
Karen Waldenmeyer and Nathan Hartman
Abstract
This study was conducted as a means to discover common traits associated with small and medium manufacturers, especially ones who have adopted product data management (PDM) systems as a method to control engineering design and manufacturing data. After qualitative interviews were conducted with leading experts across industry sectors, a survey was developed and sent to small and medium manufacturers in the United States. The study concludes a number of interesting findings about the state of PDM usage within various segments of the industry, including general uses for engineering design systems, level of data exchange with customers and suppliers, and satisfaction levels with information querying, concurrent engineering contributions, and imposed restrictions. The study concludes that there are a few major factors that determine a company’s success with using design and data management systems, including frequency of data exchange, data reuse, digital data formats used, and employee counts and locations.
Keywords: Product data management (PDM); product lifecycle management (PLM); data exchange; small and medium enterprises; computer-aided design (CAD)
Introduction
Small engineering firms usually operate in challenging environments – many are subject to the whims of their customers, who are typically larger, more well-known manufacturers ( Towers & Burnes, 2008 ). This changes the normal design process model, where the company must “talk to customers” and make sure they are producing a product “that customers want.” Instead, these small and medium enterprises (SMEs) are usually given very specific details to which their product must conform in order to meet their customer’s specifications ( Arendt, 2006 ). Sometimes this requires SMEs to be very flexible in their choice of product lifecycle management (PLM) tools, based on how many different customers they are serving.
Products are increasingly being designed with three-dimensional (3D) tools that enable a host of different analyses, simulations, and design changes. Unfortunately, the software that enables this new design methodology is not nearly as accessible to SMEs as it is to larger, more robust manufacturers. Although their customers most likely have created the requisite network infrastructure for their 3D product data due to the sheer volume and breadth of the data, many SMEs have not yet adopted any formal strategy for managing their product data for their own smaller, yet complex, design methods ( Hicks, Culley, & McMahon, 2006 ). This main impetus of this study was to examine the inexperience of SMEs in the use of 3D product design and data management tools, to understand the challenge SMEs face with regard to data management due to their inexperience, to identify their common product data management needs, and to better align technology with their core business goals.
The main research focus of this study was in product data management (PDM), which is a technology that seeks to manage, secure, control, and accelerate the product development process by ensuring that all product data, particularly product definition data, is stored in one secure, easily accessible and manageable location. Many PDM systems can be difficult and costly to install and implement, particularly in SMEs that have limited resources and potentially higher vulnerability to implementation failures ( Chen, Huang, Yang, Lin, & Chen, 2007 ). Along with the use of these systems come many organizational changes to which SMEs may be unaccustomed, such as increased collaboration between areas of the business and entities outside the business. However, their smaller size tends to allow the SMEs to be somewhat flexible in their technology implementations.
SMEs are typically classified as employing less than 500 people each, and they employed approximately 6.1 million U.S. citizens in 2006 in the manufacturing industry alone (Statistics about Business Size from the Census Bureau, n.d.). At the same time, SMEs have to compete for resources and market share in a manufacturing industry that is struggling to stay afloat since the unstable economic environment of 2008 to present. Manufacturing SMEs are in a particularly unique situation because of limited resources, increased level of flexibility, high amount of personal relationships within the company, and relatively low levels of bureaucracy, among other things ( Marri, Gunasekaran, & Grieve, 1998 ). These companies have been relatively slow to adopt new design technologies like 3D CAD, product lifecycle management philosophies, and product data management technology ( Walters, 2007 ). Many manufacturing and design SMEs still have not updated their systems and processes for reasons such as cost, having simpler product lines, or simply not needing to because of the specific product or product lines that they manufacture and sell ( Ayyagari, Beck, & Demirguc-Kunt, 2007 ). However, many SMEs have moved toward new methods of product design by doing the bulk of the design work with 3D CAD tools, and it is important to pinpoint the exact reasons why these organizations are updating and what levels of success they have had ( Dibrell, Davis, & Craig, 2008 ).
Through PLM an organization in the manufacturing sector is encouraged to consider work in terms of a product, instead of a process ( Ameri & Dutta, 2005 ). This usually means a reorganization to distance itself from a “departmental” environment where each department is like an isolated island and communication is deemed “over the wall” to a newer, more flexible design process that focuses on a single product or family of them, with specialists from different backgrounds collaborating together from the beginning of the product’s design phase all the way through its disposal ( Sääksvuori, & Immonen, 2005 ). Thus, it is useful to get a better picture of what drove manufacturing SMEs to make such drastic changes to their business processes, adopt new PDM technology to manage all the newly generated data, and how this worked out. This research can be a good resource for small companies who are considering the same processes to remain competitive in their industry.
RESEARCH METHODOLOGY
In an effort to investigate the transition of SMEs toward integrated product lifecycle technologies and systems, two simple research questions were developed. What are the common traits of small and medium manufacturing businesses that have adopted a digital product data management (PDM) system? Furthermore, how has this PDM technology affected them? This study used mixed-method data collection schemes because of the complex nature of the research questions and the number of variables. Because the subjects are companies, which even on a small scale can be incredibly complex, a combination of preliminary interview feedback and broader survey methods proved to be the most useful strategy to employ. The study consisted of four preliminary interviews with targeted PDM experts that covered broader PDM issues relative to communication with suppliers and customers; it also considered how PDM technology has affected those processes. From these interviews, a survey was developed, which was validated by a PDM expert in the aerospace industry because of the industry’s exposure to supply chain variation and small and medium enterprises. The survey included five-point Likert scale and multiple choice questions, as well as free-response questions ( Dillman, 2007 ). The responses to these questions tended to illustrate the aspects of PDM implementation that SMEs benefit from, as well as the elements that they tended to have more difficulty getting through. From these responses, conclusions were made about the experiences SMEs have had relative to implementing and using PDM.
Because of the relative lack of previous literature examining manufacturing SMEs in the United States, a short interview was held with four different experts in PDM implementation and management in companies where this has become prevalent ( Myers & Newman, 2007 ). Although not all of the subject matter experts were employed by small or medium companies (in terms of the definition for this study) they were asked what their relationships were with their suppliers, who tended to be small or medium companies, and how they dealt with the differences in PDM capability. After the interview recordings were fully transcribed, qualitative discourse analysis methods were used to extract the main idea threads from the dialogue ( Strauss & Corbin, 1998 ). The basic strategy for coding the transcribed interviews was to summarize general ideas, organize and rank these concepts based on frequency, and then create basic concepts for which quantitative survey questions would be based ( Glaser & Strauss, 1967 ). This required approximately three to four passes through the transcript to both generate codes and group them appropriately. Major themes that emerged from these interview transcripts were issues around data retrieval, exchange, and formatting; PDM as a technology; and the information technology resources necessary for PDM care and maintenance; user interaction barriers; and levels of financial investment required to support the PDM environment. These main ideas were used to create survey questions that would best identify the important traits for SMEs that were either contemplating or currently using engineering design systems technology. For the purposes of this study, the label “engineering design system” was used in the survey to describe a digital system that is used to track, control, and secure product definition data. This choice was made for several reasons: (a) the term “PDM” is not common within the SME space, (b) to reduce confusion between the terms “PDM” and “PLM” and their use in the SME space, and (c) to prevent respondents from discounting their system if it happened to be informal or internally developed.
Survey questions were developed based on these themes. The initial subset of survey questions were meant to form a framework for the characteristics of a small manufacturer. Questions such as number of employees, industry, and level of digital design were meant to give background for each company and give statistics on the true characteristics of the sample responding to the survey. Questions also included whether or not a company had a system set up specifically for handling engineering design data. If a respondent reported that the company did not, that person was automatically taken to the end of the survey and thanked for their time. If the respondent answered that the company did have an engineering data system of some sort, that person continued with the survey. Questions were also added to give a more accurate portrayal of the expertise of the survey taker by asking what their level of involvement was with the data management system. Other questions were based on the broader themes that were drawn from the qualitative interviews, such as methodologies for using the PDM system, workflow usage, opinions on how the PDM has affected the design process, and investment characteristics. Another major theme that generated a few different questions was the level of system integration between both the small manufacturers and their customers/suppliers, as well as within their own organizations.
DESCRIPTIONS OF SURVEY RESPONSES
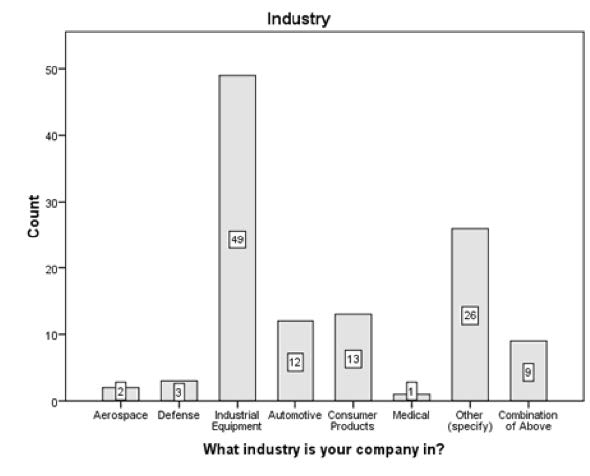
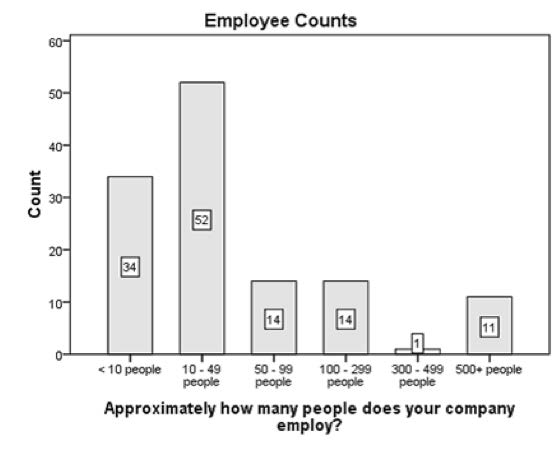
Due to the nature of the data, the analysis includes discrete measures (averages and percentages of scores and frequency analyses). The large part of the analysis of quantitative data is the search for variable relationships and comparing and contrasting data between companies. This was accomplished using Pearson chi-square tests by comparing response levels between two independent variables, such as company size and PDM use. The overall goal of this research was to confirm similar studies to a degree while at the same time exploring critical factors about PDM implementation that have not yet been explored, specifically in the United States. Therefore, a survey was the most expeditious method to gain useful information from small manufacturers. The initial contact email was sent out to 2,200 potential participants across the United States. The majority of survey responses came during the first two days that the survey was opened. Within two weeks, 100 completed responses and 40 partial responses were received. The initial part of the survey asked general questions about the respondents’ company’s characteristics. Figure 1 explains the industry sector distribution for this study, and Figure 2 details the size of the companies that responded to the survey.
Respondents who reported more than 500 employees in their businesses were removed from the sample. Of the completed responses, 42 respondents stated that the company used an engineering design (PDM) system. Despite the relatively low number of respondents for this portion of the survey, a number of interesting relationships were found that will be explored.
It is important to first discuss the business demographics from the survey sample because this provides a context for the results. These were not multinational companies with substantial IT resources. These were companies that often have people performing more than one organizational role without dedicated IT support. It quickly became clear that the majority of the small manufacturers classified themselves as being in the industrial equipment industry. They were about evenly split between having an engineering design (PDM) system and not having one, but the vast majority of them had fewer than 50 employees, versus some of the other industries such as companies in the automotive and other categories, which were more evenly dispersed in terms of employee counts. This is reflective of the manufacturing industry in the United States in general; whereas larger corporations make up the majority of the industry by sheer employee counts, there are far more individual smaller companies than large ones, and thus it makes sense that more small companies responded to the survey.
The final question targeted at the entire sample of survey respondents also caused the sample to be split into two specific groups: companies that have a digital design system of some sort, and those that do not. Respondents answering this question with a “no” were taken to the end of the survey and thanked for their time, since the subsequent questions would be about a system they did not have. Table 1 represents the relationship between presence of an engineering design system and basic company characteristics. The chi-square values indicate that there were no significant relationships between company characteristics and whether the company used an engineering design system.
| Variable 1 | Variable 2 | Chi-‐square |
|---|---|---|
Industry |
Presence of an engineering design system |
.583 |
# of Employees |
.098 |
|
# of Locations |
.44 |
|
Digital format used |
.071 |
|
OEM/Supplier/Both |
.722 |
COMPARISONS OF COMPANIES WITH ENGINEERING DESIGN SYSTEMS
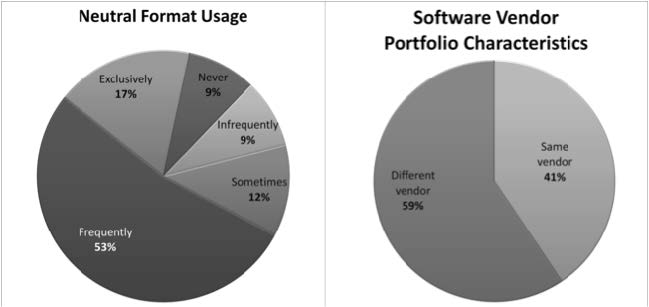
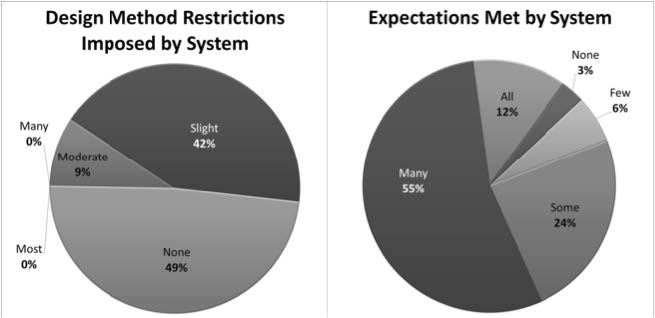
Several general findings were discovered from the data, as described in Figure 3. According to the survey respondents, they used neutral file formats frequently and tended to get their software from different vendors. Their design systems did not pose any major restrictions on their engineering processes, and their systems generally met their expectations. In many instances, the use of neutral files in data exchange and the use of multiple software tools (and the accompanying discontinuity of data usage) had a direct effect on the success of collaborative activities using digital product data.
Though important conclusions can be reached based on basic metrics, there are also relationships between different variables, such as level of involvement in the system when compared with the perceived effect on the time it takes to find information to perform a task. Other relationships include the frequency of exchanging data with outside entities versus how the system has contributed to concurrent engineering, and the use of neutral file formats versus the organizational group that manages the design system. Table 2 represents the characteristics of companies that responded to the survey as having an engineering design system. It is a subset of the companies represented in Table 1. Based on the amount of responses returned and the number of variables examined, Table 2 includes those variables that formed a statistically significant relationship based on their chi-square values.
| Variable 1 | Variable 2 | Chi‐square |
|---|---|---|
Digital Design Format |
Industry |
.060 |
Engineering Design Locations |
# of Employees |
.000 |
OEM, Supplier, or both |
# of Employees |
.118 |
OEM, Supplier, or both |
Digital design format |
.200 |
System maintenance group |
Neutral file format usage |
.013 |
System meets expectations |
Involvement Level |
.156 |
System meets expectations |
Restrictions on design methods |
.090 |
System meets expectations |
Contribution to concurrent engineering |
.004 |
System meets expectations |
Data exchange frequency |
.046 |
Contribution to concurrent engineering |
Data exchange frequency |
.052 |
Restrictions on design methods |
Data exchange frequency |
.000 |
Effect on informational retrieval time |
Effect on design task time |
.018 |
Effect on information retrieval time |
Involvement Level |
.025 |
Effect on information retrieval time |
Data sharing beyond Engineering |
.027 |
Workflow usage |
Data sharing beyond Engineering |
.136 |
Workflow usage |
Data entry point during design |
.065 |
System upgrades |
Data entry point during design |
.115 |
An interesting relationship was found between involvement level and attitudes toward how the system enables the finding of information. As seen in Table 2, It appears that users who rated themselves as “very involved” tend to feel that the system makes finding information slightly faster, whereas those who rated themselves as “extremely involved” feel the system makes finding information much faster.
Another interesting correlation (χ² = .027) that proved to be significant was the connection between whether an engineering design system shares data beyond just engineering, and how much effect the system has on finding information for a task. Respondents whose design system shares data tend to strongly feel the system makes finding information for their tasks faster, either slightly or much faster. This may due to the fact that the design tasks in an integrated design system must pull information from more sources, and thus a centralized location for data made finding information easier.
It also appears that respondents whose companies frequently exchange data with their customers and suppliers – more than a few times each week – tend to feel that their engineering design systems do not place many restrictions on their engineering design process (χ² = .000). This could be because the data exchange capabilities of their design system save them time in other ways that affect how respondents feel about the restrictions the system puts on them, or there could be other reasons for this correlation.
Another correlation between variables was the one between the level of concurrent engineering these design systems tend to create, and how the systems met expectations (χ² = .004). It appears that as systems tend to contribute more to concurrent engineering, respondents felt the systems met more and more of their expectations. That’s partially to be expected considering that product lifecycle management as a concept is based on the idea of concurrent engineering and product focus rather than process focus.
DISCUSSION
Several compelling findings were gleaned from the data, such as that the primary usage of engineering design systems is the storage 9 of manufacturing information for these small businesses, and they use neutral file formats frequently. They also tend to get their software from different vendors, but believe that their design systems do not pose any major restrictions on their engineering processes and their systems generally meet their expectations. There also seems to be interactions between different variables, such as level of involvement in the system when compared with the perceived effect on the time it takes to find information to perform a task. Others include the frequency of exchanging data with outside entities versus how the system has contributed to concurrent engineering, and the usage of neutral file formats versus the organizational group that manages the design system.
Two variables in particular stood out as having some effect on whether or not a company adopted a digital engineering design system: number of employees (χ² = .098), and the type of digital formats used to define design (χ² = .071). It makes sense that both of these variables are connected to the presence of a design system because typically a company that has adopted digital formats as a method to define design needs places to store, manage, and archive all this data over time. Software vendors that sell 2D and 3D design tools also often have file management tools of some sort that they may offer to companies for a lower price when bundled with the design tool itself. Also, companies that use 3D tools were more likely to have a system versus companies than used 2D tools. This is an interesting distinction, which can best be explained by the fact that 3D software vendors more often have a system that can be bundled with the 3D tool itself that was designed to be integrated together. The 2D tools may lack associative part management, which, for a company that does not necessarily need to maintain referential integrity between part files, could make a separate digital system for storing and managing 2D part files seem like a waste of resources.
Over 75% of respondents to the second part of the survey about engineering design systems reported that they were very or extremely involved in the system at their company. This is a generally good marker that the rest of the answers were relatively reliable, because it means that respondents were most likely generally knowledgeable about the systems used at their companies and their answers would be credible. Respondents also report that they used their systems primarily to store manufacturing information, and then as a general repository for data and product structure management and bills of materials. This indication, that the main use of engineering design systems is to store manufacturing information, is an interesting result given that the traditional PDM tool is built mostly for engineering design itself and typically must be modified or added to better support manufacturing information. It also shows that these small manufacturers are not in the “PLM” mindset, in that they were focused more on their processes than the product itself, which may be a good thing for them at the present time, but in the long term it may not be conducive with growth, given the advance of technology and competition.
The speed of tasks, particularly doing a design task and finding information, is usually the major benefit cited by companies who have adopted a robust PDM system ( Philpotts, 1996 ). This benefit is also reflected in this study’s sample of small manufacturers, where the majority of respondents reported that their system makes design tasks faster or has no effect, and finding information in particular is either slightly or much faster.
Because these small manufacturers have relationships with multiple suppliers and customers, they happen to exchange data with these outside entities on a relatively frequent basis: most companies exchange data at least a few times a week, if not daily. This shows that these smaller manufacturers are in constant contact with their suppliers and customers, which can help to avoid unplanned costs and miscommunication errors. However, even though they frequently exchange data with outside entities, only a few use their design systems to interface directly with the customer or supplier. This may be due to the lack of integration between systems, or in some cases, there is simply no need to have an automated process to exchange data between companies. All interviewees during the first part of the study cited high costs associated with integrating suppliers into their system, and likewise some survey respondents cited high costs to maintain fully integrated systems with their customers. However, these small businesses are still operating as islands of data with manual, more closely scrutinized exchanges of data with outside companies.
Although new research suggests that PDM implementation is most successful when it originates and is managed by the IT group in a larger corporation, most groups in the sample reported that their engineering design systems are managed by their engineering groups ( Jackson, 2010 ). This may be because specific groups of employees dedicated to IT, especially in companies with fewer than 50 people, are difficult to find. However, this may also be a disadvantage because people who are not experts in system management and project management are in charge of such a business-critical system. It is important to mention here, too, that more than a few respondents reported that their design systems were written and maintained internally, implying that their companies do not buy specially designed system software to handle engineering data, but instead they write their own using Microsoft Access or other easily available software development tools. This is an interesting phenomenon that would probably not be seen outside the small business arena.
Contrary to popular belief, a small majority of respondents reported that their design system software, including 3D/2D design tools, was not written by the same software vendor. This may be due to the relatively slow process of adopting technology at small manufacturers and a lack of system planning due to a piecemeal implementation of different business systems ( Lee, Bennett, & Oakes, 2000 ). It could also be because the engineering software industry has yet to produce a truly integrated, cohesive package of software that serves the needs of small and medium manufacturers without being too complicated or expensive.
How PDM systems change the business is one of the most important factors when trying to decipher how the use of these types of systems have affected the companies that have adopted them, which is part of the research question for this study. The last three questions in the survey dealt with how engineering design systems affected collaborative engineering, the use of clearly defined design processes, and whether or not the system met the expectations of the respondent. In a smaller company, each employee has a greater chance to interact with the engineering design system every day than might be seen in a larger corporation, and that level of familiarity may affect attitudes and impressions of the system itself. Most respondents felt that their design system had contributed to concurrent engineering, which is one of the main goals of PDM systems in general. But as an interviewee in the first part of the study pointed out, it is quite possible to use PDM systems in a manner that only further exacerbates the over-the-wall engineering problem. However, most respondents believed that their systems made a moderate or higher contribution to collaborative engineering, showing that these small manufacturers indeed use their systems as they were intended to be used.
CONCLUSIONS
Given the findings in this study, some conclusions can be made about common traits of small manufacturers who have implemented PDM-like systems. First, members of companies who have implemented PDM systems are generally happy with the way these systems have worked for them. They believed their design systems contributed to concurrent engineering, pose little or no restriction on their design method, and met most expectations for what they should be able to do. Locating information is significantly faster, and the system makes doing a design task faster as well, although to a lesser extent. Most of the small manufacturers in the sample exchanged data with outside suppliers and customers at least a few times per week, but this exchange is generally a manual process. The exchange does use neutral file formats extensively, that is, either neutral 3D or 2D file formats. Inside the business, companies share data from their engineering design system with manufacturing systems and purchasing systems, but most do not use workflows as a way to automate the flow of data within the design system. They tend to upgrade their software either every year or every 2-4 years, most likely depending on the nature of their licensing agreement with the commercial software provider, or whether they have created their own homegrown system for managing engineering data. Most companies enter data into their design systems as early as possible and use it throughout the design phase of their products.
In reviewing this study, the researcher came across an interesting revelation: small manufacturers are very enthusiastic about what they do. After the initial survey was sent out, the researcher received several emails from managers and owners of small businesses who were curious about the results of this study. They seemed genuinely interested in this topic because it is an issue they struggle with every day, but in some respects they felt disenfranchised because they rarely have the resources to commit to an extremely robust system. They write their own systems, they do much of their data management manually, and at times they seem to be out of the loop of the ever-advancing manufacturing industry and all its leading-edge technology. Alternatively, they feel that they are at the mercy of their larger original equipment manufacturer (OEM) customers to conform to what the customer requests, often a huge investment in system infrastructure that is burdensome to them. But, they are also the same suppliers and small OEMs that enable larger OEMs to focus their manufacturing efforts on other things. At the federal and academic levels, many programs are in place to help these small businesses thrive, because they truly are one of the driving forces in the U.S. economy. At the same time, there is an acute lack of academic research on these same businesses, including what they are currently doing, what they want to do in the future, and where they fit into the grander scheme of manufacturing economics. This study was mainly concerned with what SMEs are currently doing to manage data in an increasingly digital world where forces beyond their control have started to make them carry out their design and manufacturing in new ways. However, the real question is what this segment of the manufacturing industry will do in the future. How can small manufacturers be enabled to step into the world of PLM and PDM in a way that is cost effective for them but will encourage growth and change while using their unique advantages to help them get ahead? Finally, more research should be conducted that will illuminate more traits of small manufacturers and find better solutions to help address their unique needs.
Karen Waldenmeyer is currently a Cloud Automation Engineer at General Electric based in Cincinnati, Ohio. She is a member of Gamma Rho chapter of Epsilon Pi Tau.
Nathan Hartman is an Associate Professor in the Department of Computer Graphics Technology at Purdue University and Director of the Purdue University PLM Center of Excellence. He is also Director of the strategic research area in Advanced Manufacturing in the College of Technology. He is a member of Gamma Rho chapter of Epsilon Pi Tau
References
Ameri, F., & Dutta, D. (2005). Product lifecycle management: Closing the knowledge loops. Computer-Aided Design & Applications , 2, 577-590.
Arendt, R. J. (2006). SME-supplier alliance activity in manufacturing: contingent benefits and perceptions. Strategic Management Journal , 27(8), 741-763. doi:10.1002/smj.538
Ayyagari, M., Beck, T., & Demirguc-Kunt, A. (2007). Small and medium enterprises across the globe. Small Business Economics , 29(4), 415-434. doi:10.1007/s11187-006-9002-5
Chen, S., Huang, J., Yang, C., Lin, W., & Chen, R. (2007). Failure evaluation and the establishment of an improvement model for product data management introduced to enterprises. The International Journal of Advanced Manufacturing Technology , 35(1), 195-209. doi:10.1007/s00170-006-0705-1
Dibrell, C., Davis, P. S., & Craig, J. (2008). Fueling innovation through information technology in SMEs*. Journal of Small Business Management , 46(2), 203-218. doi:10.1111/j.1540-627X.2008.00240.x
Dillman, D. A. (2007). Mail and Internet surveys (2nd ed.). Hoboken, NJ: John Wiley & Sons.
Glaser, B. G., & Strauss, A. L. (1967). The discovery of grounded theory . Chicago: Aldine Transaction.
Hicks, B., Culley, S., & McMahon, C. (2006). A study of issues relating to information management across engineering SMEs. International Journal of Information Management , 26(4), 267-289.
Jackson, C. (2010). The CIO’s role in PLM . Aberdeen Business Review. Aberdeen Group.
Lee, G., Bennett, D., & Oakes, I. (2000). Technological and organisational change in small- to medium-sized manufacturing companies: A learning organisation perspective. International Journal of Operations & Production Management , 20(5), 549 - 572. doi:10.1108/01443570010318922
Marri, H. B., Gunasekaran, A., & Grieve, R. J. (1998). An investigation into the implementation of computer integrated manufacturing in small and medium enterprises. The International Journal of Advanced Manufacturing Technology , 14(12), 935-942. doi:10.1007/BF01179084
Myers, M. D., & Newman, M. (2007). The qualitative interview in IS research: Examining the craft. Information and Organization , 17(1), 2-26. doi:10.1016/j.infoandorg.2006.11.001
Philpotts, M. (1996). An introduction to the concepts, benefits and terminology of product data management. Industrial Management & Data Systems , 96(4), 11 - 17. doi:10.1108/02635579610117467
Sääksvuori, A., & Immonen, A. (2005). Product lifecycle management . Basel, Switzerland: Birkhäuser.
Statistics about Business Size from the Census Bureau. (n.d.). Retrieved February 24, 2009, from http://www.census.gov/epcd/www/smallbus.html
Strauss, A., & Corbin, J. (1998). Basics of qualitative research: Techniques and procedures for developing grounded theory (2nd ed.). Thousand Oaks CA: Sage Publications.
Towers, N., & Burnes, B. (2008). A composite framework of supply chain management and enterprise planning for small and medium-sized manufacturing enterprises. Supply Chain Management: An International Journal , 13, 349-355. doi:10.1108/13598540810894933
Walters, A. (2007). Challenges in managing the convergence of information and product design technology in a small company. Management of Engineering and Technology, Portland International Center for, 799-806. doi:10.1109/PICMET.2007.4349397