JSTE v47n2 - Evaluating the Impacts of Technology Education on Military Maintenance Students
Evaluating the Impacts of Technology Education on Military Maintenance Students
Jeremy D. Jordan
Air Force Institute of Technology
Christopher Curtis
Air Force Research Laboratory
Abstract
The United States Air Force (USAF) provides career and technical education (CTE) to a wide variety of specialty career fields. Training airmen to carry out the mission while honoring the USAF core values of integrity first, service before self, and excellence in all we do is the top priority of military leaders and trainers. Vehicle maintenance is especially important as one minor malfunction could cause multiple injuries and deaths. Vehicle maintainers are thus trained in grueling learning environments and follow arduous regulations to ensure the utmost adherence to standards. This paper presents the findings of a recent study at the Port Hueneme Naval Station in California, home of the technical school of Air Force Vehicle maintenance. The results focus on three specific areas that contribute to performance: student learning preferences, Armed Services Vocational Aptitude Battery (ASVAB) scores and other personal characteristics, and a comparison of alternate training aids.
Introduction
Training students to reach their potential and go beyond their abilities should be at the forefront of a leader’s motivation and goals. This is true in any arena – high schools, technical schools, undergraduate institutions, graduate schools, and the U.S. military. This concept is especially important in today’s military training schools. Reduced manning and higher operational tempos seen by the U.S. Military has given enlisted personnel increasingly greater responsibilities earlier in their careers and forced them to take on more important roles in the mission of the United States Air Force (USAF). Vehicle maintainers are responsible for ensuring their assigned piece of equipment is operating flawlessly at all times. The Global Deicer is no exception; operators extended 50 feet in the air to de-ice an airplane expect minimal complications with their machinery. It is thus extremely important to make certain Global Deicer maintenance troops are instructed in the finest environment with the most advanced methods available. In fact, tight budgets and increased demand for skilled personnel has the Air Education and Training Command (AETC) constantly looking for more effective methods and tools to deliver that training. One such innovation that was explored recently was the Wiring, Signal Tracing, and 3D Interactive Training Tool developed by Tools for Decision (TFD). TFD claimed their tool would reduce the time needed to teach complex systems, improve student understanding of complex electrical, hydraulic and pneumatic schematics, and result in overall improvement of student performance. As part of AETC’s assessment of the new tool, the Air Force Research Laboratory (AFRL) was invited to perform a study on the tool’s effectiveness in improving training. The purpose of the study was to determine the effectiveness of the new tool in instructing new students. The idea being tested is whether or not the new Wiring, Signal Tracing, and 3D Interactive Training Tool will have an effect on student performance with a null hypothesis of no effect. The research questions we examined were:
- Will the new tool increase the understanding of the subject material?
- Will the new tool improve performance of the students?
- Will the new tool reduce the amount of time needed to conduct the course?
- How does instruction methodology/delivery affect student performance based on student learning preferences?
- Can we use test scores from the Armed Services Vocational Aptitude Battery (ASVAB) to forecast student performance?
- How do student characteristics such as intellect, extraversion, need for cognition, and age affect performance?
Each of these questions is answered through a series of analyses. Data is collected from each student and used to answer the proposed questions. The following section gives details and the methods used in the study.
Method
To understand the best manner in which to teach the students, the instructors must first understand their students’ differences in learning preferences and demographic compositions. Certain types of students will flourish in different environments. The best way to understand these students is through honest communication in a non-hostile environment such as a non-intrusive survey. The enlisted personnel in this study have recently finished basic training and are very conscious of the power of leadership when they arrive at technical school. Instructor-student interaction may be an ineffective method of extracting information. More than likely, students will feel intimidated in an environment such as this and will not honestly convey their thoughts and feelings. For this reason, an outside researcher engaged the students with a written survey to capture characteristic and preferential data. The survey was administered to 95 (90 males, 5 females) military students stationed at the Naval Surface Warfare Center, Port Hueneme Division in Port Hueneme, CA. The students were attending courses at the Air Force Maintenance Training Facility, Detachment 1, 345th Training Squadron on base. Several short courses make up the training environment; this study is concerned with a detailed maintenance techniques course on the Global Deicer.
The study is broken into three sections examining various aspects of the students. The first section contains a review of the learning preferences of the students. There exists a widely accredited idea that a student’s performance is related to the preference in which they approach a learning situation and the manner in which that learning situation is presented. Four distinct learning preferences seem to emerge from studies of individuals. From these, a teacher can tailor teaching styles to accommodate student learning preferences. The idea of differing learning preferences among individuals is pervasive in the educational literature ( Fleming, 1995 ; Felder & Spurlin, 2005 ; Felder & Silverman, 1988 ), yet there are still skeptics ( Kratzig & Arbuthnott, 2006 ). The literature reveals opposing views on the idea of learning preferences as well as the effects of matching instruction techniques to learning preferences. Nevertheless, a menagerie of research has been devoted to revealing an adequate measure of learning preferences and numerous scales exist. A popular construct and questionnaire is the V.A.R.K. developed by Neil Fleming ( Fleming, 2006 ). This survey is used to determine how students prefer to take in and give out information, and thus can be used to enhance learning. The survey has been used on numerous occasions in the literature ( Baykan & Nacar, 2007 ; Slater, Lujan, & DiCarlo, 2007 ; Lujan & DiCarlo, 2006 ; Wehrwein, Lujan, & DiCarlo, 2007 ). Students learn in different ways, and there is value in understanding the students’ learning preferences.
In the second section, we explore the relation of various factors and their effects on student performance at the school. Several factors are explored including Armed Services Vocational Aptitude Battery (ASVAB) scores, intellect, need for cognition, extraversion, and age. The ASVAB is a test administered to military recruits to determine proper placement in the field ( ASVAB, 2009 ). Scores are analyzed and used to place military troops in specific jobs based on their performance in 9 major areas:
- General Science
- Arithmetic Reasoning
- Word Knowledge
- Paragraph Comprehension
- Mathematics Knowledge
- Electronics Information
- Auto and Shop Information
- Mechanical Comprehension
- Assembling Objects
In the study, five composite category scores from the ASVAB are examined; Administrative, Mechanical, General, Electrical, and the Armed Forces Qualification Test (AFQT). The Administrative score is computed from word knowledge and paragraph comprehension areas of the ASVAB. The Mechanical score is computed from the mechanical comprehension, general science, and auto and shop information areas. The General score is derived from the word knowledge, paragraph comprehension, and arithmetic reasoning areas. The Electrical score is computed from the arithmetic reasoning, mathematics knowledge, electronics information, and general science areas of the ASVAB. The Air Force Qualifying Test (AFQT) is a percentile score between 1 and 99, indicating the percentage of testers that scored at or below the score obtained. The AFQT is comprised of the arithmetic reasoning, mathematics knowledge, paragraph comprehension, and word knowledge areas of performance.
Intellect and extraversion are two of the Big-Five factors discovered by Lewis Goldberg ( Goldberg, 1992 ). Extraversion includes students who are talkative, assertive, verbal, energetic, active and daring. Conversely, a low extraversion score indicates individual characteristics such as shy, quiet, reserved, inhibited, withdrawn and timid. High intellect scores describe a student who is creative, complex, imaginative, bright, philosophical, innovative and introspective. Need for cognition is the tendency for an individual to engage in and enjoy thinking and has been developed and validated in the literature ( Cacioppo & Petty, 1982 ). Understanding the students at this level may give the instructors additional firepower to be one-step ahead in their training techniques.
Finally, an evaluation of the performance of the Wiring, Signal Tracing, and 3D Interactive Training Tool developed by Tools for Decision (TFD) Group is performed. Student performance data were collected to assist in analyzing the effectiveness of the wire tracing tool. TFD hypothesized this training tool would reduce the time needed to teach complex systems, improve student understanding of complex electrical, hydraulic and pneumatic schematics and circuitry, and result in an overall increase in student performance. The 3D interactive computerized training aid is used to teach future mechanics how to maintain/troubleshoot the Global Aircraft Deicing Vehicle. The training tool is computer based and provides detailed displays of electrical, hydraulic, and pneumatic circuits. Complex schematics are simplified by displaying one function per screen, and providing hyperlinks to other screens showing related tasks. Additionally, color-coded animations are used to trace electric, hydraulic, and air flow through various circuits. The implementing organization expects to lessen the time needed to teach complex systems while improving the overall quality of instruction. They also anticipate a cost reduction by reducing the number of operational assets committed for use as training aids. Other projected benefits include increased student comprehension/retention and faster trouble shooting during performance exercises. The school house also hopes to reduce student wash-back and attrition rates attributed to vehicle complexity. The results of this final section will allow AF organizations to make informed decisions regarding future course automatons.
V.A.R.K. Analysis Results
It is important that an instructor understand the learning preferences of their vehicle maintenance students. By understanding their learning preference tendencies, instructors can further tailor their teaching programs to benefit the students’ learning. The V.A.R.K. survey was given to the students as part of the survey mentioned above and is referenced in (Fleming, 2006).
The four categories of learning are defined as visual (V), auditory (A), read/write (R), and kinesthetic (K). A student may have one preferred preference or multiple preferred preferences at varying strengths. When multiple learning preferences are present, a student is considered multi-modal. There are positives to each style, multi-modals can learn in many different settings; however normally need to exercise all of these preferences to truly understand something. A student with a single preference is limited in the environments where he learns well. However, once his preferred mode of learning is achieved he will understand whatever is being presented completely.
Evidence suggests ( Fleming, 2006 ) that males tend towards kinesthetic learning while females prefer a read/write style of learning, our research affirms this (see Figures 1 and 2) as the majority (95%) of the students are male. Figure 1 shows that the majority of maintenance students are multi-modal. Figure 2 shows the breakdown of the 78% of multi-modal learners in Figure 1. Figure 3 shows the overall first preferences (a combination of Figures 1 and 2) of the students. Kinesthetic is the preferred method while read/write comes in a close second. The majority (69%) prefer kinesthetic and read/writing as a learning preference.
Different vocations tend to have different learning styles as well, and kinesthetic learners will most likely gravitate towards occupations where hand-use is prevalent such as mechanics. Being aware of the majority of students’ learning preferences in one’s domain helps teachers and leaders develop more efficient training techniques. Knowing the majority of the maintenance students prefer one type of learning over another should lead the squadron’s management to put additional resources towards this type of learning. Since the majority of the students are kinesthetic and read/write, the leaders should not spend more time in the classroom speaking to the students, but rather more time outside handling the vehicle and possibly forcing them read and write more about what they’re learning. Students would benefit from spending more time exploring the actual Global Deicer vehicle and being allowed to practice on the wiring itself. Another idea is to hand out reading material regarding the wiring schematics, as well as pushing the students to write their own descriptions of the material they are learning.
Additional recommendations and further guidance can be obtained at http://www.vark-learn.com.
Individual Characteristic Analysis Results
In addition to learning preferences, the survey administered also collected the students Armed Services Vocational Aptitude Battery (ASVAB) scores, intellect, extraversion, and need for cognition. Performance check test scores, final test scores, and an instructor rating were also gathered as dependent variables. This section answers several questions and explores some of the relationships between variables.
The performance check is given after 3 days of classroom exposure to the written material; the students haven't physically worked on the vehicle at the time the test is given. The students are allowed to repair the actual vehicles with their hands the following week before the final test is given. Interestingly, the kinesthetic learners are the lowest performers on the initial performance check and the highest performers on the final test. They start performing well after they have spent hands-on time with the vehicle. The kinesthetic learners are the only group who showed any significant variation between the performance check and the final test, see Table 1. This shows the necessity of allowing the students to spend a lot of time working on the actual vehicle. Finding other ways to reach the students with other learning preferences could also boost final test scores. These findings support the notion that matching instruction to learning preference increases student performance as discussed earlier in the methods section.
| Written PC Average | Final Test Average | Statistically Different? | |
|---|---|---|---|
| Aural | 87.86 | 86.43 | No |
| Kinesthetic | 81.14 | 90.86 | Yes |
| Read/Write | 88.57 | 86.43 | No |
| Visual | 86.00 | 83.00 | No |
Does a student’s age affect their performance? It may be possible to better organize learning groups based on the students’ ages. Rather than putting all the young students in one group and the older students in another group, the instructors could put one of each age group into a learning group together to increase diversity. An ANOVA was performed on three age groups as shown in Tables 2 and 3.
| Age | Average Test Score | Standard Dev |
|---|---|---|
| 18-22 | 85.93 | 9.2 |
| 23-39 | 94.44 | 5.1 |
| 40+ | 87.14 | 12.2 |
| SS | MS | P-value | |
|---|---|---|---|
| Between Age Groups | 1040.160819 | 520.0804 | 0.002018 |
| Within Age Groups | 7201.944444 | 78.282 |
Consider a null hypothesis that age does not affect student performance in the course. Table 3 gives sufficient evidence to reject the claim that the three age groups come from populations with the same mean. There exists a significant difference between the three age groups, with the students aged 23-39 being the top performers on the written tests. The young students performed considerably lower than the middle age group. The reasons for this could include the fact that young newly enlisted troops have historically been known to prioritize social interaction during the first years of service as opposed to intense focus on mission. Reasons for lower scores from the oldest group may be the struggle to regain good study habits and loss of knowledge from high school shop courses. If study groups or learning teams are used during the course, it may be beneficial to better disperse the different age groups rather than allow a group of solely 40+ or 18-22 year-olds.
Learning preferences don’t appear to have a direct influence on test scores as shown in Tables 4 and 5. Although it appears the kinesthetic learners scored much higher than the visual learners, the number of data points led to an insignificant statistical conclusion. It is noted however that the visual learners were the lowest performers on the tests. This should lead the instructors to seek out additional visual learning aids in order to reach the visual learners more effectively.
| Learning Preference | Average Test Score | Standard Dev |
|---|---|---|
| Aural | 86 | 11.0 |
| Kinesthetic | 91 | 8.7 |
| Read/Write | 86 | 9.0 |
| Visual | 83 | 10.4 |
| SS | MS | P-value | |
|---|---|---|---|
| Between Learning Preferences | 491.8095238 | 163.9365079 | 0.14032 |
| Within Learning Preferences | 6182.857143 | 87.08249497 |
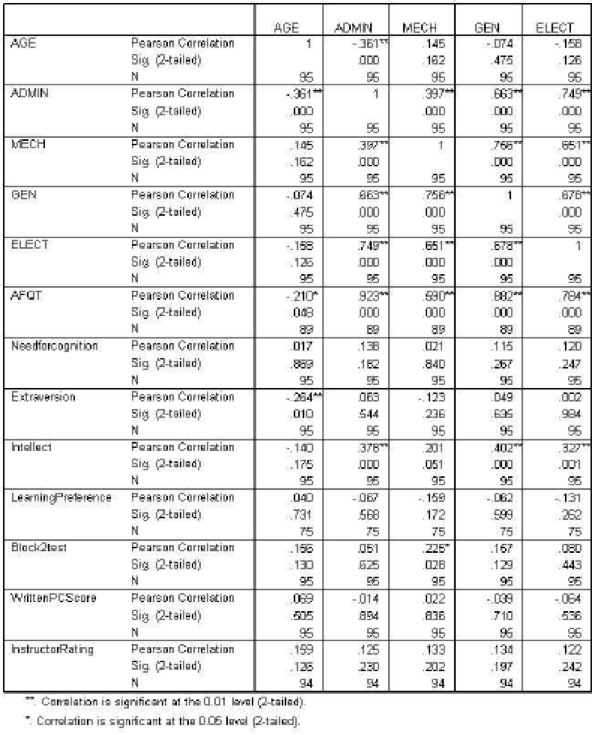
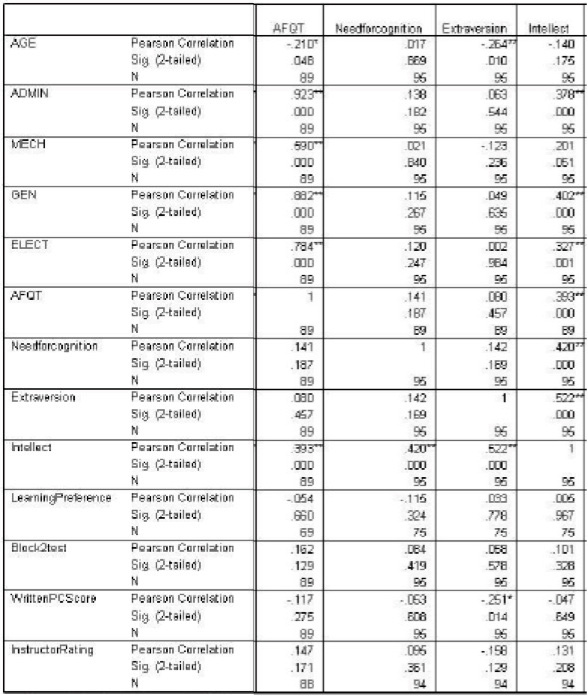
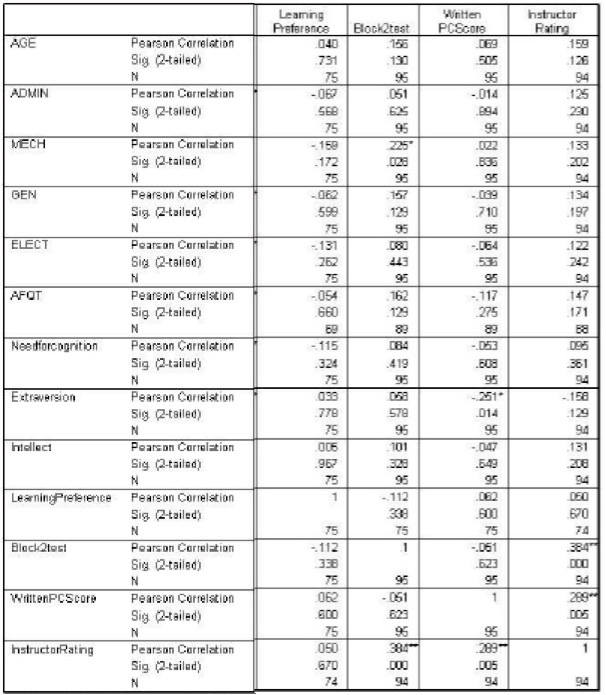
Correlations
It appears from the correlations table above that as age increases, AFQT and ADMIN scores decrease-the younger troops score higher. Younger students would have recently completed high school and thus are likely to still be relatively sharp in a learning sense.
It is no surprise that those students with higher mechanical scores on the ASVAB scored higher on the final exam; this is further validation of the ASVAB test. Those responsible for assigning professions to new enlistees can indeed use the mechanical scores as a means to place troops. Each of the correlations between the different parts of the ASVAB appears to be showing strong correlation. This indicates a general intelligence that seems to prevail over the entire test. If each score is correlated, the tester who does well on one part of the test will most likely achieve high scores on all parts of the test. In this sense, one would presume it difficult to make a judgment as to which nature of employment to place an individual. However, since the scores aren't perfectly correlated, some distinction is possible among enlisted recruits making the test useful.
Another interesting result is that as students increased in age, a significant decrease in extraversion was observed. As students age, they are less likely to be social and outgoing. Additionally, as the need for cognition increased (the desire to learn), intellect significantly increased. Those students who desired to learn more indeed did achieve higher intellect. Finally, instructor ratings were correlated with each of the measures of performance for the course. The instructors did a good job of rating individual competency during the course. In the next section, we examine the use of advanced technical training aids and their effects on student performance.
Technical Training Aid Analysis Results
The fabricators of the enhanced software program claim benefits such as increased learning and heightened knowledge of the maintenance required on the vehicle. Interestingly, test scores and independent performance evaluations paint a different picture. Table 6 shows justification that the scores using the new instruction program are in fact statistically identical to the scores using previous methods of instruction. For simplicity, prior method of instruction using the paper schematic is referred to as Method I while the new computer instruction method is Method II. The point estimate used from the independent samples is the sample mean, x̄ , an estimate of the true mean μ x̄ .
The measures of performance used to compare instruction Methods I and II include a written performance check score, the final test score, and an instructor rating of the overall competency of the student. The written performance check is given midway through the two week course giving the instructors an idea of student comprehension of the material. The final test score is given at the end of the course and is comprehensive in nature. Following the course, the instructor evaluates each student based on observations during the course and assigns a comprehension rating between 1 and 10, 1 being poor and 10 being excellent.
The original claim states this improved training technique will increase student performance and understanding. Since the null hypothesis must contain equality, H 0 : μ 1 = μ 2 , and the original claim is H 1 : μ 1 ≠ μ 2 . The probability of making the mistake of rejecting the null hypothesis when it is true is set at α = .01, this is the significance level. Thus the z statistic in Table 6 must be less than -2.575 if an increase in knowledge exists and above 2.575 a decrease in knowledge can be declared due to the enhanced training aid.
β
− Performance Check Scores
τ
− Final Test Scores
δ
− Instructor Rating
| x̄ | s̄ | n | z | Result | |
|---|---|---|---|---|---|
| β 1 | 85.70 | 13.73 | 121 | -.03 |
Fail to reject
H 0 : β 1 = β 2 |
| β 2 | 85.76 | 9.69 | 33 | ||
| τ 1 | 87.24 | 9.61 | 76 | .54 |
Fail to reject
I 0 : τ 1 = τ 2 |
| τ 2 | 85.82 | 8.38 | 79 | ||
| δ 1 | 6.81 | 1.68 | 86 | -1.02 |
Fail to reject
J 0 : δ 1 = δ 2 |
| δ 2 | 7.07 | 1.15 | 44 |
The point estimates of the performance check scores, test scores, and instructor ratings are similar, thus resulting in a z statistic that fails to fall in the critical region. A slight decrease in final test scores was observed, but not enough to declare statistical significance. Conversely, a slight increase in instructor rating occurred under the new method, yet not enough to be establish statistical significance. With mathematical surety, we claim the enhanced training technique fails to increase mechanical knowledge on the Global Deicer as measured by test scores and instructor ratings. Interestingly enough, prior to implementation of the new tool, students were polled to determine whether they felt a tool of this type would allow them to learn the schematics better. Of the students polled, 60% felt a computerized tool would increase their ability to learn the schematic, 21% thought a computerized tool would not help, and 19% were unsure. Additionally, 55% of the students felt this type of tool would increase their performance during parts of the course, 18% felt it would not increase performance, and 27% were unsure. There seems to be a common belief among young students that computerized teaching methods are better than traditional methods. This may be more of a 21st century preference than anything else. As demonstrated in the above analysis, a computerized tool did not change performance metrics. The students polled after implementation of the new tool slightly agreed (4.8 average on a 7 point scale) that the tool did make it easier for them to learn the schematic.
Conclusions/Recommendations
The importance of properly training our airmen cannot be ignored if we are to continue as the world's most respected Air Force. Understanding the vehicle maintenance students’ learning preferences allows the instructors to better equip their students with the material they need to perform at the highest possible levels. This is especially true for the kinesthetic learners in this maintenance course.
The relationships between the variables collected and course performance allow the instructors to preemptively spot students who may be potentially poor performers, and implement additional measures to assist them during the course. Since the learning preferences for the majority of the students are kinesthetic and read/write, the instruction should include more time working with the vehicle using the technical manuals. Additionally, the students should be pushed to summarize in writing what they’ve learned.
Younger or older students with low mechanical ASVAB scores and a visual learning preference may be at a disadvantage when entering the course. Accordingly, middle age students with high mechanical ASVAB scores and a kinesthetic learning preference could be matched up with these “at risk” students as learning buddies. If study groups or teams are used during the course, it would be beneficial to mix different age groups so that relatively younger or older students can leverage study habits of the medium age group. This could possibly decrease the wash-back rate and increase efficiency in the training environment.
The new computerized learning tool doesn’t appear to have any effect on student performance indicating that more traditional methods of instruction may be just as effective in certain areas of education. Thus, there is no reason to replace traditional instruction methods (i.e. paper schematics). If the new tool is being used in the field as a job aide, it may; however, be beneficial to learn the tool while in school to allow easy transition to the field. Finally, there may be other benefits not examined in this paper that warrant the implementation of the tool.
Jeremy Jordan is a Captain at the Air Force Institute of Technology. He can be reached at Jeremy.Jordan@us.af.mil .
Christopher Curtis is a civilian in the Air Force Research Laboratory. He can be reached at Christopher.Curtis@wpafb.af.mil .
References
ASVAB. Armed Services Vocational Aptitude Battery. [Online: http://www.official-asvab.com/index]. Accessed 23 July 2009.
Baykan, Z., & Nacar, M. (2007). Learning styles of first-year medical students attending Erciyes University in Kayseri, Turkey. Advances in Physiology Education , 31:158-160.
Cacioppo, J.T., & Petty, R.E. (1982). The need for cognition. Journal of Personality and Social Psychology. 42(1): 116-131.
Felder, R.M., & Silverman, L.K. (1988). Learning and teaching styles in engineering education. Engineering Education , 78(7): 674-681.
Felder, R.M., & Spurlin, J.E. (2005). Applications, reli ability, and validity of the index of learning styles. Intl. Journal of Engineering Education , 21(1): 103-112.
Fleming, N.D. (1995). I'm different, not dumb: Modes of presentation (V.A.R.K) in the tertiary classroom. In A. Zelmer (Ed.), Research and Development in Higher Education, Proceedings of the 1995 Annual Conference of the Higher Education and Research Development Society of Australasia (HERDSA), 18:308-313.
Fleming, N.D. (2006). VARK: A guide to learning styles. [Online: http://www.vark-learn.com/english/page.asp?p=questionnaire]. Copyright Version 7.0 (2006) held by Neil D. Fleming, Christchurch, New Zealand and Charles C. Bonwell, Green Mountain Falls, CO.
Goldberg, L.R. (1992). The development of markers for the Big-Five Factor structure. Psychological Assessment. 4(1):26-42.
Kratzig, G.P., & Arbuthnott, K.D. (2006). Perceptual learning style and learning proficiency: A test of the hypothesis. Journal of Education Psychology , 98(1): 238-246.
Lujan, H.L., & DiCarlo, S.E. (2006). First-year medical students prefer multiple learning styles. Advances in Physiology Education , 30:13-16.
Slater, J.A., Lujan, H.L., & DiCarlo, S.E. (2007). Does gender influence learning style preferences of first-year medical students. Advances in Physiology Education , 31:336-342.
Wehrwein, E.A., Lujan, H.L., & DiCarlo, S.E. (2007). Gender differences in learning style preferences among undergraduate physiology students. Advances in Physiology Education , 31:153-157.