JTE v22n1 - A Study of Mathematics Infusion in Middle School Technology Education Classes
A Study of Mathematics Infusion in Middle School Technology Education Classes
M. David Burghardt, Deborah Hecht, Maria Russo, James Lauckhardt, and Michael Hacker
The transition into the twenty-first century has led to a greater emphasis placed on student proficiencies in Science, Technology, Engineering, and Mathematics (STEM), with a particular focus on how these skills will help students thrive in the technological world and society. Most jobs require some level of mathematical proficiency, and mathematics skills are crucial for successful integration and independence in the home and community ( Patton, Cronin, Bassett, & Koppel, 1997 ). Yet, mathematical achievement in the United States has been below the level attained by students in other countries, with American students becoming notably behind once they reach late middle school ( U.S. Department of Education, 2008 ). To address these weaknesses, educators have developed various methods to increase student’s STEM content knowledge. These include, but are not limited to, furthering teacher’s professional development (PD) requirements, varying curriculum, and adding additional STEM classroom time.
One way to increase student competency in mathematics is to make connections between the STEM areas to assist in the student’s broader understanding of similar concepts and ideas. Connected curriculum is not a new pedagogical approach and has been recognized as an important teaching tool to assist student learning for many years ( National Research Council, 1996 ). The National Council of Teachers of Mathematics (NCTM) endorsed the use of mathematics as a connector, as it recommended connecting mathematics to situations from science, social science, and commerce as a way for students to increase their mathematical competence ( National Council of Teachers of Mathematics, 2002 ). Thus, a useful way to apply connected curriculum is to use mathematics as the thread that links Science, Technology, and Engineering curriculum together.
Unfortunately, there has been a paucity of research studying the effects of connected STEM curriculum, especially in regards to connecting mathematics to engineering/technology education (ETE). Preliminary research by Atkins and Burghardt (2006) investigated connected mathematics and ETE curriculum through the design and construction of a food dehydrator. When using mathematical skills to develop this project, it was found that all students benefited from the experience. More specifically, students in the bottom two quartiles showed the greatest improvement in mathematical reasoning and achievement.
As part of the general effort to promote research in connecting the STEM areas, a national invitational STEM Symposium( STEM Symposium, 2009 ) was held in order to develop recommendations and a research agenda for interconnected STEM teaching and learning. During the STEM Symposium 45, prominent STEM researchers, assessment specialists, school administrators, and STEM teachers met to discuss the importance of creating connections between these fields in the classroom. There was agreement across these groups of professionals that these connections will prove to be powerful in helping students learn Mathematical and ETE concepts and achieve a higher level of proficiency in these areas.
Bedroom Design Curriculum
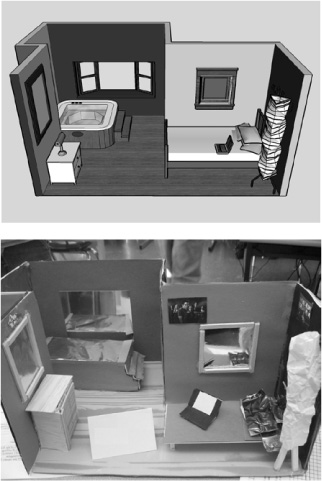
The present study was part of the Mathematics, Science, and Technology Project (MSTP), a National Science Foundation (NSF) funded Mathematics and Science Partnership Project ( MSTP, 2003 ), conducted by Hofstra University’s Center for Technological Literacy (CTL). MSTP’s goal was to improve mathematics teaching and learning in low performing middle schools in New York State. One way to accomplish this goal was through enhancing ETE curriculum with additional mathematical content, as well as providing teachers with PD in mathematics pedagogical and content knowledge to deliver this curriculum. In both the MSTP project and the current research, the term mathematics infusion was introduced as an approach to make the connections between mathematics and technology. Through infusion, mathematics is introduced in ETE curriculum at critical points, so it naturally fits with the material taught and makes connections between the disciplines. The curriculum that was selected for mathematics infusion in the present study was entitled Bedroom Design . This curriculum was developed and enhanced by MSTP’s principal investigators, consultants, and curriculum experts over three years, including two field test trials to ensure its feasibility to be taught in middle school classrooms. The Bedroom Design activity is a 20-day middle school ETE curriculum, which engages students in the planning, designing, and physical modeling of a “bedroom” that must meet specific cost and building requirements (e.g., the window area must be at least 20% of the floor area, the minimum room size is 120 square feet, the minimum closet size is 8 square feet, etc). Bedroom Design was considered a hybrid instructional model. It is hybrid because students first virtually model a bedroom through Google SketchUp (GSU), a 3D modeling program available at no cost from Google, then students build their virtual model using physical construction materials. Figure 1 provides a student example of the GSU virtual and physical model.
According to Robinson (1994) , in order for connected instruction to be successful, the lesson should support some aspect of instruction in the core subject area and should be constructed in a manner that encourages students to integrate and use new knowledge and skills from several areas of competence. The Bedroom Design curriculum accomplished this, as the curriculum is implemented using informed design, which is a validated design pedagogy developed through NSF projects conducted by the CTL ( Burghardt & Hacker, 2003 ). Informed design encourages students to increase their content knowledge before they suggest a solution to a problem, in order to be informed by prior knowledge, instead of trial and error ( Burghardt & Hacker, 2004 ). In an informed design activity, students expand their STEM knowledge and skill base by completing a series of short, focused tasks called Knowledge and Skill Builders (KSBs). The mathematical KSBs were the crucial Bedroom Design tasks that infused grade-related mathematics, enabling technology educators to reinforce mathematics within the technological context. There were a total of seven KSBs in the Bedroom Design curriculum. These included: geometric shapes, factoring, percentages, mathematics of scale, mathematical nets, aesthetics, and spreadsheets/pricing information.
Purpose of the Present Study
The present study examined the impact of introducing a mathematics infused ETE curriculum on students’ mathematics content knowledge and attitudes toward mathematics. The purpose of the present study was to: (a) compare the effects of a mathematics infused ETE curriculum and a control curriculum on student mathematical content knowledge, (b) compare the effects of a mathematics infused ETE curriculum and a control curriculum on student attitudes toward mathematics, and (c) examine if treatment conditions were equally effective for students’ whose mathematical levels were particularly below the average. It was hypothesized that students, even those below average, who participate in mathematics infused ETE curriculum will increase their mathematical conceptual knowledge and attitudes toward mathematics, and will improve these mathematics skills at a greater rate than students who receive the control curriculum.
Method
Participants
Student participants were from 8 th grade ETE classrooms in 13 middle schools in New York State (NYS). There were 15 teachers who taught the mathematics infusion lessons to a total of 598 students. The teachers had an average of 14 years of teaching experience, with a range from two to 33 years. Twelve teachers currently held master’s of education or a master’s of science in a related technological field and all were certified to teach Technology Education in NYS. There were 14 teachers who taught the control curriculum to 455 students. All of these teachers were certified to teach Technology; however, their years of experience and education were unknown, but expected to be comparable to infusion teachers.
Procedure
The study used a pre/post design to examine student change in mathematical content knowledge and attitudes toward mathematics following participation in the mathematics infusion curriculum. Data were collected from students in both the infusion and control classes. The total time to teach the Bedroom Design curriculum was 20 days (approximately 45 minute class period each day). However, due to various scheduling and/or other reasons, some ETE teachers went over the predetermined 20 days, ranging from 20 to 28 with an average of 24 days. As part of the design, each technology infusion teacher was paired with a control teacher (typically another technology teacher from the same middle school) who did not teach Bedroom Design, but instead taught the business as usual curriculum for that school.
Bedroom Design mathematics infusion curriculum . All infusion teachers met for ten days of collaborative PD during the summer prior to implementing the Bedroom Design curriculum. During this time, mathematics, technology, and engineering content knowledge and pedagogical experts helped guide, mentor, and provide training for the middle school teachers. The technology teachers worked together with these experts to enhance each day of the curriculum with additional mathematical content. This allowed for a final curriculum, as was described earlier, that all technology teachers were familiar with and knowledgeable in, both conceptually and pedagogically.
Control business as usual curriculum . The control classes were taught by an 8 th grade technology teacher and exposed to their regular 8 th grade technology curriculum, which included six topics (systems thinking, models, magnitude and scale, equilibrium and stability, patterns of change, and optimization) aligned with the NYS curriculum standards. Lessons varied from school to school, as the majority of ETE teachers had freedom to choose what specific areas to cover. However, no control teacher formally incorporated any of the seven KSBs into his or her lessons.
Measures . Both infusion and control students completed two assessments (mathematical content knowledge and attitudinal) prior to and after completing the Bedroom Design curriculum for infusion students and the control curriculum for control students. Further, a teacher feedback survey was administered weekly to all infusion teachers.
Mathematical content assessment . This measure included seven multiple-choice and ten open-ended questions (one question included both open-ended and multiple-choice components). Questions were either adapted from the NYS eighth grade mathematical assessment or developed by an expert mathematics consultant to the project. These items involved mathematical concepts that were included in the technology Bedroom Design curriculum surrounding six of the seven KSBs (excluding the KSB that dealt with aesthetics). Table 1 depicts the specific question and content area.
| Question | Type of Question | Content |
|---|---|---|
| 1 | Open-Ended | Geometric Shapes |
| 2 | Open-Ended | Mathematics of Scale / Factoring |
| 3 | Multiple-choice and Open-Ended | Percentages |
| 4 | Open-Ended | Pricing Information |
| 5 | Multiple-choice | Pricing Information |
| 6 | Open-Ended | Geometric Shapes |
| 7 | Open-Ended | Geometric Shapes |
| 8 | Multiple-choice | Mathematics of Scale |
| 9 | Open-Ended | Pricing Information / Percentage |
| 10 | Open-Ended | Geometric Shapes / Pricing Information |
| 11 | Multiple-choice | Geometric Shapes |
| 12 | Open-Ended | Pricing Information / Percentage |
| 13 | Multiple-choice | Mathematical Nets |
| 14 | Open-Ended | Mathematics of Scale / Percentage |
| 15 | Open-Ended | Pricing Information /Factoring |
| 16 | Multiple-choice | Mathematics of Scale / Percentage |
The content analysis questions were graded by 5 mathematics teachers with twenty-plus years of experience. All questions were scored using a rubric modeled after the NYS middle school mathematics assessment rubrics. Teachers were trained in the use of this rubric and scoring did not begin until raters consistently scored practice questions the same. The multiple-choice questions were scored as either 0 (incorrect) or 1 (correct). The open-ended questions were scored using a three-point rubric ranging from 0 to 2 (0 representing no evidence of understanding, 2 representing full understanding), with the possibility of getting half credit (e.g., .5 or 1.5) for partial understanding.
Mathematical attitudinal assessment . The mathematical altitudinal assessment was developed during prior work by MSTP to assess the major dimensions of mathematics infusion into ETE curriculum. This assessment was previously validated during a pilot study in which experts in technology education developed and micro-tested items with 8 th grade students from similar demographics as the current study. Factor analysis revealed that items on the attitude assessment all loaded at levels of .500 or above on three factors: relevance of mathematics, interest in mathematics and understanding of mathematics. Reliability analyses revealed an alpha coefficient of .877 or higher for each of the factors as well. Due to the high factor loadings and reliability analysis results, the same items were used in the current study to assess student attitudes. The assessment consists of two different groups of statements. The first fourteen likert-type statements asked about student feelings toward mathematics in ETE classes. The second nine statements asked students about their confidence in doing a variety of mathematics related tasks that are needed in Bedroom Design (e.g., solving measurement problems).
Teacher feedback survey . This measure was administered in the form of a weekly online survey to all infusion teachers who participated in the study. The purpose of this measure was to keep track of the mathematical KSBs teachers implemented, as well as their progress, thoughts, and concerns when teaching the Bedroom Design unit.
Interrater reliability . Interrater reliability was assessed for the mathematical content assessment for both pre- and post-assessments. Thirty percent of the assessments were randomly selected for rating a second time in order to calculate a rate of agreement across scorers. Two different scorers independently rated the ten open-ended mathematics questions, using the same mathematical rubric.
Results
Prior to data analysis of the mathematics content assessments, students who did not complete at least half of the pretest and half of the posttest were dropped from the analyses. Based on these criteria, the final sample included 811 students for the content assessment (484 infusion and 327 control students). For the students who were missing responses on each subscale (multiple-choice and open-ended), zeros were substituted for missing answers, assuming students skipped these questions due to an inability to answer. Analyses were conducted at both the individual item level and aggregate summed score level.
Mathematical Content Analysis
Individual question level change . At the individual question level, increases in student scores were seen for both the multiple-choice and open-ended questions in the infusion group. Infusion students scored higher on four of the seven multiple-choice questions: Question 3 = 5.4% increase, Question 11 = 12.0% increase, Question 13 = 26.6% increase, and Question 16 = 5.6% increase (content was percentages, geometric shapes, mathematical nets, and mathematics of scale/percentages). Additionally, infusion students scored higher on four of the ten open-ended questions: Question 6 = .26 M increase, Question 12 = .16 M increase, Question 14 = .10 M increase, and Question 15 = .36 M increase (content was geometric shapes, pricing information/percentages, pricing information/factoring, and mathematics of scale/percentages). Control students increased their scores from pretest to posttest on only three multiple-choice questions (Question 11 = 11.6% increase, Question 13 = 12.9% increase, and Question 16 = 9.8% increase) and two open-ended questions (Question 6 = .18 M increase and Question 15 = .37 M increase).
An independent-samples t-test revealed significant differences between the infusion and control group on two multiple-choice questions, Question 5 (t (809) = 2.00, p < .05) on pricing information and Question 11 (t (809) = 2.97, p < .01) on geometric shapes, where infusion students scored higher, and one multiple-choice question, Question 8 (t (809) = 1.99, p < .05) on mathematics of scale, where control students scored higher. However, on seven of the open-ended questions, infusion students scored significantly higher than control students at posttest. This included the majority of KSB topics: Question 1 (t (809) = 3.25, p < .01), Question 4 (t (809) = 3.25, p < .01), Question 9 (t (809) = 5.18, p < .01), Question 10 (t (809) = 5.68, p < .01), Question 12 (t (809) = 7.41, p < .01), Question 14 (t (809) = 4.38, p < .01), Question 16 (t (809) = 3.06, p < .01). Moreover, there were no post-questions where control student means exceeded those of infusion students. Results are show in Table 2.
| Multiple-choice | Infusion Classes (Matched Pre/Post Data) | Control Classes (Matched Pre/Post Data) | Infusion v. Control (Post Data) | ||||||
|---|---|---|---|---|---|---|---|---|---|
| Question Number | % Correct Pre | % Correct Post | Increase | % Correct Pre | % Correct Post | Increase | t | df | Mean Difference |
| 2 | 62.2% | 56.2% | -6.0%* | 62.7% | 48.9% | -13.8%** | 1.44 | 809 | 0.142 |
| 3 | 61.8% | 67.2% | 5.4%* | 58.7% | 59.9% | 1.2% | 0.39 | 809 | 0.023 |
| 5 | 39.7% | 40.3% | 0.6% | 32.7% | 31.2% | -1.5% | 2.00 | 809 | 0.171* |
| 8 | 67.6% | 62.8% | -4.8% | 58.1% | 50.2% | -7.9%** | -1.99 | 809 | -0.164* |
| 11 | 72.7% | 84.7% | 12.0%** | 63.6% | 75.2% | 11.6%** | 2.97 | 809 | 0.163** |
| 13 | 39.9% | 66.5% | 26.6%** | 33.3% | 46.2% | 12.9%** | -1.06 | 809 | -0.050 |
| 16 | 38.2% | 43.8% | 5.6%* | 22.6% | 32.4% | 9.8%** | -0.06 | 809 | -0.004 |
| Total Score (out of 100%) | 54.57% | 60.21% | 5.64%** | 47.40% | 49.15% | 1.75 | 6.28 | 809 | 11.07** |
| Open-Ended |
Infusion Classes
(Matched Pre/Post Data) |
Control Classes
(Matched Pre/Post Data) |
Infusion v. Control
(Post Data) |
||||||
|---|---|---|---|---|---|---|---|---|---|
| Question Number | Mean Pre | Mean Post | Mean Difference | Mean Pre | Mean Post | Mean Difference | t | df | Mean Difference |
| Note: *p < .05, **p < .01 | |||||||||
| 1 | 1.27 | 1.23 | -.04 | 1.12 | 1.07 | -.05 | 3.25 | 809 | .16** |
| 3 | 1.04 | 1.12 | .08 | .94 | 1.03 | .09 | 1.48 | 809 | .09 |
| 4 | .23 | .25 | .02 | .22 | .19 | -.03 | 2.98 | 809 | .06** |
| 6 | .78 | 1.04 | .26** | .67 | .85 | .18** | 2.74 | 809 | .19 |
| 7 | 1.19 | 1.12 | -.07 | 1.07 | .97 | -.10 | 2.05 | 809 | .15 |
| 9 | .91 | .86 | -.05 | .85 | .55 | -.30** | 5.18 | 809 | .31** |
| 10 | .40 | .44 | .04 | .19 | .15 | -.04 | 5.68 | 809 | .29** |
| 12 | .42 | .58 | .16** | .19 | .22 | .03 | 7.41 | 809 | .36** |
| 14 | .37 | .47 | .10** | .21 | .28 | .07 | 4.38 | 809 | .19** |
| 15 | .53 | .89 | .36** | .31 | .68 | .37** | 3.06 | 809 | .21** |
| Total Score (out of 100%) | 35.66 | 40.00 | 4.34** | 29.03 | 30.00 | .07 | 6.05 | 809 | 10.00** |
Multiple-choice and open-ended composite score change . Composite scores were computed for the multiple-choice questions and the open-ended questions separately by dividing the sum of a student’s responses to each type of question by the total number possible correct responses for that type of question and then multiplying by 100. Thus, each composite score represented a percentage correct out of 100%. Infusion students’ composite scores were higher and statistically significant on the posttest when compared to their pretest scores for both the multiple-choice (% increase = 5.64) and open-ended questions (%increase = 4.34). There were no significant differences between pre- and posttest composite scores for control group students.
An independent-samples t-test was used to test for statistically significant differences between infusion and control students on their post-scores. Results showed that composite scores for infusion students were statistically significantly higher for both the multiple-choice (t (809) = 6.28, p < .01) and open-ended questions (t (809) = 6.05, p < .01), when compared to their control group counterparts, even after controlling for initial composite pre-score differences between groups.
Total score change . A mathematics content total score was computed for each student by adding the multiple-choice and open-ended composite score (both of which reached a maximum of 100), dividing by 200, and multiplying by 100 in order to maintain a scale of 0-100. An independent samples t-test revealed no significant differences between pre- and post-scores for control students. As indicated in Table 3, for infusion students, post-scores were a statistically significant amount higher than their pre-scores (% increase = 4.98). When compared with control students, the infusion students scored significantly higher on their post-scores after controlling for pre-score differences (t (809) = 6.72, p < .01).
|
Infusion Classes
(Matched Pre/Post Data) (n=484) |
Control Classes
(Matched Pre/Post Data) (n=327) |
Infusion v. Control
(Post Data) |
|||||||
|---|---|---|---|---|---|---|---|---|---|
| Mean Pre | Mean Post | Mean Difference | Mean Pre | Mean Post | Mean Difference | T | Df | Mean Difference | |
| Note: *p < .05, **p < .01 | |||||||||
| Total Score | 45.12 | 50.10 | 4.98** | 37.95 | 39.57 | 1.62 | 6.72 | 809 | 10.53** |
Content-level change . An independent samples t-test was conducted to assess whether significant differences existed between the infusion and control group students at posttest for their content knowledge based on the knowledge and skill builders (KSB) described above. Sum scores were created using the items that fell into each KSB category. Students in the infusion group scored significantly higher at posttest in the areas of pricing information (M = 6.08, SD = 2.91 ), percentages (M = 4.98, SD = 1.81 ), factoring (M = 3.28, SD = 2.03 ), and geometric shapes (M = 4.23, SD = 2.50 ) than their control group counterparts (pricing: M = 4.71, SD = 2.38 , percent: M = 4.56, SD = 1.89 , factoring: M = 2.71, SD = 1.91 , and geometric shapes: M = 3.42, SD = 2.16 ).
Quartiles . Students were divided into quartiles based upon their pretest assessment performance. Thus, each student was assigned to either the first, second, third, or fourth quartile based upon the pre-score, in essence breaking the sample into four smaller subsamples. The average pre-score and post-score for students in each quartile was then computed. As is displayed in Table 4, the average post-scores were higher than the pre-scores in three out of the four quartiles (Quartile 1 = +12.01, Quartile 2 = +6.96, and Quartile 3 = +3.9). Moreover, the performance change was most dramatic for students who scored in the first and second quartiles, indicating that those students who were lower performing in mathematics improved the greatest.
| Quartile | ||||
|---|---|---|---|---|
| 1 | 2 | 3 | 4 | |
| Pre-Score | 17.51 | 36.01 | 52.14 | 72.83 |
| Post-Score | 29.52 | 42.97 | 56.04 | 71.77 |
| Difference | + 12.01 | + 6.96 | + 3.9 | - 1.06 |
Mathematical Attitude Analysis
In order to account for missing cases in the attitude dataset, variable means were substituted for any student who had one or two missing cases (84 and 57 students respectively). Students with three or more missing cases were excluded from the analysis. As a result, the total sample size was reduced to 1004 cases (561 infusion and 443 control students).
Mathematics attitudes factor analysis . A principal components factor analysis of the pretest scores was conducted in the 14 likert-type attitude questions. Pretests were collected before students had any exposure to Bedroom Design; therefore, it was decided to use responses from both the infusion and control students, thereby maximizing the number of data points in the analysis. Factor loadings greater than .300 following a varimax rotation were examined in order to interpret the factors. The analysis found a three-factor solution, which accounted for 42.45% of the common factor variance. One item failed to load on any of the three factors and was excluded from the interpretation. The three factors addressed were: (1) perceived level of importance of mathematics in technology, (2) interest in mathematics, and (3) relevance of mathematics. Alpha reliability coefficients, as displayed in Table 5, revealed perceived level of importance of mathematics in technology (Reliability = .80); interest in mathematics (Reliability = .68); and relevance of Mathematics (Reliability = .59) as statistically significant factors.
Mathematics confidence factor analysis . The nine attitude statements about students’ confidence in completing a variety of math tasks were examined separately. Again, it was decided to use responses from both the infusion and control students, thereby maximizing the number of data points in this analysis. A principal axis factor analysis revealed that the data were best represented by a single factor accounting for 42.14% of the common factor variance. The single Math Confidence scale had an alpha reliability of .855. Table 5 shows the factor and each questions loading.
| Statements | Factor Ladings following Varimax rotation | ||
|---|---|---|---|
| Factor One: Math is Important for Technology | |||
| Statements | Alpha Reliability = .802 | ||
| Math and Technology are closely connected. | 0.688 | 0.154 | -0.195 |
| Being able to do math makes learning Technology easier. | 0.680 | 0.204 | -0.250 |
| Math is important for constructing tasks in Technology class. | 0.647 | 0.166 | -0.195 |
| I expect to use a lot of math in this class. | 0.643 | 0.253 | -0.073 |
| My Technology teacher must understand a lot of math. | 0.545 | 0.099 | -0.017 |
| Doing well in Technology class is important to me. | 0.373 | 0.361 | -0.011 |
| Factor Two: Interest in Math | |||
| Statements | Alpha Reliability = .676 | ||
| I like to do Technology projects that require math. | 0.381 | 0.648 | -0.04 |
| Math is interesting. | 0.157 | 0.592 | -0.334 |
| I am able to solve complex math problems. | 0.160 | 0.591 | -0.223 |
| I find math confusing. | 0.093 | 0.515 | 0.479 |
| I am interested in a math or technology related career. | 0.254 | 0.503 | 0.002 |
| Factor Three: Relevance of Math | |||
| Statements | Alpha Reliability = .589 | ||
| I can do well in Technology class without understanding the math. (Recode) | -0.298 | -0.013 | 0.605 |
| The math I learn in school has no relevance to my life. (Recode) | -0.053 | -0.088 | 0.516 |
| I do not understand why I need to study math. | -0.112 | -0.144 | 0.484 |
| Math Confidence Factor | |||
| Statements | Alpha Reliability = .855 | ||
| Calculate area and perimeter. | 0.736 | ||
| Measure and calculate with standard units (e.g., inch, foot, and yard). | 0.721 | ||
| Calculate volume, mass or density. | 0.719 | ||
| Solve problems that involve money. | 0.682 | ||
| Analyze graphs. | 0.672 | ||
| Solve ratio problems. | 0.668 | ||
| Use graphs to show growth. | 0.634 | ||
| Work with proportions. | 0.602 | ||
| Use computers to draw figures. | 0.295 | ||
Mathematical attitudes . Scale scores were computed by summing student responses to questions that fell within each scale and dividing by the total number of items, thus placing the scale scores on the same scale as the original statements, ranging from 1 (not at all true) to 5 (very true). Means were then examined for the infusion students and control students. Four analyses of covariance were conducted to explore attitude differences between infusion and control students after controlling for their initial (pre-score) attitudes. Results indicated that infusion students felt mathematics was more important in technology F(1,807) = 4.183, p < .05; and found mathematics more interesting in technology F(1,782) = 7.261, p < .01 than control students. Statistically significant differences were not found on the other scales.
Paired Samples t-tests were also used to compare pre- and posttest composite scores of infusion students. When the three factor scales were combined into a composite scale (Mathematics attitude composite scale) a negative significant difference was found between the infusion pre- (M = 3.64, SD = .91) and post- (M = 3.51, SD = .92) scores at the p < .05 level, indicating students had a slightly more negative attitude toward mathematics at posttest than at pretest. Further, independent Samples t-tests found statistically significant differences between the infusion (M = 3.82) and control (M = 3.95) groups on the Mathematics Relevance composite. In essence, infusion study participants felt that mathematics was less relevant to their lives than control students. No other composite scores were significantly different between infusion and control participants.
Experience with computer programs . Correlation analysis revealed statistically significant correlations between level of overall experience with the computer programs (Google SketchUp, Microsoft Excel, etc.) and Interest in Mathematics (r = .15), Importance of Mathematics in Technology (r = .13), and Confidence in Mathematics (r = .22). In essence, students who had more experience with the computer programs mentioned above were more likely to feel confident in their mathematics skills, to see the importance of mathematics in technology, and to be interested in mathematics.
Predictors of Posttest Mathematics Content Score
Regression analysis revealed that after controlling for participant pretest content knowledge (predicting 57% of the variance in posttest score), confidence in mathematics skills was the only significant attitude item that predicted posttest content knowledge (predicting 60% of the variance of their posttest score when combined with the pretest content knowledge predictor).
Interrater Reliability
As mentioned previously, 30% of the assessments were randomly chosen and an interrater reliability was calculated for the open-ended questions on the content assessment. A high level of consistency was found between the two ratings for these questions (r = .877). In addition, there was an average consistency rate of 85.09% between rater 1 and rater 2 across all 10 questions. For individual questions, this rate ranged from 72.50% to 94.20%.
Teacher Feedback
Based upon debriefing focus groups and weekly online surveys, it was found that teachers reported the experience to be very valuable for both their teaching practices and for their students. The majority of teachers (95%) said they would definitely implement the unit again. Some teachers noted that their students did complain initially about the amount of mathematics in the lessons; however, the further students progressed in the unit the more their complaints subsided. The teachers reported that students were able to use Google Sketch-Up with very little difficulty; it took about one-class period for instruction and then they could create rooms, furniture, and furnishings using the software.
Discussion
The purpose of the present study was to identify and compare the effectiveness of middle school student exposure to an ETE curriculum that infuses mathematics to students who were not exposed to the mathematics infused curriculum. Pre/post differences in both student mathematical content and attitudinal data were examined. In terms of mathematical content data, infusion students increased their scores from pre- to posttest for some individual multiple-choice questions, the composite multiple-choice score, all open-ended items, and for the total score assessment. When compared to control students, infusion students scored significantly higher on two multiple-choice questions, all ten open-ended questions, the multiple-choice composite, the open-ended composite, and the entire assessment. This indicates that students in the infusion group showed significant increases in content scores after being exposed to the mathematics infused curriculum. These results are encouraging, indicating that the infusion group students learned content that increased their mathematics knowledge, above and beyond increases that would exist by virtue of being in a typical technology class.
Interestingly, specific content areas (i.e. pricing information, factoring, percentages, and geometric shapes) showed greater improvements in infusion student knowledge. This shows that it is possible for students to learn specific mathematical content knowledge in the content in an ETE classroom environment. It is hopeful that infusion students showed significant gains in many of the targeted content areas specifically due to their instruction in the Bedroom Design curriculum. However, not all mathematical content areas that were infused showed a significant improvement in infusion students versus control students (e.g., mathematical nets and mathematics of scale). It could be the case that teachers focused their time on certain content areas as opposed to others. An additional explanation for the disparity in scores could be that even though ETE teachers were administered rigorous PD, these concepts are not typically taught in a middle school technology classroom and teachers may have struggled with teaching the content.
Analysis of the quartile data showed the greatest improvement in students who initially scored in the lowest quartiles. Since the intervention was targeted toward students in low-performing schools, this result was not surprising. Students who started out with lower scores had a greater chance for improvement than students who started out with higher scores. Therefore, participation in the Bedroom Design unit had a positive impact on students, in that they were better able to apply mathematical concepts to their work in technology class. These findings should not only encourage more research into the impact of infusing mathematics into STEM courses, but should also be shared with practitioners in order to promote the effectiveness of this curricular approach. Mathematics achievement as a whole in the United States is imperative to address, and studies and programs like the ones mentioned in this article are a promising first step towards improving scores.
In terms of attitude changes, infusion students felt that mathematics was more important and interesting in technology than control students, seemingly due to their increased knowledge of the utility of mathematics in design challenges. However, infusion students reported a decreased interested in mathematics and relevance at posttest. This could be a result of over-exposure to the difficult mathematics concepts that were presented as part of the Bedroom Design unit. In addition, students were exposed to the curriculum over the course of a month, which may not have been enough time to absorb the value of the mathematics that they were being exposed to. The curriculum is math intensive and may seem overwhelming to students at first (reflected in their posttest scores), but a follow-up survey of mathematics attitudes toward the end of the year, when students would be given the chance to use what they have learned, may have yielded different results. Finally, the attitudes assessment asked students to reflect on their opinion of mathematics overall, and was not phrased for students to reflect on their opinion toward mathematics as it was contextualized within ETE. The rephrasing of some of these questions may have resulted in different patterns of response.
Limitations and Future Directions
There are several noteworthy limitations of this study. First, it was difficult to monitor the material taught within the control classrooms. These teachers were instructed to implement their own technology curriculum, but little was done to examine the curriculum itself, the level of mathematics that was introduced, and the pedagogy used. It would have been beneficial for control teachers to keep a running record of this information in order to gain insight into these technology classrooms. Furthermore, teacher quality (both infusion and control teachers) may have had an impact on student engagement and learning of the mathematics. Future research should monitor, account for, and examine aspects of teacher quality to a higher degree than the current study addressed.
Additionally, randomization of condition (i.e. randomizing which teachers taught infusion and which taught control classes) would be the next critical step to validate the results. In the current study, control groups were created; however, they were not assigned randomly. It is possible that the teachers who participated in infusion classes were more interested in the content, more invested in student learning, or were open to the idea of being part of a two week PD initiative. All together, these factors might have lead to the self-selection of a higher-quality infusion teacher participant versus a control teacher participant. To control for this type of influence, it is important to obtain a sample of teachers first who all share similar characteristics and randomize each teacher to a specific condition.
It is necessary that further research be conducted involving mathematics infusion in a number of different facets. First, new mathematics infused in ETE materials must be developed for both the middle grades and all grade levels. These materials should be based on research that has identified the mathematics topics that are most relevant at each grade level and where mathematics can be appropriately connected and infused. Secondly, adequate PD needs to be provided for teachers to prepare them for mathematics infusion instruction. Research should focus on what type of PD is most successful for mathematics infusion in STE, and must determine if PD should be stand-alone workshops, collaborative STEM learning communities, additional mathematics content and pedagogy training, or perhaps a combination of all three. Lastly, additional research must document if mathematics infusion will improve student scores on existing assessments, or if new assessments may need to be developed. The new assessments must allow for the unique contributions of mathematics infusion that current assessments may not account for. It might prove valuable to target assessments on: primary discipline knowledge (ETE), infused discipline knowledge (mathematics), unique student outcomes (e.g., creating designs, seeing connections within disciplines, problem solving), improvement in student attitudes and self efficacy, student engagement in STEM, and the likelihood of students pursuing further studies and/or careers in STEM related fields.
The implications of this mathematics infused approach are great. Not only is it critical to find ways to enhance mathematical understanding and competencies among students, but it is also important that students to be proficient in the mathematical concepts that are required to master concepts and real-world problems.
M. David Burghardt ( m.d.burghardt@hofstra.edu ) is a Professor of Engineering and Co-Director of the Center for Technological Literacy at Hofstra University. Deborah Hecht ( dhecht@gc.cuny.edu ) is a Project Director for the Center for Advanced Study in Education in the CUNY Graduate Center, New York. , Maria Russo ( MRusso1@gc.cuny.edu ) is a Senior Research Associate for the Center for Advance Study in Education in the CUNY Graduate Center, New York. James Lauckhardt ( jlauckhardt@gc.cuny.edu ) is a Senior Research Associate for the Center for Advance Study in Education in the CUNY Graduate Center, New York. Michael Hacker ( mhacker@nycap.rr.com ) is the Co-Director Center for Technological Literacy at Hofstra University.
References
Akins, L. & Burghardt, D. (2006). Improving K-12 Mathematics Understanding with Engineering Design Projects, 2006 Frontiers in Education Conference, San Diego.
Burghardt, M. D. & Hacker, M. (2003). The New York state curriculum for advanced technological education (NYSCATE). www.nyscate.net.
Burghardt, M. D. & Hacker, M. (2004). Informed design: A contemporary approach to design pedagogy as the core process in technology. The Technology Teacher, September , 6 – 7.
MSTP Project. (2003). Retrieved from http://hofstra.edu/MSTP January 15, 2009.
National Council of Teachers of Mathematics. Overview of Principles and Standards for School Mathematics. http://www.nctm.org/standards/overview.htm . April 2, 2002.
National Research Council (1996). National science education standards . Washington, DC: National Academy Press.
Patton, J. R., Cronin, M. E., Bassett, D. S., & Koppel, A. E. (1997). A life skills approach to mathematics instruction: Preparing students with learning disabilities for the real-life math demands of adulthood. Journal of Learning Disabilities , 30, 178-187.
U.S. Department of Education (2008). Foundations for Success: Report of the National Mathematics Advisory Panel. ED.gov , March 13, 2008. http://www.ed.gov/about/bdscomm/list/mathpanel/index.html
Flugman, B. and Hecht, D. (2007). MSTP Year 4 Evaluation Report. New York: Center for Advanced Study in Education, CUNY Graduate School.
Robinson, L. (1994). Interdisciplinary planning and instruction. Handout made for Interdisciplinary Teaching and Learning Workshop on May 30, 1994 for Tuscaloosa City High Schools.
STEM Symposium—Mathematics Infusion into Science, Technology and Engineering (2009). Retrieved on December 10, 2009 from http://www.hofstra.edu/pdf/Academics/Colleges/SOEAHS/ctl/mstp/mstp_STEM_Symposium.pdf .