JTE v22n1 - Academic Preparedness as a Predictor of Achievement in an Engineering Design Challenge
Academic Preparedness as a Predictor of Achievement in an Engineering Design Challenge
Nathan Mentzer and Kurt Becker
Introduction
Three influential works have been recognized by the field of technology education as having established a foundation for defining technological literacy: Standards for Technological Literacy (STL), Technically Speaking , and Tech Tally . A unifying theme emerging from these publications is that technologically literate people are able to function in our modern technological society ( Gamire & Pearson, 2006 ; International Technology Engineering Education Association [ITEA], 2000 ; Pearson & Young, 2002 ). More specifically, technologically literate people must be knowledgeable, capable, critical thinkers, and decisions makers. The STL , published by ITEA, established a formal definition of technological literacy: “Technological literacy is the ability to use, manage, assess, and understand technology” ( ITEA, 2000 , p. 9). The uniform message is strong—people need to be technologically literate in order to be active, functioning members of our modern society.
Engineering, in general, and engineering design, specifically, are included in STL . Including engineering content in technology education curricula necessitates that the field identify successful approaches to teaching engineering at the high school level. Engineering design challenges include the application of engineering principles to solve real world problems with an active, hands-on approach. Incorporating engineering design challenges into formal coursework is one method of teaching the engineering process through practical application. “In brief, available research suggests that these kinds of courses appear to improve retention, student satisfaction, diversity, and student learning” ( Dym, Agogino, Eris, Frey, & Leifer, 2005 , p. 114).
Purpose
The purpose of this study was to determine if a student’s academic success, measured by grade point average (GPA) in mathematics, science, and communication courses, is correlated with student change in achievement during an engineering design challenge. Engineering design challenges have been implemented and researched in K-16 environments where engineering principles are applied to solve real world problems. Research shows that engineering design challenges have successfully improved student achievement ( Cantrell et al., 2006 ; Dally & Zhang, 1993 ; Irwin, 2005 ; Lentz & Boe, 2004 ; Marra et al., 2000 ; Ricks, 2006 ; Romero et al., 2006 ; Roselli & Brophy, 2006 ; Weir, 2004 ; Yaeger, 2002 ). Based on this literature foundation, research question guiding this work is: Does a general indicator of previous academic success serve as a significant predictor of student learning as measured by an achievement test?
Design Challenges and Achievement
For purposes of this research, an engineering design challenge was defined as a team-based activity in which students engage in solving a real world problem. This approach is initiated by negotiation of the problem definition. Design teams and clients work together to establish their problem and constraints. Information provided by modeling and analysis may illuminate new concerns or possibilities that encourage revisiting the problem definition. This working definition is congruent with that of the Accreditation Board for Engineering and Technology (ABET):
Engineering design is the process of devising a system, component, or process to meet desired needs. It is a decision-making process (often iterative), in which the basic sciences, mathematics, and the engineering sciences are applied to convert resources optimally to meet these stated needs. ( 2007 , p. 21)
Literature describing engineering design challenges draws on various terms, which, while not synonymous, do refer to similar pedagogical approaches of interest to this study. The terms project-based learning ( Dym et al., 2005 ), active learning ( Yaeger, 2002 ), problem-based learning ( Dunlap, 2005 ; Griffith, 2005 ; Irwin, 2005 ), challenge-based instruction (CBI) ( Roselli & Brophy, 2006 ), interactive learning activities ( Cantrell et al., 2006 ), project-driven approach ( Dally & Zhang, 1993 ), design challenge ( Romero et al., 2006 ), cornerstone design ( Dym et al., 2005 ), capstone design ( Dym et al., 2005 ), and team-based project-learning ( Marra et al., 2000 ), all were used to identify literature in the development of a working definition of engineering design challenge .
A body of literature was consulted to shed light on the efficacy of engineering design challenges related to student learning. Engineering design challenges have been of increasing interest in the domain of engineering and technology education in recent years. Literature was reviewed from sources including Technology Teacher, Journal of Engineering Education, Journal of Technology Education, Journal of Industrial Technology Teacher Education , and the National Academy of Engineering. For purposes of this review, 10 studies have been selected. Selection criteria included the following: (a) publication date of 1993 or later, (b) publication must be peer reviewed, and (c) research must focus on engineering content delivered using the characteristics of an engineering design challenge defined for this study. Literature meeting the above criteria was coded for evidence of (a) research design, (b) student achievement, and (c) study quality.
Combinations of the following keywords were used to identify this body of literature: engineering, high school, middle school, junior high, elementary, technological literacy, standards for technological literacy, engineering education standards, design challenge, problem-based learning, challenge-based instruction, cornerstone, capstone. In addition to the journals mentioned above, the following databases were searched: ERIC via EBSCO Host, Digital Dissertations, Wilson, and Google Scholar.
Ten studies measured student achievement, and each indicated positive change, refer to Table 1. This change was typically measured by an exam, generally, a semester exam at the college level or a unit exam in secondary education. Exams were typically multiple-choice. Some were developed specifically for the research project, while others were traditionally used in the course. Marra and colleagues (2000) differed from the other studies because she used the Perry Scheme as a measure of achievement:
William G. Perry developed a quantifiable measure of intellectual development from studies of Harvard and Radcliffe college students in the 1960s. The Perry model has a range of “positions” from 1 to 9, each representing an increasingly complex and mature level of intellectual development. Several Perry positions are relevant to college student development and to first-year students in particular. (p. 39)
| Research design | Student achievement | Study quality | |||||||||
|---|---|---|---|---|---|---|---|---|---|---|---|
| Author, year | n | Level | Control Group | Single Group | Measure | Improvement | Sig | SMDES | High | Med | Low |
| *p < .05 | |||||||||||
| Roselli & Borphy (2006) | 300 | University | X | Exam | X | .12 | X | ||||
| Yaeger (2002) | 150 | University | X | Exam | X | .02 | X | ||||
| Weir (2004) | 78 | University | X | Exam | X | .42 | X | ||||
| Dally & Zhang (1993) | 37 | University | X | Instructor perception | X | X | |||||
| Marra et al. (2000) | 53 | University | X | Perry scheme | X | X* | .65 | X | |||
| Irwin (2005) | 139 | High School | X | Exam | X | X* | .65 | X | |||
| Cantrell et. al (2006) | 434 | High School | X | Exam | X | X | |||||
| Ricks (2006) | 131 | Middle School | X | Exam | X | X* | 2.08 | X | |||
| Romero et al. (2006) | 25 | Elementary | X | Instructor perception | X | X | |||||
| Lentz & Boe (2004) | 25 | Elementary | X | Instructor perception | X | X | |||||
One study at the university level and both studies at the elementary level used instructor perception of student improvement as their sole indicator of achievement. While instructor perception is a biased and subjective measure, it may be appropriate for consideration on the elementary level as a reasonable means of estimating student understanding of content material, thus, these elementary studies were rated with a medium quality. Instructor perception is not the most appropriate measure of achievement at the university level; therefore, Dally’s 1993 study was rated relatively low on the quality scale.
A typical study at the college level used either multiple sections as control and treatment groups or previous year semester test results as control and current semester test results as the experimental group. Notable results emerged from two of the four high school research studies which considered student achievement. Irwin (2005) conducted a high quality study with control and experimental groups that addressed a complex problem-based learning activity over an eight week span. Results were statistically significant ( p < 0.05) with an standardized mean difference effect size of 0.65, considered medium ( Cohen, 2001 , p. 222). Cantrell and colleagues (2006) conducted a study wherein engineering design challenge activities supplemented the standard curriculum, and student performance was compared to statewide statistics on the standardized tests. This study concluded that engineering modules reduced achievement gaps of most ethnic minority groups. Weir (2004) also differentiated her data based on student groups, but she considered an academic top half and an academic lower half in a university engineering course. Her conclusion was that the upper half improved significantly ( p < 0.05), while the lower half was not significantly ( p > 0.10) different between the pre- and post-test measures.
In general, these data suggest that learning techniques associated with engineering design challenges are successful in improving student achievement. Specifically, Weir (2004) and Cantrell and colleagues (2006) presented conflicting results. The Cantrell et al. study represented a collaborative effort between the College of Education and the College of Engineering at the University of Nevada and middle school science teachers. The partnership program administered during the 2005 school year was entitled Teachers Integrating Engineering into Science. Three units of instruction were collaboratively developed, which included web-based simulation activities, lesson plans, a design project, and assessment. Results of the assessment were disaggregated by gender, ethnicity, special education classification, and socioeconomic level. The study sample included 434 eighth-grade student participants in approximately 30 classrooms. Mean scores of the study sample were compared with the mean scores of similar groups from the previous year. This study concluded that typically low achieving students, disaggregated by their ethnic minority status, improved more dramatically than typically high achieving students. The study conclusion was that engineering design challenges generally reduce the achievement gap. In contrast, Weir concluded that engineering challenges extend the achievement gap by improving the academically successful students disproportionately to lower achieving students. Weir developed an “active-based-learning curricula,” which was implemented in an experimental-control treatment design on the undergraduate level in transportation engineering. Active learning strategies implemented in the experimental group included questioning, problem solving in individual and group settings, and discussions to apply knowledge to “real-life” problems. The control group course was taught one year prior to the treatment group course, consisting of 78 junior and senior students at Worcester Polytechnic Institute (WPI).
This integrative review, generally, concludes that approaches to teaching that include application of an engineering design challenge increase student learning. This conclusion is based on a representative sample of studies that survey students from the elementary years through university studies. Researchers have considered the impact of gender, ethnicity, socioeconomic status, and age of student participants as factors related to student experience during the engineering design challenge. However, limited and conflicting evidence suggests that the academic background of a student may impact their experiences during the engineering design challenge. Technology education students typically represent a broad range of academic backgrounds; therefore, it is essential that we understand how engineering design challenges affect all students from low achieving to high. As technology education classes consider infusing engineering design, a natural concern emerges: does a student’s general academic success correlate with student achievement during an engineering design challenge?
The practical significance of this question is based on the nature of the student population in technology education. Technology education students represent a continuum of students ranging from those who are academically successful to those who are struggling in school. If growth in student achievement is uniform and uncorrelated with a general indicator of student success in school, infusing engineering concepts into technology education will presumably be successful for all students. The primary motivation behind this study is the concern that student growth may not be uniform across the range of student academic achievement. If only highly successful students grow, or if they show dramatically higher growth than their less academically successful counterparts, caution must be used when implementing this educational strategy in a class with diverse student abilities.
Methods
To address the research question, data were gathered on student achievement on three occasions. Data were collected in October (pre), December (mid), and April (post). Early October and late April were the earliest and latest data collection dates permitted by the school district policy. Late December was chosen as a midpoint in the school year because the teachers suggested testing before a long winter vacation would provide more accurate results than immediately following the break. Multiple measurements facilitated analysis of changes during the student experience, as well as establishing trends. The multiple measurements lent power to the statistical techniques employed and strengthened conclusions based on data. Trends and changes during the year were compared statistically to a general indicator of each student’s academic success. This indicator was an analysis of the junior students’ grade point average which includes mathematics, science, and literature/reading scores (communications). Mean scores on the different versions of the achievement test were compared. Reliability and ANOVA testing were conducted on the mean achievement instrument scores using SPSS software version 15.0.0. Longitudinal multilevel modeling was utilized to address the research question. Modeling was conducted with R software version 2.7.0 and the linear mixed-effects models package version 0.99875-9 ( Bates, Maechler, & Dai, 2008 ).
“Achievement tests are designed to provide information about how well test takers have learned what they have been taught in school” ( Gay & Airasian, 2000 , p. 154). The United States Department of Education (2008) recognizes the importance of student achievement in its mission statement, “ED's [U.S. Department of Education’s] mission is to promote student achievement ….” Achievement was measured by a test developed in collaboration by the researcher and the classroom teachers. This test was based, specifically, on the goals and objectives of the course, and test items were drawn from validated test banks which included state departments of education and textbook publishers. A pilot test was generated and administered, and the results were analyzed to ensure the validity and reliability of the instrument. Three similar variations of this multiple-choice test were created from the pilot test and utilized during the study.
Previous quasi-experimental research ( Cantrell et al., 2006 ; Dally & Zhang, 1993 ; Irwin, 2005 ; Lentz & Boe, 2004 ; Marra et al., 2000 ; Ricks, 2006 ; Romero et al., 2006 ; Roselli & Brophy, 2006 ; Weir, 2004 ; Yaeger, 2002 ) has established that engineering design challenges are successful in increasing student achievement. To build upon this research base, the current study addressed the potential relationship between students’ academic history, measured by GPA, and their experience during an engineering design challenge, as measured by an achievement test.
Research Context
This study was conducted in an urban northwestern city with a population around 200,000. The high school served approximately 1,500 students in grades 9-12. Students enrolled in the elective course “Industry & Engineering Systems” were juniors pursuing a science and industrial technology credit. Ethnic diversity in this course was typical of northwestern communities with white students comprising the majority population. Students from underrepresented populations in engineering and technology comprised approximately 20% of the students enrolled in this elective course. The total enrollment for two sections of this course was 53 on the first day of class and dropped to 41 by the conclusion of the year. Both sections were co-taught by the same instructors with the same content and methods. This course was one year long and combined the concepts of engineering and technology education through two co-requisite classes. Students received a science credit for the engineering as an applied physics class and an industrial technology credit for the materials processing and fabrication class. These students represented a typical class in the northwestern states, including students who are academically high achievers and students who struggle with their performance in school. According to the instructors, students who elected to take this class, generally, have one of two motivations: they were headed to college to be engineers, or they had failed freshmen or sophomore science and needed a credit to graduate. Thus, the academic diversity ensured this study had the potential to reveal trends and correlations across a broad range of student achievers.
The experienced instructors of this course delivered a hands-on experience, which aligned in content and delivery with typical technology education philosophy. The focal point of this course was an engineering design challenge in the spring term. In preparation for the challenge, students experienced a fall semester comprised of lecture and hands-on application of engineering (as applied physics) and metal fabrication technologies. Typical concepts included: motion, magnetism, electric motors, energy, power, forces, electricity, heat, and air pressure, as well as welding, machining, mechanical fasteners, cutting, and bending metals.
The infusion of engineering concepts into technology education courses was a key element of this study. This was accomplished by applying the engineering concepts as related to physics, science, and mathematics to a traditional technology education curriculum, and culminating with an engineering design challenge. The delivery of engineering concepts and technology education concepts was a central phenomenon to this research site. In this classroom, a technology education teacher had partnered with a physics teacher to deliver engineering content in a technology education atmosphere. While team teaching may provide many benefits, it is a rare occurrence. In generalizing the findings of this study, it is assumed that one teacher, skilled in technology education and familiar with engineering design methodologies, may be equally competent in delivering an engineering design challenge to a group of technology education students.
Data Collected
Data were gathered from student high school transcripts. This indicator of general academic aptitude was considered as four factors: cumulative GPA, mathematics GPA, science GPA, and reading/literature GPA. Additional data included a series of three achievement tests. The tests were administered on three occasions during the school year. Longitudinal multilevel analysis techniques were utilized to identify correlations between a student’s academic history and change in achievement during the engineering design challenge course.
Quantitative data were gathered on the following variables to address the research question:
Section. This course was offered in two sections. One section was offered in the morning, and the second in the afternoon. Advanced placement courses in the school were offered only in the morning, so students who chose to enroll in advanced placement courses were excluded from enrollment in the morning section. Knowledge of section of enrollment allowed this factor to be controlled and tested for statistical differences.
Special education status. Nearly one third of the students enrolled were being served by special educational accommodations. By identifying this student population, regression analysis was able to control for and test this disaggregated subgroup.
Gender and ethnic diversity. Statistical analysis has a greater chance of accurately detecting differences that exist between groups if the sample sizes of those groups are substantially large. A field-specific definition of minority/majority groups was adopted for this study, which collapsed the gender and ethnic divisions into a larger binary variable. This field-specific definition aligns with the fields of engineering and technology education, wherein Caucasian and Asian males are overrepresented while females and other ethnic groups are underrepresented.
Cumulative GPA. Student transcripts were gathered, and a student’s academic success was indicated by a cumulative grade point average during the freshmen and sophomore years. This GPA was based on a 0-5 point scale. Content area specific GPA . Student transcripts were disaggregated by mathematics, science, and communication courses. Individual grade point averages were calculated for each area. The school district identified into which category each course fit, and GPA’s in these categories was computed on the 0-4 point scale.
Achievement test. Student responses were gathered with a 30-item achievement test administered at three points in the course. Development of the test was discussed in the methodology section, and instrument analysis was discussed with findings for research question one.
Mental motivation. The California Measure of Mental Motivation (CM3) identified five subscales. Each subscale was addressed independently for purposes of addressing the research questions and represents a continuous score on a 0-50 scale in this repeated measure. These subscales were mental focus, learning orientation, creative problem solving, cognitive integrity and scholarly rigor.
Achievement Instrument Development and Implementation
A suitable achievement test was not available for measuring the extent to which the goals and objectives of this course have been reached. Therefore, an instrument was developed and pilot tested. Schloss and Smith (1999) described a six-step methodology for developing and testing an instrument. Their method was adapted to guide the development of a cognitive achievement test.
Step one was identifying the skills being studied. The researcher, in collaboration with the course instructors, had identified skills taught which relate strongly to engineering, particularly statics and dynamics courses in preparation for application to an engineering design challenge. Triangulation of findings was done through examination of course material including syllabus, handouts, worksheets, and researcher observation.
Step two involved enumerating skills wherein the skills identified were broken down into smaller elements which could be measured. The researcher differentiated between conceptual and mathematical understanding of the engineering related materials.
Step three included establishing test specification, skills, and subskills that were identified, specifically, for this test and a multiple-choice format was selected. The pilot test was administered the year prior ro research beginning with a comparable group of students.
In step four, test items were developed. In order to reduce bias and increase reliability, test items were selected from external sources rather than researcher developed. These external sources included released test items from state departments of education from a comprehensive survey of 50 states, The other source of test items was publishers of texts pertaining to technology education, engineering, and physics. Many of these publishers supply test banks to teachers for classroom use matching the needs for this study.
Step five focused on a scoring procedure. As a result for test specifications, step three, a multiple-choice test, includes an answer key. The answer key was researcher generated based on the test sources and course instructor verified.
The final step, six, included evaluating reliability and validity. A pilot test was assembled and administered to students during the 2006-2007 spring term near the conclusion of the school year. These pilot students were expected to be comparable to the students participating in the main study, since they were in the same courses with the same instructors. The pilot test was administered in the late spring just as the posttest was in April of the 2006-2007 school year. A Kuder-Richardson 20 (KR-20) statistical analysis was used to refine the pilot test and develop a final version of the exam. As explained by Gall and colleagues (1999) :
The KR-20 formula is a method of calculating the reliability of a measure containing items that are scored dichotomously (e.g., correct-incorrect). A high reliability coefficient (i.e., approaching 1.00) indicates item consistency, meaning that individuals who choose one incorrect). A high reliability coefficient (i.e., approaching 1.00) indicates item consistency, meaning that individuals who choose one answer to some items tend to choose the same answer to other items. Correlation coefficients between .73 and .86 indicate that the course examinations have good, but not perfect, reliability in terms of the consistency with which they measure students' course-related understanding and ability. (p. 260)
Following the pilot test, three similar versions of the instrument were developed. Each of these versions has the same test specification, targeting the same skills. Each test version has a combination of alternate questions, modified questions, and a few repeated questions. Inherent in the fact that the tests are different, student mean scores varied slightly. To ensure that changes over time were student changes rather than instrumentation changes, a randomized test administration was followed. During the administration of each test, one-third of the students received each version of the test. At the conclusion of the term, all students had taken each test version, but not in the same order. Students were randomly assigned to groups for the purposes of test taking. Each group took a different version of the exam during each testing session as shown in Table 2.
| Test version | Student group 1 | Student group 2 | Student group 3 | ||||||
|---|---|---|---|---|---|---|---|---|---|
| Pre | Mid | Post | Pre | Mid | Post | Pre | Mid | Post | |
| A | X | X | X | ||||||
| B | X | X | X | ||||||
| C | X | X | X | ||||||
The 43-item pilot test was analyzed using two measures, the Kuder-Richardson 20 (KR-20) and an indication of the relative difficulty of each item. The test was reduced from 43 pilot questions to a 30-question test and became version A. The final KR-20 for version A was 0.781. From version A, additional questions, which were considered comparable, were developed to form versions B and C. These additional questions fell into one of three categories: original, modified, and repeated. Original questions were utilized as found from the test banks. Modified questions were based on original questions but modified from their original form for one of two reasons: (a) to make them relevant and (b) to use them again in another version. A typical example of a question modified to be more relevant dealt with distance, velocity, and rate calculations and was changed to include locations proximate to the research location. Another example of a typical modified question would be one that solicited students to identify which gear ratio provides the most torque changed to most speed or least speed. In some instances, questions were repeated verbatim since comparable questions were not located and modifying the format of the question was impractical.
Data Analysis
Data analysis was conducted using longitudinal multilevel modeling techniques. This analysis allowed multiple predictor variables to be analyzed in this repeated measures design for prediction of student achievement. “…applications of multilevel models are longitudinal research and growth curve research, where a series of several distinct observations are viewed as nested within individuals….” ( Hox, 2002 , p. 1). Predictor variables included high school grade point average (general indicator of academic history), time, and section. The main predictors of concern were the grade point averages for each academic area (science, mathematics, and communications). This predictor served as a variable with which a correlation was identified with the outcome variables. The predictor of time was critical since it had three time points, pre (October), mid (December), and post (April). Change in students was expected as a result of time, and, therefore, our knowledge of the time point served to establish a growth trend. While two sections of students have enrolled in this course, membership in a section cannot be assumed as random chance. Scheduling conflicts may have impacted student enrollment rather than random chance alone. The researcher has noted that an advanced mathematics class conflicted with one of the sections of this course. To control for these factors, the section membership was recorded and entered into the model. The ability to control for these differences strengthened the model by reducing variability.
Hox (2002) commented on the application of multilevel analysis in repeated measures designs:
Longitudinal data, or repeated measures data, can be viewed as multilevel data, with repeated measurements nested within individuals. In its simplest form, this leads to a two-level model, with the series of repeated measures at the lowest level, and the individual persons at the highest level. (p. 73)
In this study, as suggested by Hox, level one was the three time points. Level two was the individual level including three predictor scores (mathematics, science, communications), the class section, and achievement scores. In the modeling strategy, the power of this statistic was increased by having multiple data collection points rather than only a pre- and post-test design ( Hox, 2002 ).
Efforts were made to ensure that all students participating in the study were present during the testing sessions. A 2-week stay at the research site facilitated data gathering from all students. In the rare event that a student was not available during this time, multilevel analysis results were not jeopardized by missing cases. The data available were used and contributed to the model regardless of one or more missing data points.
In the modeling process, the main effects of predictors were considered in addition to their interactions with time. Interactions between main effects were analyzed including the effect of academic history and time. Slopes and intercepts of main effects and interactions were interpreted. This analytic modeling strategy facilitated an understanding of the relationship between a student’s general academic history and changes in achievement during an engineering design challenge.
Results
Two sections of students participated in this study by enrolling in two co-requisite classes. The total sample size was 53 students. Due to attrition, 41 students completed the year long course. Table 3 shows demographic data summarizing the participant sample. Student enrollment was evenly split between both sections, with dropout rates consistent between sections. Female enrollment in October was 9.50% but representation increased to 12.20% as a result of male dropout. Cumulative GPA had an overall mean of 2.09 on a scale of 0-4. Changes in student enrollment over time increased GPA, which resulted from a disproportionately higher dropout rate of students with low grade point averages. While mean GPA increased, this change was not statistically significant, F (2,140) = 0.21, p = 0.808.
| October (Pre) | December (Mid) | April (Post) | Average | |
|---|---|---|---|---|
|
a
based on student self-identification.
b based on transcript data grades 9 and 10, GPA scale 0-4. |
||||
| Study n | 53 | 50 | 41 | 48 |
| Section: | ||||
| 1 | 28 | 26 | 21 | 25 |
| 2 | 25 | 24 | 20 | 23 |
| Gender: | ||||
| Female | 5 | 5 | 5 | 5 |
| Male | 48 | 45 | 36 | 43 |
| Special education Accommodations | 15 | 15 | 13 | 14 |
| Ethic status: a | ||||
| Majority | 32 | 32 | 31 | 32 |
| Minority | 11 | 11 | 9 | 10 |
| Unreported | 10 | 7 | 1 | 6 |
| Mean cumulative GPA b | 2.04 | 2.08 | 2.16 | 2.09 |
Table 4 compared demographic data on the study participants and the high school population. The percentage of students served by special educational accommodations in this study was 30.00% which is approximately 2.50 times that of the high school. Ethnic diversity data was not reported by all participants. An average of 12.50% did not report. Of the students who did report identifying themselves with an ethnic background, approximately one-quarter of them (24.50%) were not Anglo American, Caucasians. This proportion was just a few percentage points higher than the school statistic of 21.90%. Data were not collected on limited English proficiency or free and reduced lunch specific to this study; however, the school reported 1.40% and 39.00%, respectively.
| High School a | Study | |
|---|---|---|
| a based on school district publication | ||
| Special education accommodations | 12.60 | 30.00 |
| Ethnic diversity: | ||
| Majority | 78.10 | 75.50 |
| Minority | 21.90 | 24.50 |
| Limited English proficiency | 1.40 | NA |
| Free and reduced lunch | 39.00 | NA |
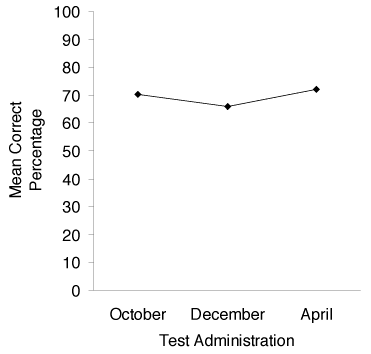
The research question addressed the students’ change in achievement during an engineering design challenge. Figure 1 shows student performance on the achievement tests. Mean scores dropped between October (70% correct) and December (66% correct) but showed gains between December and April (72% correct). Table 5 shows variations between versions for each test administration. Pretest variation was very small, 0.20% between versions. Variation increased in December to 11.10% and dropped a few percentage points to 8.20% in April. ANOVA tests show no statistically significant differences between the versions at each time point (October: F (2,49) = 0.00, p = 0.999; December: F (2,47) = 1.67, p = 0.199; April: F (2,38) = 1.04, p = 0.364).
| M (percent correct) | SD | n | |
|---|---|---|---|
| a Average is weighted. | |||
| October | |||
| A | 70.20 | 14.00 | 17 |
| B | 70.20 | 16.00 | 19 |
| C | 70.40 | 13.90 | 16 |
| Average a | 70.20 | ||
| December | |||
| A | 61.80 | 23.20 | 15 |
| B | 72.90 | 15.30 | 17 |
| C | 63.00 | 19.40 | 18 |
| Average a | 66.00 | ||
| April | |||
| A | 75.70 | 13.60 | 14 |
| B | 74.60 | 15.50 | 11 |
| C | 67.50 | 19.90 | 16 |
| Average a | 72.20 | ||
Hypothesized model. A two-level longitudinal multilevel model assessed the effects of cumulative grade point average, grade point average in mathematics, science, and communication courses, course section, special education accommodation, minority status, and mental motivation as measured by the CM3 assessment on achievement. It was expected that a potential correlation existed between change indicated by the achievement test and GPA. First-level units were repeated measures within individual study participants. Data from 144 achievement tests were considered for analysis. Second-level units were 53 participants in this study. In the hypothesized model, individuals and time are declared random effects to assess variability among individuals within time points, as well as variability among time points. Also, one of the predictors, mental motivation, was declared a random effect, reflecting the hypothesis that there would be individual differences in the association between mental motivation and achievement.
Longitudinal multilevel modeling of achievement. A main-effects-only model was created and tested against a main-effects model that included interactions of time and each predictor. Significance testing was conducted using likelihood ratio tests comparing the model fit using R. Significant interactions were included in a model, which was then reduced in a top-down approach. A reduction technique was employed where the least significant predictors were removed one at a time. Each model iteration was compared to the previous model using a likelihood ratio test to determine if it was statistically different. The final model was not significantly different than main–effects-only model, χ2 (7, N = 123) = -193.466 + 198.118 = 4.6526, p > 0.05. Statistically significant predictors in this model are special education status, GPA in previous science courses, and the CM3 subscale of creative problem solving. Special education students tended to underperform their peers. Students who maintained a higher science GPA, and also students scoring higher on creative problem solving, tended to demonstrate an increase in achievement scores. A student’s status as an underrepresented population member and CM3 subscale cognitive integrity were included in the model but were not statistically significant. No significant interactions were discovered with any predictor and time, which indicates that no significant changes over time were discovered relative to the predictors. Predictor data is shown in Table 6. Note slope estimates were reported as items correct on the 30-question achievement test.
| Variable | Name | Variance | SD | Scale | Estimate | Std. Error | t value |
|---|---|---|---|---|---|---|---|
| Note: Number of obs: 123, groups: STUDY_ID, 43. | |||||||
| Random effects | |||||||
| STUDY_ID | (Intercept) | 12.56 | 3.54 | ||||
| Residual | 5.79 | 2.41 | |||||
| Fixed effects | |||||||
| Intercept | 12.57 | 2.41 | 5.21 | ||||
| Special education | 0.1 | -2.90 | 1.36 | -2.13 | |||
| Underrepresented population | 0.1 | -2.01 | 1.26 | -1.60 | |||
| GPA science | 0.4 | 1.24 | 0.60 | 2.09 | |||
| Creative problem solving | 0.50 | 0.14 | 0.05 | 2.57 | |||
| Cognitive integrity | 0.50 | 0.11 | 0.06 | 1.93 | |||
Discussion
In this research, student achievement was significantly correlated to science GPA, but not significantly to mathematics or communication GPA. Therefore, a student participating in this study was likely to perform better on the achievement test if their science GPA was higher. The differences are not only statistically significant, but they are practically significant. To quantify the practical significance, consider an example: the mean scores in October were approximately 70% correct, and the average science GPA was nearly 2.00. A typical student who failed previous science courses would tend to score 10% lower, or about 60% in this example. Conversely, a student who earned a 4.0 GPA in science would tend to score about 10% higher, or about 80%. Knowledge of previous performance in science lends substantial prediction capabilities to a student’s performance in this achievement test.
Previous performance in mathematics and communications courses did not provide significant prediction capabilities in the modeling. This indicated that students who performed poorly in mathematics or communications were not disadvantaged significantly over their higher GPA peers. Although mathematics and communications GPAs were not statistically significant predictors, a positively correlated trend was noted. Students with a higher mathematics or communication GPA tended to perform better on the achievement test. Special education status provided significant prediction in the model. Special education students tended to score about 10% lower than their regular education peers. While this number is statistically significant, the practical difference was questionable. Special education study participants represented nearly one third of the study sample. This proportion was approximately 2.5 times greater than the high school demographic. Generally speaking, special education students received additional educational services to be successful in school. However, in this study, they performed only about 10% under their peers without support on the test.
Achievement score changes over time were not significantly correlated with science, mathematics, or communication GPA. This indicated that slope modeling for higher and lower GPA students does not show statistically significant changes over time. Therefore, higher GPA students were not advantaged or disadvantaged over time in comparison to their lower GPA peers. This interpretation needs to be considered conservatively as class mean scores did not change significantly over time. The lack of significant mean change over time potentially indicated students did not learn (in a measurable sense) during this course. Alternatively, the achievement instrument may not have fully captured the essence of learning which did occur but was not measured. While speculation regarding why students did not show improvement over the seven month study was non-conclusive, the scores for lower GPA students did not drop significantly. This does indicated that lower GPA students remained active in their participation in course experiences which included the achievement test. Cantrell and colleagues (2006) and Irwin (2005) measured high school student achievement growth, and both indicated improvement, while only Irwin indicated significant improvement.
Student status as a member of an underrepresented population group improved the model fit statistically, but was not a statistically significant predictor. The mean difference between majority and underrepresented populations was of interest, but due to a large variance and relatively small mean difference, inclusion in the model could have been attributed to chance and chance alone. Cantrell and colleagues (2006) conducted a study wherein engineering design challenge activities supplemented the standard curriculum, and student performance was compared to statewide statistics on the standardized tests. Cantrell’s study concluded that engineering modules reduced achievement gaps of most ethnic minority groups. Our study indicated ethnic minority groups underperformed their majority peers. This difference, noted in mean scores, was not statistically significant. Change over time does not support Cantrell’s finding that the achievement gap was reduced, but it does suggest that the achievement gap was not increased significantly.
Weir (2004) differentiated data based on student groups by considering an academic top half and an academic lower half in a university engineering course. Her conclusion was that the upper half improved significantly (p < 0.05), while the lower half was not significantly (p > 0.10) different between the pre- and post-test measures. This research indicated that using science, mathematics, and communication GPA as indicative of students’ academic nature, students improved slightly more over time if their GPA was higher. This lends some support to Weir’s conclusion, but differences based on GPA over time were very small and could be attributed to chance and chance alone.
The field of technology education embraces the importance of technological literacy and caters to an academically diverse audience of student learners. Integrating engineering design into the curriculum addresses the Standards for Technological Literacy and broadens student understanding of our designed world. This study provided an approach to operationalizing the definition of engineering infused into technology education. In this example, students participated in two co-requisite classes. Each class was essentially a standalone course in the fall, one focused on engineering as applied physics and the other material (typically metal) fabrication techniques. The set of learning experiences implemented in the fall in both classes prepared students with foundational knowledge from which they could begin to design, fabricate, test, and redesign during the spring term when the two classes merged into one longer block of time. The use of electric cars as a design challenge provided a problem on which engineering design was applied.
Results from this study indicate that while achievement gaps exist, these gaps are not widened while introducing engineering design concepts into a technology education classroom. Special education students performed poorly on the achievement test as did lower science GPA students, however, growth among these groups was not statistically different than their peers. Thus, engineering design infused into technology education does not disadvantage student growth as measured by an achievement test over time.
In taking full advantage of the engineering design process, an understanding of mathematics and science (physics in this study) was necessary. Technology education teachers should pursue a strong background in mathematics and science. Physics was the most overt science content exploited in this study; however, other science principles may be appropriate. As an example for this design challenge, a teacher with a strong understanding of fluid dynamics may have encouraged the students to think more about aerodynamics. This may have resulted in students’ designing their bodies and frames differently to optimize speed. Therefore, a broad teacher understanding of mathematics and science will provide opportunities for deepening student understanding of the system behaviors through explanation and relevant hands-on application. While naive understandings of mathematics and science will limit technology teacher potential, a lack of understanding does forecast impending failure. Teachers may choose a few aspects of a particular engineering design challenge with which they are (or will become) familiar, and other aspects may be left to trial and error approaches. Where areas of teacher weakness exist, opportunities for professional development abound. However, in the busy teacher workday, other support may be found through collaboration with science and mathematics teachers, industry professionals, higher education partnerships, and knowledgeable parents.
Technology teachers need to be prepared to reinforce absent science concepts, which are relevant to the task at hand, when delivering an engineering design challenge. The introduction (or review) of relevant mathematics and science concepts may be in a series of small activities that build up to the challenge or in a “just-in-time” format to meet the needs of the learners. Mathematics and communications are important academic areas, and, generally, showed positive correlations with outcomes measured in this study. The correlations with mathematics and communications were not statistically significant, which may be related to the focus of this particular design challenge, not necessarily representative of all design challenges.
Student motivation was critical to maintaining and managing a successful learning environment. Motivated students tend to make a more diligent effort to acquire new material and apply their conceptual understanding to problems at hand. In this study, students formally began designing their solutions to the engineering design challenge in January. As early as March, student teams were beginning to race their cars. Races were typically hosted by local schools and were held nearly every weekend. This schedule impacted learning in the classroom by facilitating an iterative design process. Students would typically race their cars on Saturday, make improvements or modifications during the week, and then race again the following week. This iterative form of testing allowed teams to make changes to their car and discover firsthand the results of those modifications. By virtue of the tight timeframe, teams generally raced the first few races without a car body. But, when the car was functional, they focused efforts of developing an aerodynamic body. Thus, inadvertently, students experienced the impacts of each improvement to their cars as the designs evolved over time. This iterative process provided learning opportunities, but also motivated students through the excitement of testing their renewable energy vehicle. Therefore, as teachers incorporate design challenges, students need the opportunities to engage in the iterative process of design, test, redesign, and test again for the purpose of discovering the impact of their modifications, as well as being motivated by successful experimentation.
Future Research
Clarity of operationalizing engineering design appropriate for technology education is an area for future research. Engineering design was defined for this study through a synthesis of relevant literature and research site practice. Presented in the findings section are data describing the context of this research. The developmentally appropriate nature of determining the extent to which engineering design related activities and lessons are utilized in this eleventh grade classroom was based solely on the participating teachers’ discretion. Therefore, future study may enhance the field’s understanding of what constitutes developmentally appropriate engineering design curricula in a technology education environment.
This study established correlations between predictors and outcome variables but must stop short of inferring causality. Additional research should pursue casual effects based on this research foundation. Experimental designs with control and treatment group should be conducted in a variety of classrooms. Engineering design presented here was applied to the Electrathon America challenge and could be extended to various other engineering problem solving opportunities. These experimental designs should vary in duration, from unit sized formats lasting a few weeks to semester long challenges such as this one. This study was potentially unique in that two teachers were participating under one syllabus, teaming their efforts focused on a common goal. While some school districts offer incentives for teachers to develop their cross-curriculum connections in a team approach, many do not. Experimental studies should be conducted to demonstrate differences between team teaching environments and more typical one-teacher classrooms. Longitudinal data may be gathered following students who participated in a design challenge study. Students in the control and treatment groups may be followed over a number of years to assess the impact in postsecondary education and career choices.
Nathan Mentzer ( nmentzer@purdue.edu ) is an Assistant Professor in the College of Technology at Purdue University. Kurt Becker ( kbecker@engineering.usu.edu ) is a Professor and the Department Head of Engineering and Technology Education at Utah State University.
References
Accreditation Board for Engineering and Technology [ABET] (2007). Criteria for accrediting engineering programs . Retrieved March 17, 2007, from http://www.abet.org/Linked%20Documents-UPDATE/Criteria%20and%20PP/E001%2007-08%20EAC%20Criteria%2011-15-06.pdf
Bates, D., Maechler, M., & Dai, B. (2008). lme4: Linear mixed-effects models using S4 classes (Version 0.999375-22).
Cantrell, P., Pekca, G., & Ahmad, I. (2006). The effects of engineering modules on student learning in middle school science classrooms. Journal of Engineering Education, 95 (4), 301-309.
Cohen, B. H. (2001). Explaining psychological statistics (Second ed.). New York: John Wiley & Sons, Inc.
Dally, J. W., & Zhang, G. M. (1993). A freshman engineering design course. Journal of Engineering Education, 82 (2), 83-91.
Dunlap, J. C. (2005). Problem-based learning and self-efficacy: How a capstone course prepares students for a profession. Educational Technology Research and Development, 53 (1).
Dym, C. L., Agogino, A. M., Eris, O., Frey, D. D., & Leifer, L. J. (2005). Engineering design thinking, teaching, and learning. Journal of Engineering Education, 34 (1), 103-120.
Gall, J. P., Gall, M. D., & Borg, W. R. (1999). Applying educational research: A practical guide (4th ed.). New York: Longman.
Gamire, E., & Pearson, G. (Eds.). (2006). Tech tally: Approaches to assessing technological literacy . Washington, D.C.: National Academies Press.
Gay, L. R., & Airasian, P. (2000). Educational research: Competencies for analysis and application (6 ed.). Upper Saddle River: Merrill.
Griffith, D. S. (2005). FIRST robotics as a model for experiential problem-based learning: A comparison of student attitudes and interests in science, mathematics, engineering, and technology . Unpublished Dissertation, Clemson University.
Hox, J. (2002). Multilevel analysis techniques and applications . New Jersey: Lawrence Erlbaum Associates.
International Technology Engineering Education Association (2000). Standards for technological literacy: Content for the study of technology . Reston, VA: Author.
Irwin, J. L. (2005). Engaging teachers and students in problem based simulation activities . Unpublished Dissertation, Wayne State University, Detroit.
Lentz, K., & Boe, N. (2004). Implementing technology in elementary schools. Technology and Children, 9 (2), 19-20.
Marra, R. M., Palmer, B., & Litzinger, T. A. (2000). The effects of a first-year engineering design course on student intellectual development as measured by the Perry Scheme. Journal of Engineering Education, 89 (1), 39-45.
Pearson, G., & Young, A. T. (Eds.). (2002). Technically speaking: Why all Americans need to know more about technology : National Academy of Engineering.
Ricks, M. M. (2006). A study of the impact of an informal science education program on middle school students' science knowledge, science attitude, STEM high school and college course selections, and career decisions . Unpublished Dissertation, The University of Texas at Austin, Austin.
Romero, N. Y. d., Slater, P., & DeCristofano, C. (2006). Design challenges are "ELL-ementary". Science and Children, 43 (4), 34-37.
Roselli, R. J., & Brophy, S. P. (2006). Effectiveness of challenge-based instruction in biomechanics. Journal of Engineering Education, 95 (4), 311-324.
Schloss, P. J., & Smith, M. A. (1999). Conducting research . Upper Saddle River: Merrill.
Weir, J. A. (2004). Active learning in transportation engineering education . Unpublished Dissertation, Worchester Polytechnic Institute.
Yaeger (2002). Innovations and outcomes in engineering education: Active learning in dynamics classes . Unpublished Dissertation, Pennsylvania State University, State College.