
JITE v32n3 - Divers or Dabblers: Participation Patterns of Vocational/Technical Students in Illinois High Schools
Divers or Dabblers: Participation Patterns of Vocational/Technical Students in Illinois High Schools
Chris A. Roegge
University of Illinois at Urbana-ChampaignJeffrey W. Flesher
Southern Illinois University at CarbondaleResearchers have traditionally encountered difficulty in attempting to assess the effects of vocational education participation on students ( Hill, Harvey, & Praskac, 1992 ). Hoachlander ( 1989 ) stated that "obtaining accurate, comprehensive data for vocational education has been one of the most elusive objectives of federal policy" ( p. 1 ). One major source of difficulty is the lack of a clear understanding of what constitutes a "vocational program completer" or, even more basically, a "vocational student" ( Campbell, Orth, & Seitz, 1981 ; Tuma, Gifford, Horn, & Hoachlander, 1989 ). Students who participate in vocational education do so for many different reasons and their participation takes on many forms, from single-course takers to completers of entire sequences in multiple programs ( Grubb & McDonnell, 1991 ). The National Assessment of Vocational Education ( 1989 ) found that 97% of high school students take at least one vocational course; are 97% of all high students vocational students? Probably not. With such a breadth of vocational participation, what percent of the students could be considered vocational students and program completers? These questions continue to bedevil those who seek to determine empirically the effects of vocational programming.
Illinois, like other states, is attempting to implement a system of performance measures and standards with which to evaluate student outcomes. Vocational education is very diverse in Illinois, and the problem faced by state staff was to identify various levels of student participation and completion in order to assess outcomes accurately and make valid comparisons. The problem addressed by this study, therefore, is that there is an inadequate grasp of what it means to be a vocational student. This lack of clarity makes it difficult, if not impossible, to measure adequately the outcomes of vocational programming or to compare them to those of other school programs.
The purpose of this study, therefore, was to develop a course-taking profile of vocational education students in Illinois. The specific objectives of the study were
- To identify existing patterns of course participation.
- To identify differences in participation patterns among subgroups.
- To determine the degree of special populations participation.
- To refine the definition of a vocational program completer.
For the purpose of this study, course sequence was defined as two consecutive vocational courses within a specific program, in which completion of the first course is a prerequisite for enrollment in the second course.
Conceptual Framework
To describe characteristics of vocational and academic students, researchers have developed dichotomous definitions based on either the number of vocational courses taken or the percentage of vocational units within the overall program ( Oakes, Selvin, Karoly, & Guiton, 1992 ; Riesenberg & Stenberg, 1992 ). These models may not provide a clear picture of students' vocational education experiences due to the arbitrary decision rules used to differentiate between vocational and non-vocational students. It seems plausible that many students are not exclusively one or the other. Even within the college prep track, average vocational credits earned represent important levels of activity. In a profile of 1987 high school graduates ( National Center for Education Statistics, 1992 ), college prep track students averaged 2.23 Carnegie units of vocational education, which represented approximately nine percent of their total credits earned. Certainly, there is a broad fluctuation reported in the number and type of vocational courses taken by individual students and course content is likely to vary by school. Program emphasis is also a function of school type and administrative structure ( Lee, Bryk, & Smith, 1993 ).
A recent study that relied on the number of courses to develop categories is reported by Oakes, et al. ( 1992 ). To control for the requirement that students at one of three high schools included in their study take two vocational courses, the researchers increased by two the required number of classes to be considered a concentrator at that school. It seems possible that students categorized as vocational with eight courses may not have had equivalent experiences to those classified at the other schools with six courses. Additionally, had the researchers sought to compare a large number of schools of varying type and administrative structure, it would have been difficult to develop a reliable equalization model for each school. A basic criticism of categorization based on number of courses is the lack of consideration of program structure and sequence. As an example, consider two hypothetical six-course vocational concentrators:
Student A Student B
Introduction to Food Service
Bookkeeping
Technology I
Marketing
Child Care I
Child Care I
Keyboarding
Child Care II
Accounting I
Child Care III
Fashion Design I
Child Care Co-op
Although both students have taken the necessary number of courses to be considered vocational concentrators, their vocational education experience is very different and illustrates the diver vs. dabbler contrast. Student A has dabbled in various vocational programs with little evidence of having built a coherent occupationally oriented or transfer preparatory sequence, while student B has built a concentration in a specific child care program based on a sequence of linked progressive courses.
It is equally difficult to assign a vocational concentrator label based purely on percentage of overall credit. In a study conducted by Riesenberg and Stenberg ( 1992 ), vocational concentrators were determined to be those who had ten percent or more of their high school credit in vocational education, based on recommendation of the researchers and state staff investigators. This type of analysis model ignores the variations introduced by number of credits required by individual schools for graduation, class periods per day, individual student differences in total credits attempted, and content level of the vocational courses. Additionally, without a linkage to course sequencing students with like percentages of participation may have very different experiences, as in the hypothetical example above.
In a survey of public secondary vocational education programs conducted by the United States General Accounting Office ( 1993 ), vocational students were defined as those students enrolled in sequenced courses ; but the specific sequence level was not defined. Although still problematic, this level of definition does provide some clarification of the issue of who is a vocational student. Linking categorizations to specific sequences of courses within programs may provide a more accurate representation of secondary students' participation in vocational education and the relationship of academic course elements within the overall high school experience.
Some vocational courses are specifically designed to provide specialized training in an occupation, while others provide skills that may be as useful to the college bound student as they are to students going directly into the labor market ( Hill, Harvey, & Praskac, 1992 ). This study was an effort to describe students' experiences in vocational courses using a classification scheme based on course sequences and prerequisites defined by the local school.
Methodology
Sample Selection
For this s offered both college preparatory and vocational curricula.
The Illinois State Board of Education (ISBE) maintains a yearly database of all students enrolled in funded vocational courses. A random sample of the members of the graduating class of 1992 who had participated in at least one vocational course during their high school experience was drawn from the 1992 state database. Transcripts were obtained and reviewed for each student in the sample; incomplete records and non-graduates were removed, and the final sample consisted of approximately 26% of the graduating classes from the 13 schools ( n = 846). Student transcripts were analyzed to establish course levels and participation patterns. In addition, high school guidance counselors and administrators were interviewed at each site, and documentation (e.g., curriculum guides, student handbooks, courses of study) was collected to identify locally-based criteria for course enrollment and program completion.
Data Collection and Analysis
Due to the sensitive nature of the study, a multi-stage process was followed to gain access to the student transcript data and ensure confidentiality of individual student information. Superintendents of the sample schools received a formal letter from the State Assistant Superintendent for Adult, Vocational, and Technical Education, requesting their participation in the study. Once permission was obtained, a contact person was identified at each school. A list of the names drawn for each site was sent to each contact person, and clerical staff from each high school located and photocopied the transcripts. Project staff visited each school to collect the transcripts, compile and collect program guides and any other written curriculum documentation, and interview principals, guidance personnel, and program coordinators.
Program documents were content-analyzed and summarized to determine such things as the overall curriculum structure of the school, total credits required for graduation, total number of required and elective credits, and structure of vocational programs. Transcript data were analyzed using descriptive statistics to determine frequencies and percentages of students within each course-taking pattern, within each vocational program area, and within class rank quartiles. The entire data collection and analysis process was piloted using two schools not included in the final sample. All data were collected between April 30 and June 3, 1993.
Results
Description of Curricula
Underlying student participation patterns are a broad array of curricular structures represented by the schools in the study: college preparatory curricula, focused occupational training, comprehensive curricula built around occupational majors, a school-within-a-school academy model, a school-wide core curriculum for all students, and a parallel GED curriculum for returning dropouts.
Nine of the 13 schools in the sample could be considered typical comprehensive high schools. The basic curriculum in these schools is college preparatory. Typically, approximately 20 credits are required for high school graduation and vocational education may be selected (along with music, art, and foreign language) to fulfill a one-credit requirement. Curriculum documentation clearly indicated the emphasis on the college preparatory track in most of these schools.
A few unique wrinkles were uncovered in some of the comprehensive schools. One rural school had established a core curriculum, required for all students, which filled 19.5 out of the 22 total units required for graduation. Every student in this school was required to complete one unit of vocational education. In addition, eight vocational courses could be used to fulfill academic credit requirements. One of the suburban schools was in the process of implementing a similar school-wide curriculum for all students. Another school, part of a multiple-school district, offered a district-wide curriculum in which students must follow one of six programs of study: Business Education, College Preparatory, Cooperative Education, General Education, Trades & Technical Education, or Special Education.
The three vocational high schools offered comprehensive curricula including college preparatory. The basic difference was that students choose one or more vocational majors and receive most of their vocational coursework during their junior and senior years. Students graduate from these schools with both a high school diploma and a vocational proficiency certificate.
Transcript Analysis Results
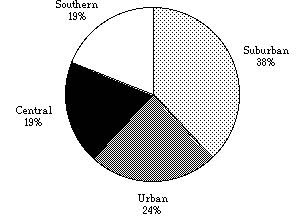
Description of the sample. Figure 1 illustrates the sample breakdown by geographic area. These percentages approximate the relative distribution of the statewide secondary student population. The sub-samples represent 25% of the total graduating class of 1992 in the Chicago urban area, 24% in the suburban, 23% in the central, and 27.5% in the southern areas. A slight majority of the students in the sample were male (52.6%). In the Chicago urban and southern clusters, slightly more than half the students were female, while the suburban and central clusters had a slight majority of male students.
Figure 1
Sample Distribution by geographic area
Patterns of participation. The first objective of the study was to identify existing patterns of vocational course participation. The sites that were studied provided vocational students with a variety of opportunities (and obstacles). Vocational curricula ranged from departments structured around the five traditional subject areas (i. e., agriculture, health occupations, business, home economics, industrial), to a school-wide required core curriculum that included vocational courses, to a business school within-a-school. Introductory courses (no prerequisite, open enrollment) and advanced courses (required prerequisite course in a progressive sequence of courses) related to major vocational program areas (Industrial/Technical, Health, Home Economics, Business, and Agriculture). Thirteen mutually exclusive participation categories were developed to reflect content levels as defined by local enrollment requirements:
- No course taken.
- Single course takers--introductory or advanced.
- Introductory course takers only--single vocational program.
- Introductory course takers only--multiple vocational programs.
- Advanced course takers only--single vocational program.
- Advanced course takers only--multiple vocational programs.
- Sequence completers--single vocational program.
- Sequence completers--multiple vocational programs.
- Sequence completers--single vocational program with some introductory courses in multiple programs.
- Sequence completers--single program with some advanced courses in multiple programs.
- Cooperative education course takers only.
- Special education only sequence completers.
- Some introductory, some advanced, but not in the same program.
Overall, slightly more than 68.5% ( n = 543) of the students completed a vocational sequence (patterns 6 - 9). Of the non-sequence completers, 26% ( n = 223) were introductory level only course takers, with 17% ( n = 130) taking introductory courses in more than one vocational program. Over 90% of the students in the total sample took more than one vocational course. The average number of vocational courses taken was 8.36.
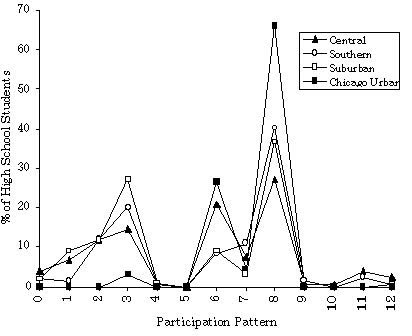
Participation differences among subgroups. The second objective of the study was to identify differences in participation among various subgroups of the sample. There were noteworthy differences in participation among the representative clusters ( Figure 2 ). Due to the vocational emphasis of the schools, 97% of the Chicago urban sample were sequence completers, compared to 63.9% in the southern area, 59.6% in the central area, and only 48.8% in the suburban area. Also, the vocational dabblers were primarily characterized as taking introductory courses in multiple vocational programs. A majority of the non-sequence completers (patterns 1 - 5) fell into this category ( n = 150, mean = 55.76%).
Figure 2
Participation Pattern Distribution by Geographic Area
One way to assess program participation is to calculate the total number of credits earned in each vocational-technical program area. The number of credits awarded for vocational courses ranged from .25 to 1.0, with most courses being worth .5 credits per semester. A preponderance of credits were earned in the Industrial Occupations (39.73% of the total sample) and Business Occupations (36.11%) areas. Overall, 21.36% (18,953 credits) of the total credits earned by the students in the sample were earned in vocational courses. No significant differences existed in the participation patterns of students with emphasis in different program areas.
In order to relate the course-taking patterns to a meaningful academic indicator, each student was placed into a corresponding quartile based on class rank. Due to the variation in local policy concerning weight attached to courses and points applied to grades, the quartile was the most accurate reference available to describe academic achievement. In some schools, students representing particular special education programs and the like were not considered for equivalent grade/course evaluation. Since only five of these individuals were identified, they were not included in the pattern-by-quartile analysis.
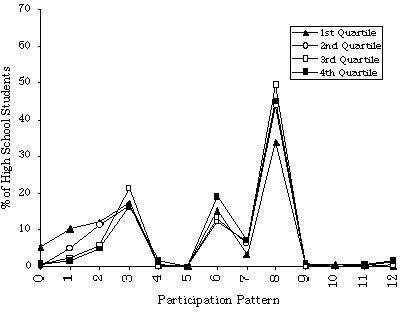
Figure 3 presents the breakdown of course-taking patterns by class-rank quartiles. The data are presented as percentages of students in each quartile that fall into each participation pattern. As illustrated in Figure 3 , the general participation patterns were nearly identical for students in all four quartiles. Program completers (patterns 6 - 9) comprised the largest group of students in each quartile. Closer inspection of the numbers, however, reveals some noteworthy differences. Nearly 21% of the students in first quartile were single vocational program completers, compared to only 8.4 and 8.9 percent in the second and third quartile respectively. Perhaps more importantly, 97% of the students in the fourth quartile were vocational program completers, compared to 51%, 51.4%, and 48.8% in the first, second, and third quartiles respectively.
Table 3
Participation Pattermn Distribution by Class Rank
Special populations. The third objective of this study was to determine the degree of participation by members of special populations. Academically disadvantaged (37%), economically disadvantaged (5%), and learning disabled (8%) represent the most significant categories of special populations students in terms of percentage. An academically disadvantaged student is identified by the following criteria: (a) 2 grade levels below placement in reading, English, or mathematics skills; (b) receiving a grade of D or below in a vocational education class and needing support services to succeed in that class; and, (c) enrolled in a remedial course and meets one of more of the previous criteria. An economically disadvantaged student is identified by the following criteria: (a) eligible for free or reduced price school lunch; (b) eligible for participation in programs assisted under Title II of the Job Training Partnership Act; (c) eligible for Aid to Families with Dependent Children or other public assistance programs, or (d) family income at or below the national poverty level. A learning disabled student exhibits a disorder in one or more of the basic psychological processes involved in understanding or using language, spoken or written, which may manifest itself in an imperfect ability to listen, think, speak, read, write, spell, or do mathematical calculations. Fully 79% of the students in the Chicago urban area sample were classified as academically disadvantaged. In the other three areas, the percentages ranged from 13 to 30.
Overall, 83% of the special populations students were also program sequence completers, compared to 65% for the total sample. Depending upon the category, program completion among special populations ranged from 50 to 100 percent.
Key course completion. The fourth objective of the study was to refine the definition of a vocational program completer. One simple method used to designate vocational program completion on a statewide basis is completion of a "key course," one which occurs at the end of a sequence. A problem arises when key courses are designated by course title review, which is often the only information readily available. Therefore, key course completion was analyzed separately as it was discovered that courses identified as "key" varied greatly in scope and placement in the sequence (e.g., in some cases, a key course was the only course in the sequence).
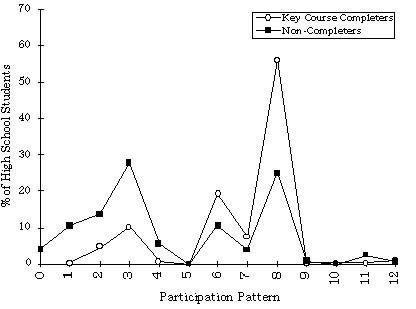
Four hundred seventy-six (56.26%) of the students in the sample completed key courses, as identified by ISBE. When compared with the number of students who completed a course sequence ( n = 543) it becomes obvious that the key course designation is not an entirely accurate measure. Further, not all of the key course completers were sequence completers. Three hundred ninety-five (83.1%) of the key course completers also completed a course sequence as operationally defined for this study. Figure 4 illustrates the percentages of key course completers and non-completers in each pattern.
Figure 4
Pattern Distribution by Key Course Completion
Discussion
This study examined the participation and completion patterns in vocational education. The population included students in the class of 1992 who had taken at least one vocational course and were thus identified in the Illinois statewide vocational database. The sample ( n = 846) represented approximately 25% of this population in the thirteen schools selected. Based on the data analysis, the following conclusions were drawn.
Patterns of Course Participation
The first objective of the study was to identify existing participation patterns. For the most part, students who take vocational courses primarily take multiple courses (93.3%). Further, a majority of vocational course takers complete a course sequence (68.5%). These findings confirm that a large percentage of high school students take some vocational education. The popular perception, however, has been that the selection of most vocational courses is somewhat random. General education students fill out their schedules with "easy" courses while college preparatory students may take a keyboarding or accounting course. The findings of this study dispel that notion to some degree: while seventeen percent of the students sampled fell into this pattern, over half of the students studied did complete an organized course sequence, and students averaged about eight vocational courses on their transcripts. These findings communicate to various audiences that vocational education is more of a factor in students' high school career than may have been thought.
Differences in Participation
The second objective of the study was to identify differences in participation among subgroups. While sequence completers constituted the largest student group in all clusters, they were not a majority in the suburban cluster (as they were in the other three), giving the impression that a more college preparatory orientation exists in that area. As with the overall sample, the largest group of students in each class rank quartile were vocational sequence completers. This goes against the notion that academically talented students do not participate in vocational education. Another popular notion--that less academically able students are shunted into vocational programs--was supported by the data. Fully 97% of the students in the lowest class rank quartile were vocational sequence completers, compared to approximately half of the students in the other quartile groups.
Special Populations Participation
The third objective of the study was to determine the degree of special populations participation in vocational programming. Based on the data, it appears that members of special populations do comprise a major audience for vocational programs. Further, a higher percentage of special populations students are program completers compared to the entire sample. The term vocational students , therefore, applies more broadly to special populations students than to members of the general student population who take one or more vocational courses.
Definition of Vocational Program Completer
The fourth objective was to refine the definition of a vocational program completer. The use of key courses to identify program completion may be problematic. Selection of key courses seems to be of major importance and reflects something other than completion of a sequence. In some cases, the key course was the only course in the sequence. Can one course be a program? If key course completion is to accurately reflect sequence or program completion, then a key course should be at the end of a 2 - 3 course sequence, with prerequisites. This did work in a majority of cases, but it definitely missed some. The use of specific criteria based on course sequences, as developed in this study, may enable a more accurate accounting of the experiences of vocational students . Defining program completion on local criteria (prerequisite structure) reduces the errors inherent in large scale equalization models or arbitrary selection rule-based criteria.
Author
Roegge is Assistant Professor, Department of Vocational and Technical Education, University of Illinois at Urbana-Champaign and Flesher is Visiting Assistant Professor, Department of Workforce Education and Development, Southern Illinois University at Carbondale.
References
Campbell , P., Orth, M., & Seitz, P. (1981). Patterns of participation in secondary vocational education: A report based on transcript and interview data of the 1979 and 1980 National Longitudinal Survey New Youth Cohort . Columbus, OH: The Ohio State University, National Center for Research in Vocational Education.
Grubb, N. W., & McDonnell, L. M. (1991). Local systems of vocational education and job training: Diversity, independence, and effectiveness . Berkeley, CA: National Center for Research in Vocational Education.
Hill , P. T., Harvey, J., & Praskac, A. (1992). Pandora's box: Accountability and performance standards in vocational education . (NCRVE Publication No. MDS-288). Berkeley, CA: National Center for Research in Vocational Education.
Hoachlander , E. G. (1989). National Data Needs for Vocational Education . Washington, D.C.: Office of Vocational and Adult Education, U.S. Department of Education. (ERIC Document Reproduction Service No. ED 314 641)
Lee , V. E., Bryk, A. S., & Smith, J. B. (1993). The organization of effective secondary schools. In L. Darling-Hammond (Ed.), Review of Research in Education Vol. 19. (pp. 171-267). Washington, DC: American Educational Research Association.
National Assessment of Vocational Education (1989). Summary of findings and recommendations (Vol. I). Washington, DC: U.S. Department of Education
National Center for Education Statistics. (1992). Digest of education statistics 1992 (Publication No. NCES 92-097). Washington, DC: U.S. Government Printing Office.
Oakes , J., Selvin, M., Karoly, L., & Guiton, G. (1992). Educational matchmaking: Academic and vocational tracking in comprehensive high schools (RAND Report No. R-4189-NCRVE/UCB). Santa Monica, CA: RAND.
Riesenberg , L. E., & Stenberg, L. A. (1992). High school and employment experiences of vocational and nonvocational concentrators of the Idaho high school graduating class of 1983. Journal of Vocational Education Researc h , 17(4), 67-92.
Tuma , J., Gifford, A., Horn, L., & Hoachlander, E.G. (1989). Enrollment in vocational and academic education in America. Public High Schools, 1967-1987 . Berkeley, CA: MPR Associates. (ERIC Document Reproduction Service No. ED 315 543)
United States General Accounting Office. (1993). Vocational education: Status in school year 1990-1991 and early signs of change at secondary level (GAO Publication No. GAO/HRD-93-71). Gaithersburg, MD: Author.
Reference Citation: Roegge, C. A., & Flesher, J. W. (1995). Divers or dabblers: Participation patterns of vocational/technical students in Illinois high schools. Journal of Industrial Teacher Education , 32(3), 30-44.