
JTE v14n2 - Effects of Take-Home Tests and Study Questions on Retention Learning in Technology Education
Effects of Take-Home Tests and Study Questions on Retention Learning in Technology Education
W. J. Haynie, III
Population and SampleMThe benefits of tests as aids to retention learning, beyond their primary evaluation function, have been studied in a variety of settings. This study sought to isolate the effects of take-home tests within a technology education context. The investigation involved instruction via self-paced texts, initial testing of learning, and delayed testing three weeks later. The delayed tests provided the experimental data for the study.
Background
Most of the research on testing has concerned standardized tests, but much of the evaluation done in schools is with teacher-made tests ( Haynie, 1983 , 1990a ; Herman & DorrBremme, 1982 ; Mehrens, 1987 ; Mehrens & Lehmann, 1987 ; Moore, 2001 ; Newman & Stallings, 1982 ; Stiggins, Conklin, and Bridgeford, 1986 ). Research is needed on the effects of teacher-made tests and other issues surrounding them such as frequency of use, quality, benefits for student learning, optimal types to employ, and usefulness in evaluation. The available findings on the quality of teacher-made tests cast some doubt on the ability of teachers to perform evaluation effectively ( Carter, 1984 , Fleming &Chambers, 1983 ; Gullickson & Ellwein, 1985 ; Haynie, 1992 , 1995b , 1997a ; Hoepfl, 1994 ; Moore, 2001 ; Stiggins & Bridgeford, 1985 ). Despite the recognized faults, Mehrens and Lehmann (1987) point out the importance of teacher-made tests in the classroom and their ability to be tailored to specific instructional objectives. Evaluation by teacher-made tests in schools is an important and needed part of the educational system and a crucial area for research ( Ellsworth, Dunnell, & Duell, 1990 ; Haynie, 1990a , 1992 ; Mehrens & Lehmann, 1987 ; Nitko, 1989 ).
The effectiveness of test taking as an aid to retention has been studied in several settings and in association with several related variables. In many of these studies, test taking has been shown to aid retention of learned material ( Haynie 1990a , 1990b , 1991 , 1994 , 1995a , 1997b ; Nungester & Duchastel (1982)1982 ). Reviewers of some earlier works which used the general protocol of this study in a technology education setting to examine the benefits of various types of tests criticized them by pointing out that experimental groups in many of the studies expected to be tested whereas the control groups did not. The logical argument was that students in the experimental groups paid more attention to the study of the material and thus, it was difficult to separate the gains made while studying more diligently from those claimed by the investigators to result from the act of taking the test. Only one of those studies demonstrated a clear separation of these two factors ( Haynie, 1990a ), and it was conducted in a secondary school setting with videotaped materials as the teaching-learning method. Another criticism of the protocol was that students did not expect the test scores to be counted in determination of their course grades, so they may not have taken the entire unit of instruction seriously. Lastly, in most of the earlier studies, no attempt was made to insure equal ability of the groups when they entered the study other than randomization of treatment assignment. This investigation examined some new, related questions with careful attention to address these criticisms.
Purpose and Definition of Terms
The purpose of this study was to investigate the effects of take-home tests, in-class tests, and study questions used in anticipation of an upcoming test as aids to retention learning. "Retention learning" as used here refers to learning which lasts beyond the initial testing, and it is assessed with tests administered two or more weeks after the information has been taught and tested ( Haynie, 1990a ; Nungester & Duchastel, 1982 ). A delay period of three weeks was used in this study. "Initial testing" refers to the commonly employed evaluation by testing which occurs at the time of instruction or immediately thereafter. "Delayed retention tests" are research instruments which are administered two or more weeks after instruction and initial testing to measure retained knowledge ( Duchastel, 1981 ; Haynie, 1990a , 1990b , 1991 , 1994 , 1995a , 1997b ; Nungester & Duchastel, 1982 ). The delayed retention test results were the only data analyzed in the experimental portion of this investigation.
The research questions posed and addressed by this study were:
- If delayed retention learning is the objective of instruction, does initial testing of the information aid retention learning better when in-class or take-home tests are given?
- Do students study and prepare differently depending on the type of test that they expect to take?
- Can the effects of differing study methods be detected in delayed retention tests?
Methodology
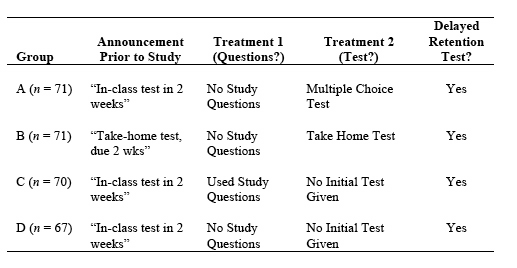
DesignUndergraduate students in 16 intact technology education classes were provided a booklet on "high-tech" materials developed for space exploration. Four intact classes were combined into each group to minimize the effects of variables such as time of day, which graduate assistant conducted classes, and semester in which the course was taken. There were 279 students divided into four groups: (a) No Study Questions, Multiple-Choice (M-C) Test Given (Group A, n = 71), (b) No Study Questions, Take-Home Test Given (Group B, n = 71), (c) Study Questions Given, No Test Given (Group C, n = 70), and (d) No Study Questions, No Test Given (Group D, Control, n = 67). All groups were from the Technology Education metals technology (TED 122) classes at North Carolina State University. Students were freshmen and sophomores in Technology Education, Design, or in various engineering curricula. Students majoring in Aerospace Engineering were deleted from the final sample because much of the material was novel to other students but had previously been studied by these students.
Group assignment to instructor was not randomized due to scheduling restraints, however, all sections were taught by either the researcher or his graduate assistants-each teaching some control and some experimental sections. The course instructor gave no instruction or review to any groups and provided the directions for participation via a scripted standard statement. Four sections were in each experimental group. Random assignment of groups to treatments, deletion of students majoring in Aerospace Engineering, variations in section sizes, and absences on testing dates resulted in final group sizes which were slightly unequal. The first regular subtest in the course covered precision measurement, metallurgy, and general metal processing. Student scores on this subtest, titled "Common Test A", were analyzed to demonstrate equal ability of the groups at the beginning of the study.
InstrumentationAt the beginning of the course it was announced that students would be asked to participate in an experimental study and that they would be learning subject matter reflected in the newly revised course outline while doing so. They were informed that participation in the study was voluntary and that the protocol had been approved by the University Human Subjects Review Committee. The pre-experiment announcements varied according to the intended treatments for each group. Groups A, C, and D were told that they would take a multiplechoice test which would count in their grades. Group B was given a take-home test at the time the booklets were distributed and told to return it in two weeks for a grade. Group C was given a set of study questions at the time the booklets were distributed. All other instructional units in the course were learned by students working in self-paced groups and taking subtests on the units as they studied them. The subtests were administered on three examination dates. The experimental study did not begin until after the first of the three examination dates to insure that students were comfortable in the course and knew the general procedures and expectations of the instructor. All students took "Common Test A" on this first examination date. During the class period following the first examination date, the subtests which had been taken were reviewed and instructions for participation in the experimental study were given.
Table 1
Treatments
All students were given copies of a 34-page study packet prepared by the researcher. The packet was titled "High Technology Materials" and discussed composite materials, heat shielding materials, and nontraditional metals developed for the space exploration program and illustrated their uses in consumer products. The packet was in booklet form. It included the following resources typically found in textbooks: (a) a table of contents, (b) text (written by the researcher), (c) halftone photographs, (d) quotations from other sources, (e) diagrams and graphs, (f) numbered pages, (g) excerpts from other sources, and (h) an index with 119 entries correctly keyed to the page numbers inside. Approximately one-third of the information in the text booklet was actually reflected in the tests. The remainder of the material appeared to be equally relevant but served as a complex distracting field to prevent mere memorization of facts-the length of the booklet combined with the broad array of tables, graphs, and text precluded memorization of the entire document. Students were instructed to use the booklet as if it were a textbook and study as they normally would any class assignment.
All groups were asked to return the booklets and any take-home tests or study questions two weeks after they had been distributed. Groups A, C, and D were told to study the packet and they would be tested on the material in-class two weeks later and Group B was instructed to return the take-home tests on that date as well. On the announced test date, Group A was actually administered the initial posttest, and the take-home tests or study questions were collected from Groups B and C respectively. Groups C and D, however, were not tested initially and were told that the tests were not ready for use, so they were just lucky and would not have to take the planned test. To insure that none of these students felt cheated in terms of their grades, they were told that their highest score on any of the other six subtests would be counted double in the determination of their final grade. None of the students questioned this proposed solution to the dilemma concerning their grades excluding the proposed test on high tech materials. This was not surprising because the material in this unit was more difficult than the material in any of the units covered by the six regular subtests for the course. All booklets were also collected as previously announced.
Three weeks later (after the students had moved on to other subject matter), all groups were asked to take an unannounced delayed retention test on the same material. They were told at this time that the true objective of the experimental study was to see which type of test or study questions promoted delayed retention learning best, and that their earlier tests, if any, were not a part of the study data in any way. They were asked to do their best and told that it did not affect their grades. Participation was voluntary and all students did cooperate.
The same lab complex was used for all groups during instructional and testing periods and while directions were given. This helped to control extraneous variables due to environment. The same teachers provided all directions from prepared scripts and none administered any instruction in addition to the texts. Students were asked not to discuss the study or the text materials in any way. All class sections met for two hours on a Monday- Wednesday-Friday schedule. Half of the students in each group were in 8:00 a.m. to 10:00 a.m. sections, and the others were in 10:00 a.m. to 12:00 noon sections, so neither time of day nor day of the week should have acted as confounding variables. Normal precautions were taken to assure a good learning and testing environment.
Data CollectionThe initial test for Group A was a 20-item multiple-choice test. The items had five response alternatives. The test operated primarily at the first three levels of the cognitive domain: knowledge, comprehension, and application. The take-home test given to Group B was a parallel form of the multiple-choice test given to Group A, except that it required prose answers. The same information was reflected in both tests. The study questions given to Group C were actually the same items used on the take-home test for Group B. The only difference in these two documents was the heading.
The delayed retention test was a 30-item multiple-choice test. Twenty of the items in the delayed retention test were alternate forms of the same items used on the initial multiple-choice test for Group A. These served as a subtest of previously tested information for Groups A and B and covered the same information as the study questions used by Group C. The remaining ten items were similar in nature and difficulty to the others, but they had not appeared on either form of the initial test nor in the study questions. These were interspersed throughout the test and served as a subtest of new information.
The delayed retention test was developed and used in a previous study ( Haynie, 1990a ). It had been refined from an initial bank of 76 paired items and examined carefully for content validity. Cronbach's Coefficient Alpha procedure was used to establish a reliability of .74 for the delayed retention test. Item analysis detected no weak items in the delayed retention test.
Data AnalysisStudents were given initial instructions concerning the learning booklets and directed when to return the booklets and take the test. The multiple-choice test (Group A) was administered on the same day that the booklets were collected. Booklets, take-home tests (Group B), and study questions (Group C) were also collected on that day. The unannounced delayed retention test was administered three weeks later. Data were collected on mark-sense forms from National Computer Systems, Inc.
The data were analyzed with SAS (Statistical Analysis System) software from the SAS Institute, Inc. The answer forms were scanned and data stored on floppy disk. The General Linear Models (GLM) procedure of SAS was chosen for omnibus testing rather than analysis of variance (ANOVA) because it is less affected by unequal group sizes. A simple one-way GLM analysis was chosen because the only experimental data consisted of the Delayed Retention Test means of the three groups. Follow-up comparisons were conducted via Least Significant Difference t -test (LSD) as implemented in SAS. Alpha was set at the p < .05 level for all tests of significance.
Findings
The means and standard deviations of the four groups on the "Common Test A" are shown in Table 2. Since this test was actually taken the class day before study materials were distributed and explained, a finding of F (3,275) = 0.30, p < 0.826 confirmed that the groups were of generally equal ability at the beginning of the study.
Table 2
Means, Standard Deviations, and Sample Sizes for the "Common Test A" Scores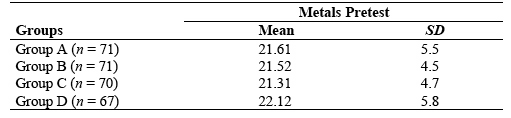
The means, standard deviations, and final sizes of the four groups on the Delayed Retention Test are presented in Table 3. The overall difficulty of the Delayed Retention Test can be estimated by examining the grand mean and the range of scores. The grand mean of all participants was 17.67 with a range of 6 to 27 on the 30-item test. No student scored 100% and the grand mean was close to 50%, so the test was relatively difficult. The grand mean, however, was not used in any other analysis of the data.
Table 3
Means, Standard Deviations, and Sample Sizes for Delayed Retention Test Scores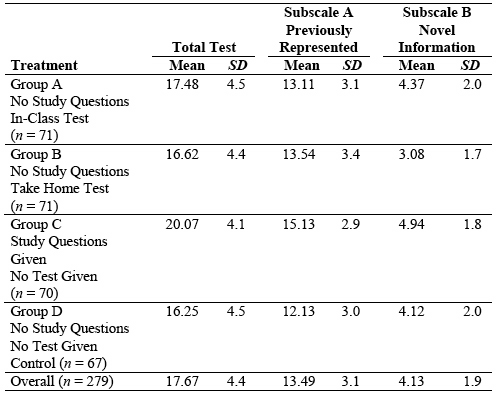
The GLM procedure was then used to compare the four treatment groups on the means of the Delayed Retention Test scores. A significant difference was found among the total test means: F (3, 275) = 10.60, p < .0001 (see Table 4). Follow-up comparisons were conducted via t -test (LSD) procedures in SAS. The results of the LSD comparisons on the total test scores are shown in Table 5. The critical value used was t (275) = 1.97, p < .05. The mean of the experimental group that had used the study questions, Group C, was significantly higher than all of the other experimental and control groups. The means of Groups A, B and D (Control), however, did not differ significantly from each other on the total test scores.
Table 4
Comparison of Group Means on the Total Test Via GLM Procedure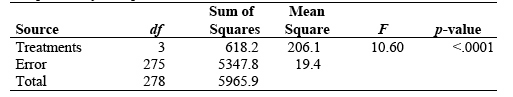
Table 5
Contrasts of Rank Ordered Means on the Total Test Via LSD Procedure* Groups with which means differed significantly, p < .05.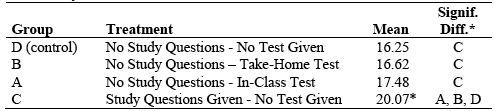
There were also significant findings in the two subscales of the delayed retention test. On the 20-item subscale of previously represented information (through a previous test or the study questions), there were significant differences: F (3, 275) = 10.96, p < .0001 (see Table 6). The LSD follow-up comparisons were made with a critical value of t (275) = 1.97, p < .05. These results are shown in Table 7. Group C (study questions) outscored the other groups and Group B (take-home test) also outscored the control Group D.
Table 6
Comparison of Group Means on the Subscale of Previously Represented Information Via GLM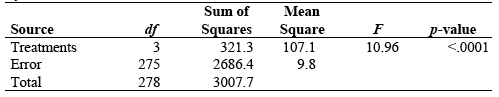
Table 7
Contrasts of Rank Ordered Means on the Subscale of Previously Represented Information Via LSD Procedure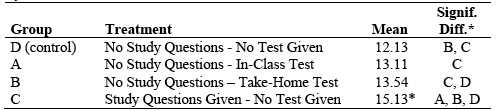
* Groups with which means differed significantly, p < .05.
Results were more complicated in the subscale on material that was not previously represented. The GLM finding on this subscale was F (3, 275) = 11.80, p < .0001 (see Table 8).
Table 8
Comparison of Group Means on the Subscale of Novel Information Via GLM Procedure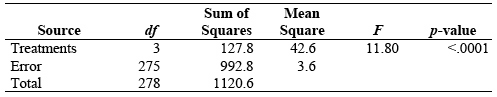
The results, with a finding of t (275) = 1.96, p < .05, are shown in Table 9. The take-home test group (Group B) scored significantly lower on this subtest than any other group. One would expect that the group which used the study questions (Group C) should score about the same as Group B because they had essentially the same treatment-recall that the study questions were the exact same document as the take-home test except for the title and heading directions. This, however, was not found; the take-home test group scored lowest on this subtest and the group with the study questions scored the highest of all groups.
Table 9
Contrasts of Rank Ordered Means on the Subscale of Novel Information Via LSD Procedure* Groups with which means differed significantly, p < .05.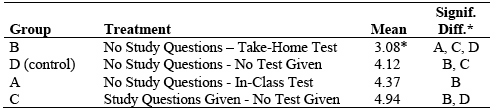
Three research questions were addressed by this study:Discussion
- If delayed retention learning is the objective of instruction, does initial testing of the information aid retention learning ? A very consistent finding of several previous studies has been that all tested groups have outscored those who did not take an initial test regardless of the form of the test ( Haynie 1990a , 1990b , 1991 , 1994 , 1995a , 1997b ; Nungester & Duchastel, 1982 ). In the present study, this effect could not be clearly demonstrated with significant findings, however, there was a non-significant trend which was generally in harmony with the findings of the previous studies.
- Do students study and prepare differently depending on the type of test they expect to take ? Within the constraints of this study, it appears that they do. Since the students who experienced the take-home test significantly outscored the control group on the subtest of previously represented information (on which they had the second highest ranked mean) but performed the worst of all groups on the subtest of novel information, it appears that they used the take-home test document as a "road map" and hunted only for the exact information needed to answer the specific questions on the take-home test. Other groups, even the control group, must have studied more broadly in the conventional manner expected. It appears that the take-home test group skillfully used the table of contents and index of the booklet to seek out the specific answers required on the take-home test, and they may not have read the entire booklet. The fact that the group with the study questions (which were the same questions as those on the take-home test) scored higher on this subtest appears to indicate that they did read and study the entire booklet and merely referred to the study questions for additional indicators of the intended goals of the instructor.
- Can the effects of differing study methods be detected in delayed retention tests ? If the conclusion posed above is correct, then it would seem that this study has succeeded in detecting differing study methods among these students. It seems that all of the groups, except for the take-home test group, likely read and studied the booklet in a broad manner while the take-home test group simply hunted for the required answers. The conclusion here is that, in general, students do likely study more fully when they expect an in-class test than when they are given a take-home test.
Recommendations
Since testing consumes such a large amount of teacher and student time in schools, it is important to learn as much as possible about the effects of tests on learning. It is important to maximize every aspect of the learning and evaluation process. The ability of teachers to develop and use tests effectively has been called into question recently; however, most research on testing has dealt with standardized tests. The whole process of producing, using, and evaluating classroom tests is in need of further research. This study was limited to one educational setting. It used learning materials and tests designed to teach and evaluate a limited number of specified objectives concerning one body of subject matter. The sample used in this study may have been unique for unknown reasons. Studies similar in design which use different materials and are conducted with different populations will be needed to achieve more definite answers to these research questions. However, on the basis of this one study, it is recommended that:
If an instructor wishes to use a take-home test, and the goal is a high level of retention learning, the instructor should be very careful to design the takehome test so that the required responses will include all of the important information that the students should learn.
- When useful for evaluation purposes, classroom testing should continue to be employed due to its positive effect on retention learning,
- Students should know in advance how they will be tested because of the effect this information may have on their study habits, and
- Aids to independent learning in the form of study questions appear to enhance retention learning without tempting students to take a lackadaisical approach as they may do with a take-home test.
The time devoted by teachers and students to classroom testing apparently does have learning value in addition to its utility for evaluation purposes. The value of tests in promoting retention learning has been demonstrated here, and research questions about anticipation of tests and the effects of take-home tests have been addressed; however, there remain many more potential questions about classroom testing. Further research is needed to help teachers maximize the learning benefits of tests.
References
Carter, K. (1984) . Do teachers understand the principles for writing tests? Journal of Teacher Education , 35(6), 57-60.
Duchastel, P. (1981) . Retention of prose following testing with different types of tests. Contemporary Educational Psychology , 6, 217-226.
Ellsworth, R. A., Dunnell, P., & Duell, O. K. (1990) . Multiple choice test items: What are textbook authors telling teachers? Journal of Educational Research , 83(5), 289-293.
Fleming, M., & Chambers, B. (1983) . Teacher-made tests: Windows on the classroom. In W. E. Hathaway (Ed.), Testing in the schools: New directions for testing and measurement, No. 19 (pp.29-38). San Francisco: Jossey-Bass.
Gullickson, A. R., & Ellwein, M. C. (1985) . Post hoc analysis of teacher-made tests: The goodness-of-fit between prescription and practice. Educational Measurement: Issues and Practice , 4(1), 15-18.
Haynie, W. J. (1983) . Student evaluation: The teacher's most difficult job. Monograph Series of the Virginia Industrial Arts Teacher Education Council , Monograph Number 11.
Haynie, W. J. (1990a) . Effects of tests and anticipation of tests on learning via videotaped materials. Journal of Industrial Teacher Education , 27(4), 18-30.
Haynie, W. J. (1990b) . Anticipation of tests and open space laboratories as learning variables in technology education. In J. M. Smink (Ed.), Proceedings of the 1990 North Carolina Council on Technology Teacher Education Winter Conference . Camp Caraway, NC: NCCTTE.
Haynie, W. J. (1991) . Effects of take-home and in-class tests on delayed retention learning acquired via individualized, self-paced instructional texts. Journal of Industrial Teacher Education , 28(4), 52-63.
Haynie, W. J. (1992) . Post hoc analysis of test items written by technology education teachers. Journal of Technology Education , 4(1), 27-40.
Haynie, W. J. (1994) . Effects of multiple-choice and short answer tests on delayed retention learning. Journal of Technology Education , 6(1), 32-44.
Haynie, W. J. (1995a) . Inclass tests and posttest reviews: Effects on delayedretention learning. North Carolina Journal of Teacher Education , 8(1), 78-93.
Haynie, W. J. (1995b) . An analysis of tests developed by local technology teachers . Unpublished manuscript.
Haynie, W. J. (1997a) . An analysis of tests authored by technology education teachers. Journal of the North Carolina Council of Technology Teacher Education , 2(1), 1-15.
Haynie, W. J. (1997b) . Effects of anticipation of tests on delayed retention learning. Journal of Technology Education , 9(1), 20-46.
Hoepfl, M. C. (1994) . Developing and evaluating multiple choice tests. The Technology Teacher , 53(7), 25-26.
Herman, J., & Dorr-Bremme, D. W. (1982) . Assessing students: Teachers' routine practices and reasoning . Paper presented at the annual meeting of the American Educational Research Association, New York.
Mehrens, W. A. (1987) . "Educational Tests: Blessing or Curse?" Unpublished manuscript, 1987.
Mehrens, W. A., & Lehmann, I. J. (1987) . Using teacher-made measurement devices. NASSP Bulletin , 71(496), 36-44.
Moore, K. D. (2001) . Classroom teaching skills , 5 th ed. New York: McGraw-Hill.
Newman, D. C., & Stallings, W. M. (1982) . Teacher Competency in Classroom Testing, Measurement Preparation, and Classroom Testing Practices . Paper presented at the Annual Meeting of the National Council on Measurement in Education, March. (In Mehrens & Lehmann, 1987).
Nitko, A. J. (1989) . Designing tests that are integrated with instruction. In R. L. Linn (Ed.), Educational measurement (3rd ed., pp. 447-474). New York: Macmillan.
Nungester, R. J., & Duchastel, P. C. (1982) . Testing versus review: Effects on retention. Journal of Educational Psychology , 74(1), 18-22.
Stiggins, R. J., & Bridgeford, N. J. (1985) . The ecology of classroom assessment. Journal of Educational Measurement , 22(4), 271-286.
Stiggins, R. J., Conklin, N. F., & Bridgeford, N. J. (1986) . Classroom assessment: A key to effective education. Educational Measurement: Issues and Practice , 5(2), 5-17.
W. J. Haynie, III ( Jim_Haynie@ncsu.edu ) is Associate Professor in the Department of Mathematics, Science, and Technology Education at North Carolina State University, Raleigh.