Inside the Black Box: Exploring the Value Added by Career and Technical Student Organizations to Students’ High School Experience
Corinne Alfeld
National Research Center for Career and Technical EducationDavid M. Hansen
Steven R. Aragon
University of Illinois at Urbana-ChampaignJames R. Stone, III
National Research Center for Career and Technical EducationAbstract
This study explored the hypothesis that Career Technical Student Organizations (CTSOs) provide a variety of experiences that either directly or indirectly affect three important outcomes of secondary education: achievement, transition to postsecondary education and training, and employability. A pre-post-test comparison study of high school students (n=1797) in CTE classes that included CTSO classes, CTE classes without a CTSO, and general (non-CTE) classes was conducted over the course of one academic year. Compared to the other groups, CTSO students reported higher levels on a variety of positive behavioral, academic, and psychosocial measures at the start of the year, but they did not report as much gain over the year. More types of participation in CTSOs was associated with greater academic motivation, academic engagement, grades, career self-efficacy, college aspirations, and employability skills. Finally, of four organizational elements of CTSOs, competitions were found to have the most positive effects.
Introduction
Even in the era of No Child Left Behind , the dropout rate in American high schools hovers at 30%, on average, and for certain minority groups it is as high as 45% ( Swanson, 2004 ). Research on high school dropouts shows that lack of engagement with the school, both socially and academically, and lack of personal relationships with adults are among the top reasons for student dropout (Anderman & Freeman, 2004; Arroyo, Rhoad, & Drew, 1999 ; National Research Council, 2004 ; Somers & Piliawsky, 2004 ). Efforts at reducing the dropout rate have included early interventions, mentoring, alternative schooling, after-school programs, and individualized instruction ( Arroyo et al., 1999 ; Smink & Schargel, 2004 ).
Extracurricular activities seem especially beneficial to students at-risk for dropout. A study by Mahoney, Cairns, and Farmer (2003) found that consistent extracurricular participation in adolescence was linked to higher educational status in young adulthood, which was in turn linked to interpersonal competence. Mahoney and Cairns (1997) found that those who participated in extracurricular activities had lower rates of high school dropout, and both Camp (1990 ; Camp et al., 2000) and Guest and Schneider (2003) found that students’ academic achievement is enhanced by participation in extracurricular activities. 1
Recent research has shown that career and technical education (CTE), which is co-curricular rather than extra-curricular, has been found to play a role in keeping youth in school ( e.g., Plank, 2001 ; Plank, Deluca, & Estacion, 2005 ). CTE courses can help students stay engaged in school by exposing them to skills that are directly applicable in the “real world” ( Berns & Erickson, 2001 ; Bransford, Brown & Cocking, 2000 ; Stone & Alfeld, 2004 ). More than 95% of high school students participate in some form of CTE, including coursework, work-based learning (WBL), and career pathways ( Levesque, 2003 ). Despite “vocational” education’s traditional stigma, it has recently been shown that academic skills can be enhanced in CTE content courses ( Stone, Alfeld, Pearson, Lewis, & Jensen, 2006 ). Indeed, offering more, and more rigorous, CTE courses is one way that schools can provide more authentic instruction, which has been recommended as a strategy for enhancing student learning ( Newman & Wehlage, 1995 ).
Many CTE programs also include student organizations ( Scott & Sarkees- Wircenski, 2004 ) targeted towards more intense involvement in a particular field (e.g, business and marketing; health). Career and Technical Student Organizations (CTSOs) help students explore career paths, prepare youth to become productive citizens and assume leadership roles in their communities ( Reese, 2003 ). However, there has not been as much research conducted on the effects of CTSOs, as opposed to academic or out-of-school activities, on young people’s development. This project seeks to better understand whether and how high school students benefit from participating in career and technical student organizations.
Organizational Elements of CTSOs
We believe that CTSOs provide four distinctive kinds of experiences for high school students who participate: (1) leadership, (2) professional development, (3) competitions, and (4) community service. As will be explained in the hypothesis section, we believe that these organizational elements of CTSOs produce beneficial effects on students by reinforcing the learning that took place in the CTE course, and by providing an opportunity to put this learning into practice. For the purpose of this study, we focus on what CTSOs add to CTE above and beyond the usual emphases of CTE, which include career pathways or career academies, tech prep, and work- based learning activities (e.g., cooperative education, job shadowing, mentoring, school-based enterprise, and internship/apprenticeship). All of these CTE-related activities are thought to help students form career identities and give them the professional and work skills they need to launch their careers. Because all CTE programs offer these, whether or not they offer a CTSO, this study examines the benefits provided by the distinctive organizational elements of CTSOs. We will now describe these four elements more fully.
Within CTSOs, there are many opportunities for students’ leadership development , including becoming an officer at the local, regional, or national level. In a study of past FFA participation in the role of community leadership development, Brannon, Holley, and Key (1989) found that former FFA members had an impact on the development and success of community leaders. Dormody and Seevers (1994) found that participation in FFA leadership activities predicted the leadership life skill development of members, and a follow-up study by Wingenbach and Kahler (1997) supported these findings.
Competitive events serve to test both technical and non-technical job-related competencies. Many of these events integrate academic knowledge into industry- developed problem scenarios. Preparation for the competitive events provides hands- on experience in different trade, technical and leadership fields; develops job-related technical skills and competencies; offers recognition to participants; and serves to ensure business and industry involvement in career and technical education programs. In fact, contests are often run with the help of industry, trade associations, and labor organizations, and test competencies are set and judged by industry. Blakely, Holschuh, Seefeldt, Shinn, Smith, and Vaughn (1993) , in a study of the perceived value of FFA contests by students and adults, found that students listed teamwork, responsibility for a project, learning an area of knowledge, competing with others, talking in front of people, learning a specific skill and learning to win in descending order.
It is generally assumed that both the content of the CTE program and the skills and experiences acquired in the CTSO contribute to professional development (the acquisition of knowledge and competencies that will be useful for future work in the profession). Most CTSOs provide structured professional development activities for their members, including guest speakers, workshops, and conferences. There has been little research on this aspect of CTSOs, but one study found that SkillsUSA members’ perceptions of their level of personal/professional development increased as their participation in SkillsUSA increased ( Gordon, Yocke & Bess, 1995 ).
Finally, many CTSO members engage in some form of community involvement , such as volunteering in community service activities, but his element of the CTSO experience has been the most ignored in research studies, and much evidence that is presented is anecdotal.
Problem and Purpose
In sum, many elements of CTSOs are thought to have positive effects on students ( Brown, 2002 ). However, little research exists to support the claims of these organizations of the benefits to their members ( Lankard, 1996 ; Zirkle & Connors, 2003 ). The handful of studies over the past 25 years that examined the various effects of participation in CTSOs on students were all conducted on individual CTSOs; none gathered data from all eight. In addition, only a few specifically addressed the role of CTSO participation in developing technical and employability skills. To date, there has been no large scale, comprehensive study that examines the immediate or long-term benefits of participation in CTSOs with respect to the development and assessment of employability skills or other indicators of student success, such as achievement and post-high school pathways ( Camp et al., 2000 ; National Dissemination Center for Career and Technical Education, 2002; Zirkle & Connors, 2003 ).
We sought to remedy this situation by conducting a study that would fill in some of the gaps in the research. In this large, quasi-experimental research project using a nonequivalent control-group design ( Gall, Gall, & Borg 1999 , p. 402), we surveyed students and teachers in all eight of the CTSOs across multiple states in the fall and the spring of one academic year, and we collected similar data from two comparison groups. While each CTSO has its own content, procedures, and priorities, we believe that CTSOs as a whole are distinctive enough from other school and non-school activities that, when compared to non-CTSO members, participation may produce similar benefits for students across the different CTSOs.
Our hypotheses, which were guided by the literature and discussions with national CTSO directors, were as follows: CTSOs provide four distinctive kinds of experiences for high school students who participate: leadership, professional development, competitions, and community service. These organizational elements , in turn, impact important high school achievement and transition outcomes. We expected that there would be effects on achievement and psychosocial variables that have been linked with achievement in previous education research. We hypothesized specifically that high school CTE students who participate in CTSOs would show significant advantages on these variables (1) over students in CTE programs that do not offer a CTSO and (2) over comparable students who are not in CTE.
Research Questions
This study is designed to look into the “black box” of CTSOs and test the many assumptions and claims about their value. We focus on the links between participation in a CTSO and both psychosocial (motivation, academic engagement, civic engagement) and achievement (career self-efficacy, grades, employability skills, college aspirations) outcomes; the latter set of variables may indicate potential post high school success. Our theoretical model (see Figure 1) posits that CTSO membership will positively affect these outcomes. We ask: “To what extent do CTSOs affect important aspects of the high school experience (above and beyond stand-alone CTE programs)?” Specifically, three specific research questions are of interest:
- Is CTSO membership over one academic year associated with an increase in positive outcomes compared to non-CTSO students (CTE-without-CTSO and general classes)?
- Is the degree of involvement in the activities of a CTSO over one academic year associated with increases in CTSO students’ positive outcomes?
- Which organizational elements of CTSOs (leadership, professional development, community service, and/or competitive activities) are associated with increases in CTSO students’ positive outcomes?
Based on the findings from our literature review, including the anecdotal claims made by CTSOs and their members, we expect to find support for our hypotheses that students who participate in CTE classes with a CTSO component will have higher levels of motivation, academic and civic engagement, career self- efficacy, employability skills, grades, and college aspirations compared both (a) with students in CTE classes without a CTSO component and (b) with non-CTE students.
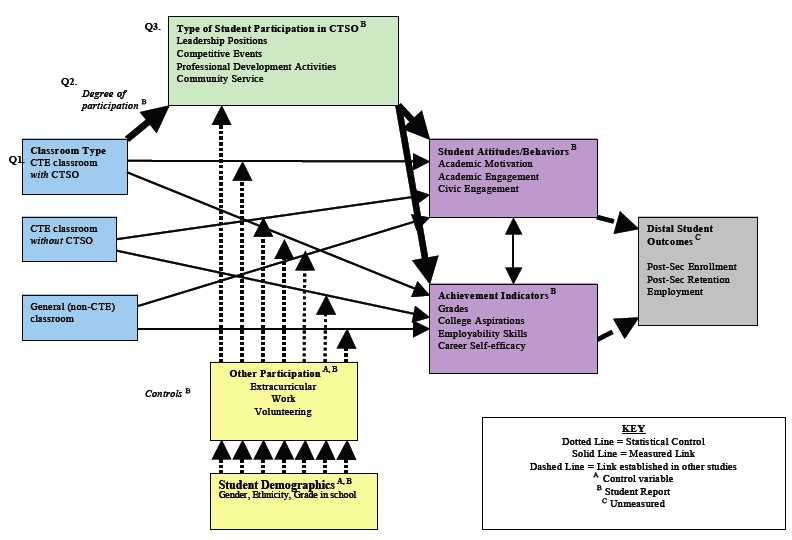
Figure 1: Theoretical Model of the Effect of CTSOs on High School Students
Student Variables
The following is a discussion of the specific student variables that we hypothesize will be affected by participation in a CTSO. Academic motivation is predictor of educational persistence ( Wigfield & Eccles, 2002 ). Contexts that motivate students to learn are those (1) that offer interesting, challenging, and meaningful tasks and activities; (2) where teachers help students develop effective learning and problem-solving strategies, foster an environment that rewards effort without punishing mistakes, and provide feedback about progress; and (3) where both teachers and peers support learning and have mutual respect for each other (see Perry, Turner & Meyer, 2006).
A comprehensive review of the classroom engagement literature concluded that peer learning communities, authentic instruction, and classrooms that support autonomy (among other factors) can facilitate students’ academic engagement ( Fredricks, Blumenfeld, & Paris, 2004 ). According to the developers of the National Study of Student Engagement ( NSSE, 2004 , 2005 , 2006 ), the time and energy students devote to educationally purposeful activities is the single best predictor of their learning and personal development. The National Academy of Sciences, in the report, Breaking Ranks II (NAS, 2004), suggests that engaging youth and fostering achievement include providing opportunities to use school learning in improving both their own lives and other lives in their communities. Due to their co-curricular nature, CTSOs offer students the opportunity to apply knowledge and skills from their academic lessons directly to real world situations, which is what Newman, Secada and Wehlage (1995 ) describe in their guidelines for authentic learning.
While there has been a revival of the research on civic engagement in recent years, there is not yet a single definition of it in the literature. Other terms include citizenship, service learning, political attitudes, patriotism, community service, social responsibility, and volunteering. In a review of research articles on service learning, Billig (2002) demonstrated that it produces measurable increases in students’ academic achievement, personal and social development, civic responsibility, and career awareness. Camino and Zeldin (2002) documented the importance of responsibility and leadership that community service can provide, and Stott and Jackson (2005) found that students who engaged in service learning reported improvement in personal awareness, social skills, learning skills, career interest, and character education.
Employability Skills include workplace basics such as knowing how to learn; reading, writing, and computation; communicating effectively; creative thinking and problem-solving; personal management; group effectiveness; and influencing others (NCCVSO, 1990). Employers report that employees who have a better understanding of workplace skills are more prepared for changes in workplace requirements ( Wills, 1995 ). The federal government has taken steps towards officially identifying these skills (e.g. forming the Secretary’s Commission on Achieving Necessary Skills (SCANS), U.S. Department of Labor, 1992 ; National Skill Standards Board (NSSB) established by Congress in 1994, Bailey & Merritt, 1995 ).
Self-efficacy is a person’s belief in his/her competency to perform well and has been linked empirically to persistence and achievement behaviors (Bandura, 1986, 1989; Schunk, 1989 , 1991 ). Self-efficacy beliefs are expectations for performance ( Graham & Weiner, 1996 ) and are usually measured using scales that focus on specific situations and tasks ( Betz & Hackett, 2006 ). Individuals with high self-efficacy have been shown to exert more effort in the face of difficulty and to persist longer ( Pintrich & Schunk, 1996 ). Self-efficacy for finding and pursuing a career pathway for oneself is a valued outcome of high school CTE ( ACTE, 2006 ). Through various activities in a career-related domain, CTSOs may help students develop skills and confidence for successful and satisfactory job-seeking.
Grades in school are one of the most important indicators of student success and potential for further achievement. Colleges rely on high school student applicants’ grade point averages (GPA) to predict their ability to complete postsecondary education, and employers use applicant’s GPA to judge applicants’ likely success on the job.
Researchers have demonstrated that college aspirations are shaped by forces in students’ family, peer, and school environments. Decades of prior research has shown that family background factors play the largest role in determining educational attainment ( Erikson & Goldthorpe, 1993 ), but aside from demographic characteristics, student psychosocial and behavioral variable have also been shown to affect educational achievement and future plans ( Eccles et al., 1983 ). Although extracurricular activities have not been found to affect grades or college aspirations ( Hunt, 2005 ), experience in a career-oriented activity such as a CTSO may influence an individuals’ educational goals.
In sum, we hypothesize that participation in a CTSO will affect students’ achievement motivation, academic engagement, civic engagement, career self- efficacy, employability skills, grades, and college aspirations. Though we do not measure more distal outcomes, the variables that we do measure have been shown in other research to be linked to success in postsecondary and employment (refer again to Figure 1). Because other non-school activities can also provide the benefits that CTSOs claim, it is important to measure and control for these variables in any analysis of the impact of CTSOs. The most popular activities are extracurricular activities, volunteering, and part-time work; because they are not a focus of this study, we do not describe them here (for a more complete literature review, see Alfeld et al., forthcoming).
Methods
Design
Our design was a four group, cross sectional, pre-test/post-test design for one academic year (2004-2005). Group [1] was comprised of CTE students in an active CTSO. Group [2] included students in a CTE program without a CTSO. Groups [3] and [4] were non-CTE students from each of the schools from which the first two groups were drawn and functioned as “controls” or “counterfactuals,” as shown in Table 1 below.
Table 1
Sample Design CTE Classrooms Non-CTE Classrooms CTSO schools [1] With CTSO
(n=27 classrooms)→ [3] General Students
(n=27 classrooms)Non-CTSO schools [2] Without CTSO
(n=22 classrooms)→ [4] General Students
(n=22 classrooms)
For analytical purposes, however, we used only three groups to make two comparisons, as depicted in Figure 2: (1) CTE-with-CTSO classrooms compared to CTE-without-CTSO classrooms and (b) CTE-with-CTSO classrooms compared to all general classrooms. The two groups of general comparison classrooms were aggregated to ensure that this counterfactual group was as representative of students in the general population as possible. Thus, there were three groups used for analysis: [1] CTE with CTSO (referred to hereafter simply as “CTSO”), [2] CTE without CTSO (referred to hereafter simply as “CTE”), and general ([3]+[4]).
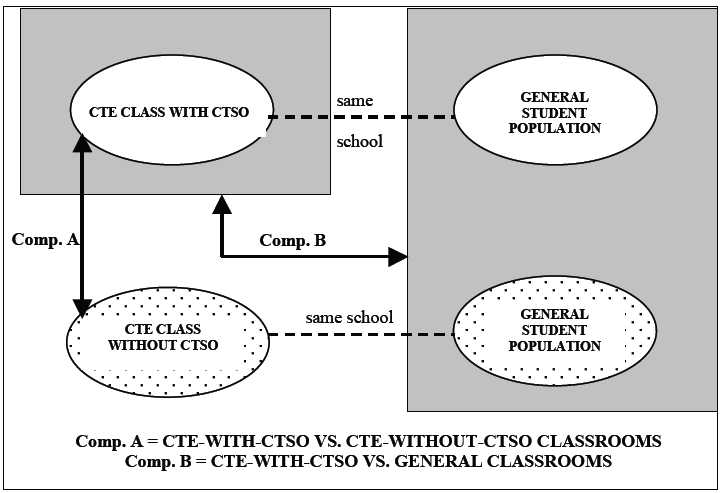
Figure 2: Quasi-experimental Design Comparisons
Sample
We recruited the Group 1 (CTSO) schools with the help of national organizations of CTSOs. Group 2 (CTE) schools were recruited with the help of state directors of CTE in each of the states in which we conducted the study: Ohio, Illinois, Oklahoma, Kentucky, Tennessee, Missouri, Georgia, California, Texas, and Minnesota. We made sure that the CTE classrooms did not have a CTSO at their school at all so that the voluntary nature of CTSO membership did not confound the results. Each of the eight CTSOs was studied in at least 2 states. We were able to recruit 27 CTSO classrooms and 22 CTE classrooms.
Groups 3 and 4 (general, or non-CTE, classrooms) were recruited through the Groups 1 and 2 teachers, respectively, as follows: Both CTSO and CTE teachers were asked to find (1) another teacher in their school who taught a general course such as English or social studies who would also agree to take part in the study as a comparison classroom, and (2) someone in the school such as a counselor to act as a “liaison” -- a neutral third party who would administer the surveys in both the CTE and the general classrooms. Comparison classrooms in the “general” group were primarily academic subjects (e.g., English, social studies) but not necessarily high- level ones; the important criterion was that they were not a CTE class. 2
Liaisons’ responsibilities included distributing and collecting consent forms from students (parents were sent consent forms to return only if they did not want their child to participate in the survey); assigning ID numbers to students; keeping a confidential master key between Fall and Spring; ensuring that students used the same ID on their Fall and Spring surveys; and returning all of the materials to the researchers. In return for their cooperation, each liaison was sent their preference of either a $50 check or $50 Wal-mart gift card after each survey administration (once in the Fall and once in the Spring); teachers (CTE, CTSO, and general) were each given their preference of a $25 check or Wal-mart gift card; and participating students were each given a $5 Wal-mart gift card for each administration of the survey. 3
Measures/Instrumentation
Surveys were administered in the fall of 2004 and spring of 2005. Identical questions were asked to each group at each time point. General and CTE student surveys were similar, asking about the class they were in while taking the survey. The CTSO student survey asked additional questions about the CTSO activities. Further, because there were 8 different CTSOs, the wording of the CTSO-specific questions differed slightly due to different terminology for activities in each of the organizations. All survey items relate directly to the theoretical model (Figure 1).
The student questionnaire was developed using items and scales from various sources. Items regarding level (e.g., local, regional, national) and type (e.g., elected leader, committee member) of participation in CTSO activities, as well as participation in other activities (e.g., sports, 4-H), were taken from Connors and Swan’s (2001) Youth Participation in Leadership Activities Questionnaire.
Items for the employability scales were adapted from the Youth Experience Survey (YES, 2.0; Hansen & Larson, 2005 ). The YES was designed to survey high school aged youth about their experiences in organized youth activities (e.g., CTSO) within six domains of development ( Hansen, Larson, & Dworkin, 2003 ). For the present study, items from the YES were selected to focus on students’ employability experiences in a CTSO classroom. The selected items came from four of the six domains: initiative (6 items), prosocial norms (3 items), teamwork and social skills (5 items), and cognitive skills (4 items).
The academic engagement scale was adapted from and in collaboration with the High School Survey of Student Engagement ( HSSSE; Indiana University ); as mentioned earlier, it is based on the college version called the National Survey of Student Engagement ( NSSE ). The academic motivation scale is the college student version (as opposed to the elementary school version) of the Motivated Strategies for Learning Questionnaire ( MSLQ ) developed by Pintrich, Smith, Garcia, and McKeachie (1991) . The civic engagement scale is adapted from the Civic Responsibility Survey developed at the Service-Learning Research and Development Center, University of California at Berkeley ( Furco, Muller, & Ammon, 1998) ; and the self-esteem scale is the ASDQII developed by Herb Marsh (1999). All measures were used with the permission of the authors.
Students’ college aspirations were measured by asking the students how far they expect to go in school; responses could range from “less than high school” to “doctoral degree” (c.f., NELS:88 ; Mortimer, 2003 ). Grades were students’ self reports of what grades they receive (e.g., mostly A’s; A’s and B’s; B’s, etc.). The career self-efficacy scale is that of Betz, Klein, and Taylor (1996) .
Extracurricular participation is the sum of the possible extra curricular activities that students could participate in (e.g., athletics, boy/girl scouts, chess club). Volunteer and part-time work hours were measured by asking students how much time they spend in each type of activity. For CTSO participants, activities in each of the four hypothesized organizational elements (leadership, competition, professional development, and community service) in which students could participate were summed across levels (local, regional, national) at which they participated. For example, a student’s leadership score could range from 0 (no participation at any level) to 25 (participation in all possible leadership activities at all levels). 4
Surveys were developed in the spring of 2004 and piloted at DECA’s spring conference. Feedback from student focus groups after pilot testing an early survey draft suggested eliminating scale items that students found repetitive and redundant. Shortened surveys were again piloted, this time at SkillsUSA’s summer 2004 conference, and scale reliabilities were acceptable (alphas > .80).
Results
Of the 2485 students who took the Fall 2004 survey, 1797 of these participated again in the Spring 2005 survey. Thus, there was a 72% retention rate. Students who took the survey in both the fall and spring did not differ from those who only took the survey at one time point on demographics or on key measures. Nevertheless, we limited our analyses for this report to those students who had participated in both Fall and Spring to get an accurate measure of the effects of a full academic year.
Descriptives
The sample comprised mostly juniors/seniors (72% in general, 66% in CTE, and 78% in CTSO classes). The general and CTSO classes had 55% and 53% female students, respectively, whereas the CTE classes were 48% female. The sample was primarily white across all three types of classrooms (90% in CTE and CTSO classes, 87% in general classes). CTE and CTSO students reported earning more As and fewer Bs than did general students, while general students report receiving more Ds than the CTE and CTSO students. CTSO students reported the highest participation, followed by general students and CTE students, in extracurricular activities (not including anything CTSO-related). Fewer CTSO students (19% compared to 36% and 45%) reported volunteering 0 hours per week, while more CTSO students (7%, compared to 3% and 4%) checked the “more than 10 hours per week” category. Almost twice as many CTE and CTSO (both approx. 20%) as general (approx. 10%) students reported working for pay more than 20 hours per week.
In terms of the outcome variables in our study, Table 2a shows means on each of the measured characteristics in the Fall, by group, and Table 2b shows the Spring means. CTSO students appear to be slightly higher on all measures.
Table 2a
Means (Fall) Scale General class CTE class CTSO class Academic Engagement 2.53 2.49 2.62 1-4 Academic Motivation 3.68 3.69 3.72 1-5 Civic Engagement 3.89 3.72 3.97 1-5 Career Self-Efficacy 3.90 3.88 3.93 1-5 Employability Skills 2.38 1.84 2.43 1-4
Table 2b
Means (Spring) Scale General class CTE class CTSO class Academic Engagement 2.54 2.52 2.62 1-4 Academic Motivation 3.42 3.43 3.51 1-5 Civic Engagement 3.92 3.87 3.95 1-5 Career Self-Efficacy 3.89 3.69 3.89 1-5 Employability Skills 2.47 1.80 2.48 1-4 Table 3 shows average levels of CTSO students’ participation in each of the four organizational elements (CTE and general students were not asked theses questions). It should be noted that the range of responses varied quite a bit across the types of activities (the maximum ranged from 3 types of community service participation to 6 types of leadership and professional development participation).
Table 3
CTSO Participation Means (Spring) Min.-Max.
ReportedGeneral class CTE class CTSO class # Leadership Activities 1 N/A N/A .94 0-6 # Competitive Activities N/A N/A .72 0-5 # Prof. Devel. Activities N/A N/A .60 0-6 # Community Service Activities N/A N/A .28 0-3 1 All CTSO activity participation was reported in the Spring about the past year
Hierarchical Linear Models
The analyses will follow the order of the research questions in testing our theoretical model. As was explained earlier, we hold potential confounding variables (volunteering, part-time work, and extracurricular participation) constant in the statistical models. In addition, to eliminate other possible confounds and examine the experience for the average high school student, we also control for gender, race/ethnicity, and grade in school.
Research Question #1 Hierarchical Linear Modeling (HLM; Bryk & Raudenbush, 1992 ) software was used because of the nested nature of the data: students within classrooms. The HLM analyses were conducted in the order of the research questions. The first analysis (Table 4a) shows the results for academic motivation, academic engagement, civic engagement, college aspirations, grades, career self-efficacy, and employability skills (i.e., results of seven separate models shown in one table). The first model (first set of results in rows in Table 4a) includes only the controls for gender (female/male), ethnicity (white/non-white), grade in school, extracurricular involvement, hours spent volunteering, and hours spent working per week. The second model (second set of rows in Table 4a labeled Model 2) includes these control variables and adds group membership (CTSO vs. CTE) to detect whether this makes a difference above and beyond the controls, as hypothesized.
Table 4a
Comparison of CTSO and CTE participation on Student Outcomes Academic Motivation Academic Engagement Civic Engagement GPA Career Self Efficacy College Aspirations Employability Skills β SE β SE β SE β SE β SE β SE β SE Model 1 (controls) Intercept 1.72*** 0.261 1.02*** 0.03 1.26*** 0.247 1.95*** 0.384 1.482*** 0.259 3.14*** 0.583 0.323 0.328 Slope 0.45*** 0.72 0.54*** 0.081 0.58*** 0.067 0.62*** 0.048 0.551*** 0.071 0.39*** 0.096 0.548** 0.166 Model 2 (Group) Intercept 0.604 t 0.303 0.4945* 0.228 0.850* 0.337 0.140 0.444 1.165** 0.328 0.786 0.661 1.042** 0.333 Slope
(1=CTSO 0=CTE)-0.161 t 0.086 -0.202* 0/094 -0.226* 0.085 -0.046 0.060 -0.299** 0.086 -0.170 0.120 -0.254 0.178 Control Variables Female 0.089* 0.035 0.069* 0.031 0.149* 0.058 0.348** 0.088 0.110** 0.043 0.053 0.090 0.086 0.062 White -0.003 0.042 -0.024 0.043 -0.043 0.084 -0.038 0.140 -0.033 0.066 -0.093 0.176 -0.153 0.095 Grade 0.001 0.017 0.018 0.015 0.001 0.033 0.117** 0.042 0.017 0.019 -0.051 0.072 -0.010 0.046 Extracurricular
Involvement-0.000 0.008 0.003 0.006 0.022** 0.007 0.032** 0.009 0.008* 0.004 0.052** 0.015 0.020** 0.007 Volunteering
Weekly Hours0.047** 0.014 0.044 0.018 0.112** 0.031 0.052 0.042 0.046* 0.020 0.084 0.061 0.119** 0.020 Job
Weekly Hours-0.019 0.011 0.006 0.012 -0.024 0.026 0.008 0.032 0.028 t 0.016 0.014 0.041 0.021 0.019 Model 1 1 variance 0.220 0.207 0.712 1.538 0.314 2.032 0.308
Results show that students in CTSO classes started out with higher motivation (indicated by a significantly positive intercept in Model 2) and gained slightly less (indicated by a negative slope) compared with students in CTE classes that did not include a CTSO component. Figures 3-7 show that the pattern was the same, though more significant, for academic engagement, civic engagement, career self-efficacy, and employability skills (except that the group difference in gain was not significant for employability skills 5 ). There were no differences between groups in either GPA or college aspirations at the start of the study, and no significant change over the year (see Figures 8 and 9 for a graphic representation of these results).
Table 4b replicates the previous set of analyses but uses CTSO vs. general classroom as the group membership variable. This comparison (again, in Model 2) shows that being in a CTSO is associated with higher career self-efficacy at the start of the year and significantly less gain over the course of the year compared with general students (i.e., though both groups increased, CTSO students increased less than general students). In addition, although they started out at the same level, CTSO students’ aspirations increased less than did general students’ over the course of the year. The pattern was the same, though less significant, for civic engagement. Other differences were not statistically significant. Refer again to Figures 3-9.
Table 4b
Comparison of CTSO and general education on Student Outcomes Academic Motivation Academic Engagement Civic Engagement GPA Career Self Efficacy College Aspirations Employability Skills β SE β SE β SE β SE β SE β SE β SE Model 1 (controls) Intercept 2.30*** 0.171 1.24*** 0.126 1.54*** 0.191 2.31*** 0.423 1.687*** 0.192 3.86*** 0.312 1.16*** 0.108 Slope 0.29*** 0.045 0.40*** 0.054 0.49*** 0.053 0.59*** 0.60 0.509*** 0.049 0.46*** 0.050 0.40*** 0.051 Model 2 (Group) Intercept 0.011 0.250 0.187 0.181 0.465 0.309 0.079 0.634 0.934** 0.292 0.200 0.501 0.104 0.213 Slope
(1=CTSO 0=GEN)0.013 0.068 -0.073 0.074 -0.141 t 0.075 -0.008 0.091 -0.245** 0.074 -0.25** 0.088 -0.095 0.086 Control Variables Female 0.042 t 0.025 0.023 0.027 0.047 0.041 0.169** 0.064 -0.023 0.031 0.136 t 0.078 0.016 0.035 White -0.003 0.037 -0.002 0.033 -0.026 0.069 -0.064 0.097 -0.030 0.044 -0.42** 0.131 -0.067 0.041 Grade -0.003 0.018 0.011 0.015 0.004 0.030 0.046 0.045 0.012 0.017 -0.023 0.064 -0.015 0.020 Extracurricular
Involvement-0.002 0.003 0.009 t 0.006 0.023** 0.006 0.022** 0.008 0.009** 0.003 0.052** 0.012 0.022** 0.004 Volunteering
Weekly Hours0.037** 0.013 0.086** 0.015 0.152** 0.024 0.027 0.032 0.065** 0.015 0.120** 0.043 0.097** 0.014 Job
Weekly Hours-0.005 0.010 0.023* 0.010 -0.005 0.021 0.025 0.025 0.029* 0.013 0.010 0.036 0.047** 0.015 Model 1 1 variance 0.183 0.200 0.646 1.173 0.270 1.882 0.250 Model 2 variance 0.183 0.200 0.646 1.172 0.270 1.892 0.249 Thus, the answer to the first research question is that membership in a CTSO is associated with higher levels of many of the outcome variables of interest at the start of the year (Fall survey), which may account for why this group gains less than students in the other groups over the course of the academic year. It should be kept in mind that because possible confounding variables (e.g., participation in extracurricular activities) were controlled, the effects we found can be uniquely attributed to participation in a CTSO.
Fig. 3. Academic Motivation
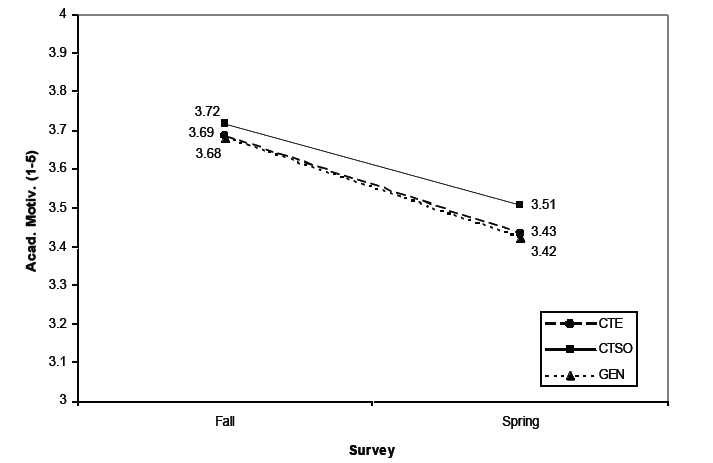
Fig. 4. Academic Engagement
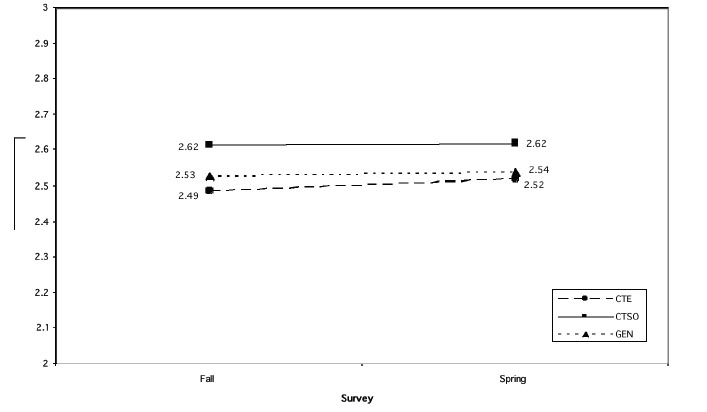
Fig. 5. Civic Engagement
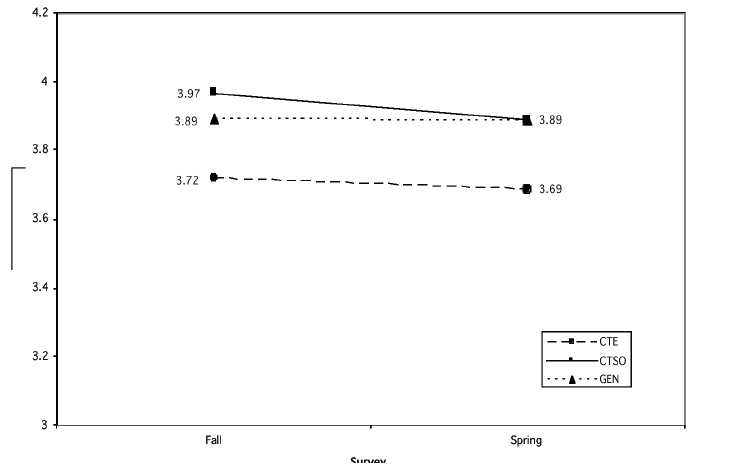
Fig. 6. Grades
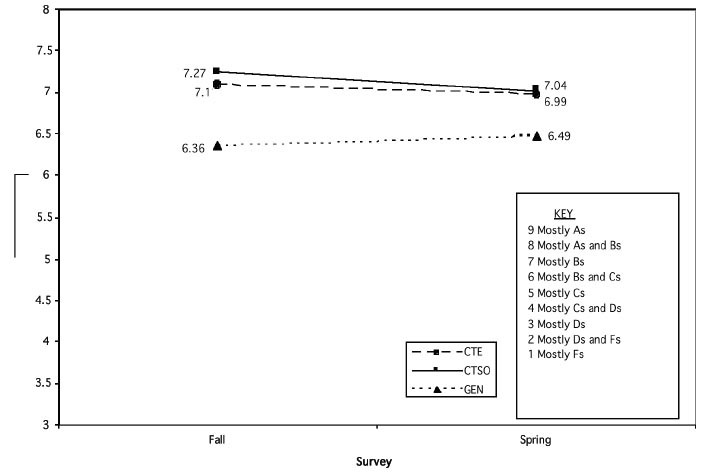
Fig. 7. Career Self-Efficacy
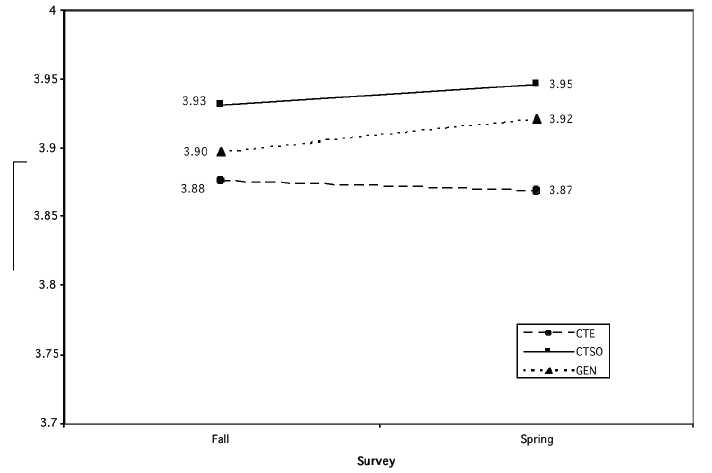
Fig. 8. College Aspirations
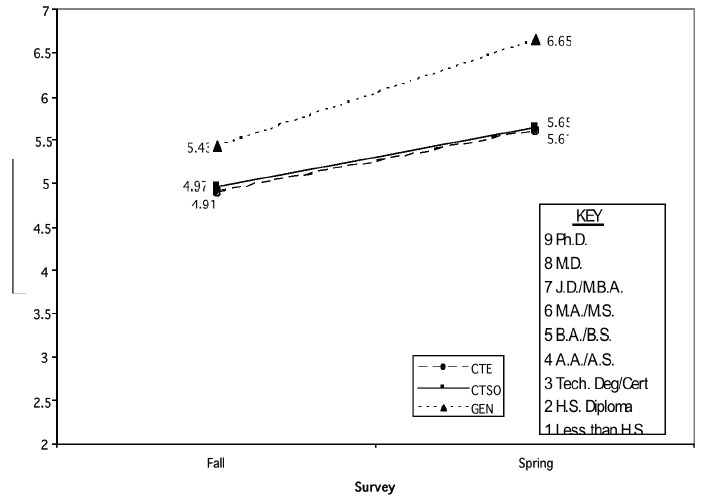
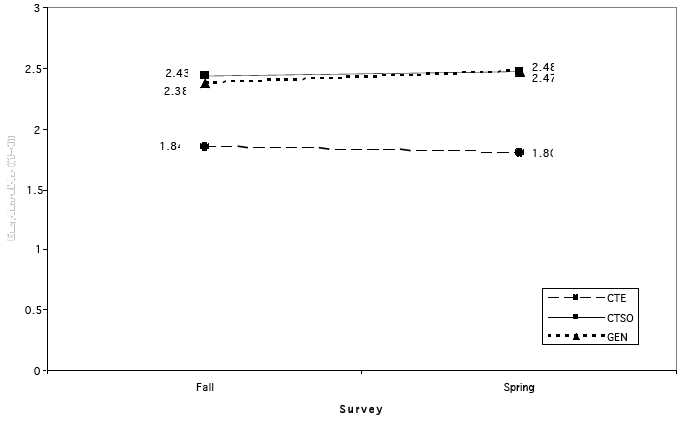
Fig. 9. Employability Skills
Research Question #2 The second analysis examines changes in the outcome variables due to amount of participation in CTSO activities. This means that only the CTSO student data were used, since students in the other two groups did not answer questions regarding participation in CTSO activities. In Table 5, the same controls as in the previous analyses were used for the first model, while a continuous variable indicating the amount of participation was entered in the second model as the variable of interest. Table 5 shows that the more a student is involved in a CTSO, the higher their academic motivation, academic engagement, grades, career self-efficacy, college aspirations, and employability skills (greater participation does not affect civic engagement). Thus, the answer to the second research question is that the amount of CTSO participation does make a difference (i.e., the more the better).
Table 5
Change in Outcomes Associated with CTSO Students Amount of Participation in CTSO Activities Academic Motivation Academic Engagement Civic Engagement GPA Career Self Efficacy College Aspirations Employability Skills β SE β SE β SE β SE β SE β SE β SE Intercept 2.42*** 0.201 1.51*** 0.136 2.27*** 0.294 2.39*** 0.525 2.711*** 0.208 3.99*** 0.544 1.19*** 0.096 Slope 0.29*** 0.049 0.03*** 0.006 0.36*** 0.058 0.55*** 0.065 0.250*** 0.054 0.199* 0.076 0.38*** 0.042 Amount of CTSO Participation 0.018* 0.007 0.32*** 0.061 0.017 0.012 0.035* 0.018 0.021** 0.007 0.054* 0.024 0.025** 0.0008 Control Variables Female 0.068 0.043 0.038 0.038 0.060 0.059 0.360** 0.109 0.054 0.057 0.031 0.119 -0.001 0.036 White <-0.001 0.067 -0.023 0.049 -0.121 0.106 0.076 0.176 -0.064 0.092 -0.236 0.238 -0.076 t 0.040 Grade <-0.001 0.026 0.024 0.019 0.019 0.047 0.059 0.065 0.036 0.026 <-0.001 0.101 -0.016 0.024 Extracurrucular
Involvement-0.007 0.005 -0.002 0.007 0.016 0.008 0.026** 0.012 0.001 0.004 0.050** 0.018 0.018** 0.004 Volunteering
Weekly Hours0.033 0.021 0.054** 0.020 0.108** 0.037 <-0.001 0.055 0.032 0.027 0.125 0.078 0.090** 0.013 Job
Weekly Hours-0.034* 0.016 0.002 0.011 -0.062 0.035 -0.015 0.043 0.019 0.023 -0.039 0.044 0.041** 0.015 Total Variance 0.217 0.208 0.704 1.403 0.326 2.075 0247
Research Question #3 The third research question examined change in the outcome variables due to participation in the four different types of CTSO activities. Again, only the CTSO student data were used, since students in the other two groups did not respond to CTSO-related questions. As in previous analyses, demographic and time use variables were controlled in the first model; and in the second model the type of CTSO activity (leadership positions, professional development, competitive events, and community service) was entered. Table 6 shows that, surprisingly, having a leadership position(s) in the CTSO did not significantly affect any of the outcome variables. However, participating in competitive events had significantly positive affects on academic engagement and career self-efficacy. There was also a slight positive effect of competitive events on grades, college aspirations, and employability skills. Participation in community service activities also increased students’ career self-efficacy, while professional development activities increased students’ employability skills. Oddly, professional development activities tended to decrease students’ career self-efficacy. None of the four types of CTSO activities (organizational elements) had an effect on academic motivation or civic engagement. Thus, the answer to the third research question is that participation in three of the four types of CTSO activities has a positive impact on students, but these vary by activity (see Figure 10).
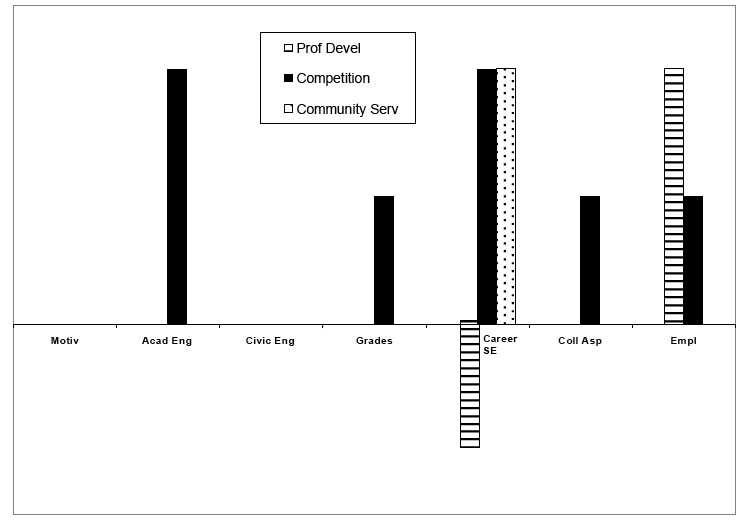
Fig. 10. Pattern of Effects of CTSO Organizational Elements on Outcome Variables
Table 6
Predicting Change in Outcomes from Types of CTSO Activities Academic Motivation Academic Engagement Civic Engagement GPA Career Self Efficacy College Aspirations Employability Skills β SE β SE β SE β SE β SE β SE β SE Intercept 2.42*** 0.209 1.58*** 0.138 2.25**** 0.278 2.31*** 0.519 2.72*** 0.205 3.92*** 0.552 1.69*** 0.212 Slope 0.28*** 0.054 0.32*** 0.062 0.37*** 0.058 0.56*** .064 0.247*** 0.054 0.201* 0.076 0.247*** 0.084 Leadership Position (A) 0.034 0.022 0.042 0.022 0.003 0..042 0.044 0.062 0.015 0.0.22 0.002 0.068 0.039 0.0.38 Professional Develop (B) -0.025 0.031 -0.034 0.032 0.043 0.051 -0.047 0.077 -0.048 t 0.026 0.039 0.074 0.119** 0.052 Competitive Events (C) 0.060 0.037 0.11** 0.044 0.053 0.052 0.145 t 0.080 0.074* 0.032 0.160 t 0.094 0.056 <t 0.052 Community Service (D) 0.031 0.080 0.080 0.052 -0.077 0.111 0.025 0.168 0.209** 0.049 0.060 0.235 -0.040 0.088 Control Variables Female 0.070 0.041 0.030 0.043 0.065 0.072 0.367** 0.109 0.058 0.058 0.047 0.119 0.018 0.092 White 0.005 0.054 0.001 0.046 -0.116 0.112 0.105 0.176 -0.045 0.094 -0.213 0.244 -0.100 0.152 Grade -0.003 0.023 0.017 0.022 0.019 0.040 0.060 0.065 0.028 0.025 -0.007 0.103 -0.153 0.080 Extracurricular Involvement -0.006 0.010 <-0.001 0.007 0.016* 0.008 0.029** 0.012 0.003 0.004 0.055** 0.018 0.020 0.012 Volunteering Weekly Hours 0.035* 0.016 0.061** 0.019 0.111** 0.036 0.006 0.055 0.035 0.026 0.136 0.079 0.089* 0.037 Job Weekly Hours -0.033* 0.015 0.002 0.013 -0.056* 0.028 -0.009 0.043 0.018 0.022 -0.025 0.043 0.037 0.031 Total Variance 0.217 0.216 0.706 1.415 0.324 2.100 0.234 Findings
In this longitudinal study of the value added by career and technical student organizations (CTSOs) to the high school experience, we compared CTSO classrooms to (a) CTE-only classrooms and (b) general education classrooms. In order to isolate the CTSO experience, we controlled for students’ participation in other activities (extracurricular activities, part-time work, and volunteering) that might affect our outcomes of interest. This means that we can be fairly certain that our findings are due to CTSO participation alone rather than any of the students’ other involvements.
Our first research question simply asked whether being in a CTSO vs. CTE- only or vs. a general classroom had any effect on the outcome variables elsewhere associated with CTSOs in the literature. We found that being in CTSO (vs. CTE- only) class was associated with higher beginning (Fall) levels of academic engagement, civic engagement, career self-efficacy, and employability skills (it also tended to be associated with higher levels of motivation). However, while both groups gained in these measures over the academic year, those in CTSO classrooms gained less (but still ended at the same level or higher) than those in CTE classrooms.
Compared to being in a general classroom (non-CTE courses such as English, social studies), being in a CTSO was only associated with higher levels of career self-efficacy in the Fall, and while both CTSO and general students gained over the school year, CTSO students gained significantly less on this measure over the year. In addition, while their levels were not significantly different from those of general students in the Fall, CTSO students also gained less than general students in college aspirations (and tended to gain less in civic engagement) between Fall and Spring.
The second research question went beyond this simple comparison of classroom type and asked whether the amount of participation in a CTSO mattered. The answer was an unequivocal yes. Specifically, we found that the more the students participated in CTSO activities, the higher their academic motivation, academic engagement, grades, career self-efficacy, college aspirations, and employability skills. The only measure that was unaffected by degree of participation in a CTSO was civic engagement.
The third research question asked whether the specific type of CTSO activity mattered, that is, what is it about participation in a CTSO that affects what kind of outcome? We found that the only element of CTSO participation that did not have a specific benefit was leadership, perhaps because students in leadership positions come in with high scores on these measures to begin with; therefore there is little more to gain.
Overall, we found some support for our theoretical model, while some specific hypothesized links were not borne out. Further research may be able to ascertain whether these positive effects endure after high school and into postsecondary and employment contexts.
Limitations
There are several limitations to this study. First, the sample of teachers was not a random sample and therefore we cannot make the claim that the sample is representative of the population. Nor were teachers blind to the purpose of the study. We recruited volunteer teachers to have their classes take our survey, and such individuals may differ from the rest of the CTE, CTSO, and general populations. Another limitation is that the number of teachers recruited from each of the eight CTSOs varied, so that those whose teachers had higher rates of participation are better represented in these results. Because the teacher sample was not necessarily representative, it follows that their students are also not likely to be representative. However, because few students refused to participate, we were able to survey a good cross-section of students in these classes.
National data show that there are about equal numbers of males and females in CTE ( Deluca, Plank, & Estacion, 2005 ) but that minority students participate at higher rates ( Deluca et al., 2005 ; Stone & Aliaga, in press ). Our sample was mostly white.
There was some attrition between Fall and Spring survey administrations which reduced our overall N for these analyses, but a missing data analysis showed that there was no significant pattern to which students did not take the second survey. Still, as will be seen in the results, we had a relatively small sample size for the number of variables we examined.
We called everyone in a CTE class “a CTE student,” although their experience with CTE could range from one semester to several years. Furthermore, because participation in CTE is voluntary, since it is considered an elective, and participation in the associated CTSO, if one is offered at the school, is also voluntary, students who enroll are likely to differ from students who do not enroll in CTE and/or a CTSO.
Finally, for most students, participation in a CTSO is, at minimum, a two- year process; for some it may be a four-year process. Therefore, in the space of one academic year it is likely that we were not able to capture the full effects of participation in a CTSO.
Discussion and Implications
As a whole, our findings suggest that CTSOs do have beneficial effects on the experience of high school students, though in general not more than other types of classes. The CTSO students in this study started out and ended up with higher levels of academic engagement, civic engagement, career self-efficacy, and employability skills than CTE-only students (they also reported higher levels of participation in extracurriculars, work, and volunteering). CTSO students did not gain as much over the academic year as students in the comparison groups; the gap between the groups simply narrowed. It appears that students who are drawn to participate in CTSOs are “good students” to begin with. Indeed, this self-selection bias has been noted in other studies of activity participation (e.g., Hansen, Larson, & Dworkin, 2003 ; McIntosh, Metz, & Youniss, 2005 ). However, we did find evidence that the benefits of CTSOs can be enhanced the more a student participates, and the effects for academic engagement are particularly strong. This may mean that positive outcomes for individual students could be enhanced by participating in CTSOs at high levels, particularly in competitive events, which we found to have effects on the most outcomes.
Our results suggest that it would be beneficial if an even larger group of students (not just the “good students”) were to participate in CTSOs. The National Research Council (2004) found that many students who are at risk from disengaging from school lack peer groups with high expectations for success and strong ties to education. Furthermore, there is some evidence from other research that school- based activities “benefit socioeconomically disadvantaged students as much or more than advantaged students” ( Marsh & Kleitman, 2002 , p. 464), and that, conversely, students who disengage from structured activities exhibit higher rates of delinquency ( Persson, Kerr, & Stattin, 2007 ). CTSOs might be one way to re-engage “at-risk” students, if they can attract and retain them.
As mentioned in the introduction, CTSOs were hypothesized to have beneficial effects on key outcomes for participating students for a variety of reasons, including their provision of authentic instruction, supportive adults, a task-focused peer group, clear goals and rewards, and opportunities for achievement, leadership, and skill development in a career-related field. The effects of participation were smaller than we expected, and not always in the hypothesized direction. One academic year is likely not a long enough time frame in which to detect measurable results. Furthermore, because many of the CTSO participants were already high on characteristics such as academic engagement at the start, their gains look very small. However, at least in the case of the negative slope for motivation, the result should not be surprising; Jacquelynne Eccles, Allan Wigfield, and their colleagues have found steady decreases in academic motivation across all demographic groups through the high school years ( Wigfield & Eccles, 2002 ; Wigfield & Wagner, 2005 ). These researchers attribute the decline to a variety of social and cognitive factors that come into play in adolescence, including more a more accurate sense of one’s competence and a heightened awareness of competition ( Wigfield, Eccles, & Rodriguez, 1998 ). It is reassuring that in our study, the CTSO students declined in academic motivation at a slower rate than did other students. 6 Other longitudinal research with adolescents has found a decline in participation in structured activities over time ( Persson, Kerr, & Stattin, 2007 ). Not only are the CTSO students in our sample involved in a CTSO, they also have higher rates of participation in extracurricular activities than do general students, suggesting that they are engaged in positive activities that may buffer them from the negative influences of unstructured time outside of school ( Persson, Kerr, & Stattin, 2007 ).
While there was not much gain in levels of civic engagement over the academic year for any group, CTSO students had higher levels than CTE students, suggesting that adding a CTSO component to CTE programs would help more high school students participate in their communities as citizens. We also found that CTSO students reported similar levels to general students, and higher levels than CTE students, of employability skills. This suggests that the attraction of a “real world” instructional environment in CTE classroom can be enhanced by incorporating a student organization component that helps students understand and experience what is necessary in the workplace. 7
The results indicating that CTE and CTSO students have lower college aspirations than the general group of students should not be worrisome for several reasons. First, on average, they still aspire to somewhere between a B.A. and an M.A. degree. Second, if more career technical students are drawn to a 2-year or technical college than to a 4-year college, pulling the average number of years in formal education down lower than that of general students, this may actually reflect a realistic and adaptive choice if they are interested in a technical career ( Berg, 2004 ; Csikszentmihalyi & Schneider, 2000 ; Gray, 2000 ). Researchers have suggested that many of the students from the general population who aspire to more higher education either will not finish (Education Weekly, March 2005) or will find themselves downwardly-mobile after they graduate ( Berg, 2004 ; Csikszentmihalyi & Schneider, 2000 ). Gaining a technical education at a less-than-four year college may in fact be a better bet in terms of future employability ( Gray, 2000 ; Wood, 2006 ). Third, we found that participating specifically in leadership and professional development activities in a CTSO serves to raise students’ educational aspirations. Incidentally, our finding of lower aspirations among CTE students also supports the findings recently reported in the NAVE ( National Assessment of Vocational Education, Levesque, 2003 ) and elsewhere (e.g., Deluca et al., 2005 ).
Conclusion
While CTSOs have received much attention in the CTE field, most of the research on their contributions and benefits to high school CTE students is anecdotal. This study aimed to test many of the anecdotal claims empirically. A foundation of 30 years of descriptive literature on CTSOs, as well as research on the development and education of high school students, formed the basis for the theoretical model. The study used a rigorous research design and reliable measures to test the model in a variety of states and programs. It is one of the first studies to systematically examine the context of CTSOs and their relation to student outcomes.
Future research on the effect of CTSOs should examine student transcripts for achievement, attendance, and on-time graduation data. It is especially important to look at coursetaking. The program of courses that students take is highly predictive of college enrollment ( Adelman, 1999 ). Follow-up studies with students who participated in CTE and CTSO in high school should be conducted to examine their post-high school trajectories into work and/or college.
Thousands of students participate in CTSOs, and we are glad to have opened the “black box” of processes that occur within them. In sum, we found that CTSOs are beneficial to students, but that they have great untapped potential that can be realized if they become more prevalent in CTE programs and more inclusive of all kinds of students.
References
Alfeld, C., Stone, J. R., Aragon, S. R., Hansen, D. M., Zirkle, C., Connors, J., Spindler, M., Romine, R. S., & Woo, H.-J. (forthcoming). The Value Added by Career and Technical Student Organizations to Students’ High School Experience. St. Paul, MN: National Research Center for Career and Technical Education. www.nccte.org
Assocation for Career and Technical Education (2006). What’s Career and Technical Education? Retrieved November 13, 2006, from http://www.acteonline.org/career_tech/ index.cfm
Adelman, C. (1999). Answers in the toolbox: Academic intensity, attendance patterns, and bachelor’s degree attainment. U.S. Department of Education.
Arroyo, A. A., Rhoad, R., & Drew, P. (1999). Meeting diverse student needs in urban schools: Research-based recommendations for school personnel. Preventing School Failure, 43 (4), 145-153.
Bailey, T., & Merritt, D. (1995). Making sense of industry-based skill standards. Berkeley, CA: National Center for Research in Vocational Education. (MDS-777).
Berg, I. (1973). Education and jobs: The great training robbery. New York, NY: Penguin Books.
Berns, R. G., & Erickson, P. M. (2001). Contextual teaching and learning: Preparing students for the new economy. The Highlight Zone: Research @ work.
Betz, N.E., & Hackett, G. (2006). Career Self-Efficacy Theory: Back to the Future. Journal of Career Assessment, 14 (1), 3-11.
Betz, N. E., Klein, K.L. & Taylor, K.M. (1996). Evaluation of the Short Form of the Career Decision-Making Self-Efficacy Scale. Journal of Career Assessment, 4 (1), 47-57 1996.
Billig, S. H. (2002). Support for K-12 service-learning practice: A brief review of the research. Educational Horizons, 80 ,184-190.
Blakely, M., Holschuh, M., Seefeldt, B, Shinn, G., Smith, E., & Vaughn, P. (1993). Perceived value of FFA contests and awards by students and other adult groups. Proceedings of the Twentieth Annual National Agricultural Education Research Meeting, 20 , 355-360.
Brannon, T., Holley, C.W., & Key, J.P. (1989). Impact of vocational agriculture/FFA on community leadership. Journal of Agricultural Education, 30 (3), 37-45.
Bransford, J., Brown, A., & Cocking, R. R. (2000). How People Learn: Brain, Mind, Experience, and School: Expanded Edition. Washington, DC: National Academies Press.
Brown, B.L. (2002). CTE Student Organizations. ERIC Digest No. 235.
Bryk, A.S., & Raudenbush, S.W. (1992). Hierarchical Linear Models in Social and Behavioral Research: Applications and Data Analysis Methods (First Edition) . Newbury Park,CA: Sage Publications.
Camino, L., & Zeldin, S. (2002). From periphery to center: Pathways for youth civic engagement in the day-to-day life of communities. Applied Developmental Science, 6 (4), 231-220.
Camp, W.G., Jackson, R.S., Buser, B.R., & Baldwin, E.T. (2000). Vocational student organizations and student achievement (MDS-1317). Berkeley, CA: National Center for Research in Vocational Education.
Camp, W., Navaratnum, K. K., & Jeffreys, B. J. (1987). Student participation in vocational student organizations and grades for the sophomore class of 1980 in America. American Vocational Education Research Association Annual Meeting, Las Vegas, NV.
Camp, W. (1990). Participation in student activities and achievement: A covariance structural
Connors, J. & Swan, B. (2001). Youth Participation in Leadership Activities Questionnaire. Unpublished document, Ohio State University.
Connors, J. (2004). National FFA Parliamentary Procedure Career Development Event Questionnaire. Unpublished document, Ohio State University.
Csikszentmihalyi, M., & Schneider, B. (2000). Becoming Adult: How Teenagers Prepare for the World of Work. New York, NY: Basic Books.
Deluca, S.A., Plank, S., & Estacion, A. (2006). Does Career and Technical Education Affect College Enrollment? St. Paul: University of Minnesota: National Research Center for
Dormody, T., & Seevers, B. (1994). FFA participation and youth leadership life skills development: A tri-state study. Paper presented at the American Vocational Association Convention Dallas, TX. ERIC Document Reproduction Service No. ED378390).
Eccles, J.S. (1993). School and Family effects on the ontogeny of children’s interests, self-perceptions, and activity choices. In R. Dienstbier & J.E. Jacobs (Eds). Developmental Perspectives on Motivation. Vol. 40, pp 145- 208. Lincoln: University of Nebraska Press.
Eccles, J., Adler, T. F., Futterman, R., Goff, S. B., Kaczala, C. M., Meece, J. L., and Midgley, C. (1983). Expectancies, values and academic behaviors. In J. T. Spence (Ed.), Achievement and Achievement Motive. San Francisco: W. H. Freeman.
Erikson, R., & Goldthorpe, J. H. (1993). The constant flux: The study of class mobility in industrial societies. Oxford, UK: Clarendon Press.
Fredricks, J. A., Blumenfeld, P. C., & Paris, A. H. (2004). School engagement: Potential of the concept, state of the evidence. Review of Educational Research, 74 (1), 59-109.
Furco, A., Muller, P., & Ammon, M.S. (1998). The Civic Responsibility Survey. University of California, Berkeley: Service-Learning Research and Development Center.
Gall, J. P., Gall, M.D., & Borg, W.R. (1999). Applying educational research: A practical guide (4th Ed.). New York, NY: Longman.
Gordon, R., Yocke, R.J., & Bess, A. (1995). Relationship between student participation in VICA and their mastery of personal development skills. ERIC Document Reproduction Service No. ED386602)
Graham, S., & Weiner, B. (1996). Theories and principles of motivation. In D.C. Berliner and R. C. Calfee (Eds.), Handbook of Educational Psychology. New York, NY: MacMillan Library Reference.
Gray, K.C. (2000). Other Ways to Win: Creating Alternatives for High School Graduates (2nd Ed.) Newbury Park,CA: Sage Publications.
Guest, A., & Schneider, B. (2003). Adolescents’ extracurricular participation in context: The mediating effects of schools, community, and identity. Sociology of Education, 76 (2), 89-109.
Hansen, D. M., & Larson, R (2002). The Youth Experience Survey (YES) 1.0: Instrument Development and Testing. Unpublished Manuscript, University of Illinois at Urbana-Champaign.
Hansen, D., Larson, R, & Dworkin, J. (2003).What adolescents learn in organized youth activities: A survey of self-reported developmental experiences. Journal of Research on Adolescence, 13 (1), 25-56.
High School Survey of Student Engagement (2005). What we can learn from high school students. Bloomington, IN: Indiana University. http://www.iub.edu/~nsse/hssse/
Note : The url provided above returned invalid results.
Visit the homepage at:
http://www.indiana.edu/Hoover, E. (2003). Fighting "senioritis." Chronicle of Higher Education, 49 (42), A30-A31.
Hunt, D. H. (2005). The effect of extracurricular activities in the educational process: Influence on academic outcomes? Sociological Spectrum, 25 (4), 417-445.
Lankard, B. A. (1996). Myths and realities: Youth organizations. Columbus, OH: Center on Education and Training for Employment at The Ohio State University.
Levesque, K. (2003). Public high school graduates who participated in vocational- technical education: 1982-1998 (NCES 2003-024). Washington, DC: U.S. Department of Education, Institute of Education Sciences, National Center for Education Statistics.
Mahoney, J.L. & Cairns, R.B. (1997). Do extracurricular activities protect against early school dropout? Developmental Psychology, 32, 241-253.
Mahoney, J.L. Cairns, B.D. & Farmer, T. W. (2003). Promoting interpersonal competence and educational success through extracurricular activity participation. Journal of Educational Psychology, 95 (2), 409-418.
Marsh, H. W. (1999). Academic Self-Description Questionnaire II. University of Western Sydney: Self-Concept Enhancement and Learning Facilitation (SELF) Research Centre.
Marsh, H. W., & Kleitman, S. (2002). Extracurricular activities: The good, the bad, and the non-linear. Harvard Educational Review, 72 (4), 464-511.
McIntosh, H., Metz, E., & Youniss, J. (2005). Community service and identity formation in adolescents. In J. L. Mahoney, R. W. Larson, & J. S. Eccles (Eds). Organized Activities as Contexts for Development: Extracurricular Activities, After-school, and Community Programs. Mahwah, NJ: Lawrence Erlbaum Associates.
Motivated Strategies for Learning Questionnaire (MSLQ). See Pintrich et al. (1991).
Mortimer, J. T. (2003). Working and growing up in America. Cambridge, MA: Harvard University Press.
National Educational Longitudinal Study of 1988 (1988). U.S. Department of Education, National Center for Education Statistics (NCES). Retrieved March 27, 2004 from http://nces.ed.gov/surveys/nels88/questionnaires.asp
National Research Council (2002). Community Programs to Promote Youth Development. Committee on Community-Level Programs for Youth. J. Eccles and J. A.Gootman, (Eds). Board on Children, Youth, and Families, Division of Behavioral and Social Sciences and Education. Washington, DC: National Academy Press.
National Research Council and the Institute of Medicine (2004). Engaging schools: Fostering high school students’ motivation to learn. Washington, DC: The National Academies Press.
National Survey of Student Engagement (2004). Student engagement: Pathways to collegiate success. Retrieved March 26, 2004 from http://www.iub.edu/~nsse/
Note : The url provided above returned invalid results.
Visit the homepage at:
http://www.indiana.edu/National Survey of Student Engagement (NSSE) (2005). Exploring different dimensions of student engagement. Bloomington, IN: Indiana University Center for Postsecondary Research.
National Survey of Student Engagement (NSSE) (2006). Engaged learning: Fostering success for all students. Bloomington, IN: Indiana University Center for Postsecondary Research.
Newman, F. M., & Wehlage, G. G. (1995). Successful School Restructuring. University of Wisconsin, Madison: Center on Organization and Restructuring of Schools.
Persson, A., Kerr, M., & Stattin, H. (2007). Staying in or moving away from structured activities: Explanations involving parents and peers. Developmental Psychology, 43 (1), 197-207.
Plank, S. (2001). Career and technical education in the balance: An analysis of high school persistence, academic achievement, and postsecondary destinations. St. Paul, MN: National Research Center for Career and Technical Education.
Plank, S., Deluca, S., & Estacion, A. (2005). Dropping out of high school and the place of career and technical education: A survival analysis of surviving high school. St. Paul, MN: National Research Center for Career and Technical Education.
Pintrich, P.R. & Schunk, D. H. (1996). Motivation in Education. Englewood Cliffs, NJ: Merrill.
Pintrich P., Smith D., Garcia T., & McKeachie W. (1991). A Manual for the Use of the Motivated Strategies for Learning Questionnaire. Technical Report 91- B-004. The Regents of The University of Michigan. Used with permission.
Reese, S. (2003, February). Career and technical student organizations: Building our future. Techniques, a publication of the Association for Career and Technical Education. Retrieved July 10, 2006 from http://www.acteonline.org/members/techniques/ upload/reprintsctso.pdf .
Note : The url provided above returned invalid results.
Visit the homepage at:
http://www.acteonline.org/Secretary’s Commission on Achieving Necessary Skills (1991). What work requires of schools: A SCANS report for America 2000. Washington, DC: U.S. Department of Labor.
Schunk, D. (1989). Self-efficacy and achievement behaviors. Educational Psychology Review, 1, 173-208.
Schunk, D. (1991). Self-efficacy and academic motivation. Educational Psychologist, 26, 207-232.
Scott, J., & Sarkees-Wircenski, M. (2004). Overview of career and technical education. Homewood, IL:American Technical Publishers.
Smink, J. & Schargel, F. P. (2004). Helping students graduate: A strategic approach to dropout prevention. New York, NY: Eye on Education.
Somers, C. L., & Piliawsky, M. (2004). Drop-out prevention among urban, African American adolescents: Program evaluation and program implications. Preventing School Failure,
Stone, J. R., & Alfeld, C. (2004). Keeping kids in school. Techniques, 79 (4), 28-29.
Stone, J. R., Alfeld, C., Pearson, D., Lewis, M., & Jensen, S. (2006). Building Academic Skills in Context: Testing the Value of Enhanced Math Learning in Career and Technical Education. St. Paul, MN: National Research Center for Career and Technical Education, University of Minnesota.
Stone, J. R., III, & Aliaga, O. A. (in press). Participation in career and technical education and school-to-work in American high schools. In D. Neumark (Ed.), Improving school-to-work transitions. New York, NY: Russell Sage Foundation.
Stott, K. A., & Jackson, A. P. (2005). Using service learning to achieve middle school comprehensive guidance goals. Professional School Counseling, 9 (2), 156-159.
Swanson, C. B. (2004). Who Graduates? Who doesn’t? A statistical report of public high school graduation, Class of 2001. Washington, DC: The Urban Institute. http://www.urban.org/url.cfm?ID=410934
U.S. Department of Labor (1992). Learning a living: A blueprint for high performance, The Secretary’s Commission on Achieving Necessary Skills. Washington DC: U.S. Government Printing Office.
Wigfield, A., & Eccles, J. S. (2002). The development of competence beliefs, expectancies for success, and achievement values from childhood through adolescence. In A, Wigfield & J. S. Eccles (Eds.), Development of achievement motivation. Orlando, FL: Academic Press.
Wigfield, A., Eccles, J. S., & Rodriguez, D. (1998). The development of children’s motivation in school contexts. Review of Research in Education, 23, 73- 118.
Wigfield, A., & Wagner, A.L. (2005). Competence, Motivation, and Identity Development During Adolescence. In A. Elliot and C. Dweck (Eds.), Handbook of Competence and Motivation. New York, NY: Guilford Press.
Wills, J. L. (1995). Voluntary skill standards and certification: A primer. Washington, DC: Department of Education, Employment and Training Administration.
Wingenbach, G. J., & Kahler, A. A. (1997). Youth leadership development: How much do we know? Proceedings of the 24th Annual National Agricultural Education Research Meeting, 24, 449-455.
Wood, D. B. (2006, October 12). FutureWork: Vocational Training Back in Vogue. Christian Science Monitor.
Zirkle, C., & Connors, J. (2003). The contribution of career and technical student organizations (CTSO) to the development and assessment of workplace skills and knowledge: A literature review. Workforce Education Forum, 30 (2), 15-26.
The authors would like to thank the following individuals for their contributions to the project: Chris Zirkle, Jim Connors, Matt Spindler, Rebecca Swinburne Romine, and Hui-Jeong Woo.
The Authors
Corinne Alfeld is Deputy Director of the National Research Center for Career and Technical Education at the University of Minnesota .
David M. Hansen is Visiting Assistant Professor in the Department of Human and Community Development at the University of Illinois, Urbana-Champaign .
Steven R. Aragon is Associate Professor in the Department of Human Resource Education at the University of Illinois, Urbana-Champaign .
James R. Stone III is Director of the National Research Center for Career and Technical Education at the University of Minnesota .
1 On the other hand, Hunt (2005), in a longitudinal study, found that it is good grades that lead to greater extracurricular involvement rather than the other way around.
2 All students were asked not to take the survey again if they had taken it in another class, so that the samples remained independent.
3 Due to school regulations, we could not compensate all students with cash. Wal-mart was chosen because it was the most ubiquitous chain across all of our research sites that offered the most individual choice of compensation (as opposed to a food-only chain such as McDonald’s).
4 The maximum varied across each of the four organizational elements (leadership, competitions, etc); see Table 8.
5 Likely due to an unusually low N for CTE students on the employability skills scale (there was a page missing in some of the surveys sent to this group).
6 Or, the drop in grades over the year among CTSO students may just be a reflection of the fact that a greater proportion of them are seniors than the other groups and may be experiencing “senioritis” (Hoover, 2003).
7 Together, these two findings may reflect the fact that CTSO students report spending more hours per week volunteering and working, variables which were held constant in the statistical analysis. Had they not been controlled, we might have seen even stronger effects of CTSO participation on the civic engagement and employability outcomes.