JITE v34n2 - Using Functional Flow Diagrams to Enhance Technical Systems Understanding
Using Functional Flow Diagrams to Enhance Technical Systems Understanding
Richard E. Satchwell
Illinois State UniversityCurrent theories stemming from the work of cognitive scientists suggest that one key to expert performance lies in the organization of the expert's domain knowledge base. Research efforts directed at expert and novice differences in a variety of domains such as financial reasoning, physics and mechanics, medical diagnosis, and electronic troubleshooting have examined the characteristics of expertise. As a result, an increased understanding of the nature of experts and novices has developed. One of the fundamental distinguishing characteristics between the "expert" and the "novice" is the size of their domain knowledge base and the way that this knowledge is organized. These knowledge base differences seem to be a major contributing factor to the superior performance displayed by experts in diverse technical fields. The larger and better organized domain knowledge base of experts results in their ability to possess a greater understanding of how technical systems operate, leading to a greater level of troubleshooting performance.
While research literature suggests that technical instruction should emphasize conceptual learning and mental model development, it appears that many technical training programs fail to adhere to these suggestions. Instead, they choose to emphasize other forms of instruction such as quantitative problem-solving and theoretical learning. For example, one common approach in electronics instruction is to begin with electrical theory by introducing various equations for calculating circuit conditions (e.g., Ohm's law and Kirchhoff's laws), followed by application exercises to equate solutions during assorted circuit design problems. However, research shows that experts do not rely solely on these quantitative aspects of electronic systems; rather, they initially draw on their conceptual understanding of the problem ( Chi, Feltovich, & Glaser, R., 1981 ; Flesher, 1993 ; Larkin, McDermott, Simon, & Simon, 1980 ). In the case of electronics instruction, White and Frederiksen (1987) suggest that instructors should help students acquire a circuit schema before introducing quantitative reasoning and calculations. By gaining an understanding of a system's behavior, the novice may be more successful in analyzing the quantitative aspects of systems.
While technical instruction should place greater emphasis on conceptual understanding, the instructional materials used must also be improved. Technical instructors often use complex and abstract diagrams (such as schematics) to describe the function and operation of technical systems. However, when students lack sufficient background in the domain, complex and abstract schematic diagrams often fail to assist them in gaining a conceptual understanding of the system or device.
Satchwell and Johnson (1992) found that the use of conceptual diagrams was effective for improving overall system understanding related to electrical systems. In addition, they found that the conceptual diagram was an effective instructional media for enhancing students' conceptual understanding of the casual behavior of the system, as well as improving their ability to reconstruct conceptual models that were very similar to those of an expert's mental model or knowledge structure. One of the primary conclusions of that investigation was that further research was needed to examine the effectiveness of the conceptual diagram as an instructional media for technical system instruction ( Johnson & Satchwell, 1993 ).
Although the Satchwell and Johnson (1992) study found the use of conceptual diagrams to be effective for (a) improving overall system understanding, (b) enhancing students' conceptual understanding of the casual behavior of the system, and (c) improving their ability to reconstruct conceptual models, they noted the limitation of the small sample size used for their study. In addition, they observed that the use of conceptual diagrams to enhance technical systems understanding was a relatively new area of study and much remained to be learned about this media. The purposes of this study were (a) to replicate the previous work of Satchwell and Johnson (1992) by revisiting the research questions asked during their initial study (see research questions one and two), and (b) to further explore the effect of one type of conceptual diagram (i.e., functional flow diagram) on technical system understanding by asking one additional research question (see research question three). This study was designed to address the following research questions:
- Do functional flow diagrams increase students' understanding of technical systems?
- Do functional flow diagrams enhance students' knowledge structures of technical systems?
- Do functional flow diagrams affect students' cognitive abilities related to technical system understanding?
Background
Mental Models
The mental model construct was initially introduced by Johnson-Laird (1980) ; however, he was not the first to suggest the notion that people make use of an internal model when interacting with the world around them. When discussing his hypotheses on the nature of thought, Craik (1943) suggested the notion of a mental model. He stated that
if the organism [the human] carries a "small-scale model" of external reality and of its own possible actions within its head, it is able to try out various alternatives, conclude which is the best of them, react to future situations before they arise, utilize the knowledge of past events to react in a much fuller, safer, and more competent manner to the emergencies [or technical situations] which face it. (p. 61)
Varying philosophies and perspectives exist regarding the notion of the mental model. Johnson-Laird (1983) stressed that mental models are specific in nature and provoke mental images. Jagacinski and Miller (1978) provide another view of the mental model construct as " a special case of a 'schema'" (p. 433). A more conceptual view considers the mental model construct as a knowledge structure that incorporates both declarative knowledge (e.g., knowing facts and theories) and procedural knowledge (e.g., knowing how to determine voltage distributions in a given circuit). Mental models also include a control structure that enables individuals to solve problems using their procedural and declarative knowledge, such as mentally simulating the behavior of a circuit ( White & Frederiksen, 1987 ).
Mental models are thought to serve many functions. They enable the expert to organize domain knowledge. This is useful for locating, interpreting, and storing new information ( Borgman, 1982 ; Gott, Bennett, & Gillet, 1986 ; Schlager, Means, & Roth, 1988 ). Mental models are useful for entertaining specific hypotheses to predict or explain one's interactions with the environment or technical equipment ( Johnson, 1987, 1988 ; Norman, 1983 ). In problem-solving, a mental model can be used by the expert to infer how the technical system will behave under various conditions ( Schlager et al., 1988 ; White & Frederiksen, 1987 ). Consistent with this functional view of mental models, Rouse and Morris (1985) define mental models as " the mechanisms whereby humans are able to generate descriptions of system purpose and form, explanations of system functioning and observed system states, and predictions of future system states" (p. 7).
The mental model construct has been addressed in the literature using several different labels. One of the most important of these models is the "device model" ( de Kleer & Brown, 1983 ; Kieras & Bovair, 1984 ). Device models can be viewed as a person's understanding of how a device works. Schlager et al. (1988) found that electronics experts use a variety of device models having different levels of detail, emphasizing the conceptual and functional relationships among the system components. On the other hand, novices have been found to have fewer, less-developed device mental models, based more on the physical attributes of the system rather than the conceptual relationships between components ( Means & Gott, 1988 ). While novices may know about individual components within a technical system, they often do not know which components are important to a problem, or how the parts relate to each other and the system as a whole ( Johnson, 1987 ; Schlager et al., 1988 ).
In addition to the device model, people may develop at least four other types of mental models when reasoning about an electrical system (e.g., structural, functional, behavioral, and causal mental models). A simple, qualitative physical model may be developed to explain an electrical circuit at a micro level; for example, a "structural model" might convey how electrical charges are redistributed through a resistor when the current across the resistor changes. Another model may be developed to convey the high-level functionality of the circuit; for example, a "functional model" might represent the system's purpose and how the subsystems interact to achieve the system's purpose. A third mental model, known as the "behavioral model," may be developed to explain the behavior of the system at the component level; for example, how changes in the state of one component can cause changes in the states of other components ( White & Frederiksen, 1987 ).
The behavioral model implies causality among the system's components in much the same way as another type of mental model called a "causal mental model." The causal mental model was initially introduced by de Kleer and Brown (1981) during their investigation on how people acquire an understanding of mechanical devices. de Kleer and Brown introduced a theory of reasoning based on the notion that changes in physical systems can be more intuitively understood if stated in qualitative terms. Unlike quantitative descriptions that are often used to describe systems, these qualitative models provide better insight into how systems function. Causal analysis can be used to qualitatively reason about three aspects of any technical system: (a) the function of the system (i.e., what the device is for), (b) the structure of the system (i.e., what the device is), and (c) the behavior of the system (i.e., what the device does). Causal reasoning analyzes how a change in one component propagates throughout a system.
Technical Diagrams for Instruction
Using graphic materials to support regular classroom instruction has become a common instructional technique at all levels of education. Recent concerns over the utility of these graphics as expressed in the technical training literature ( Brown & Burton, 1987 ; Johnson, 1991 ; Mayer & Gallini, 1990 ; Satchwell & Johnson, 1992 ; White & Frederiksen, 1987 ) have guided this study investigating the value of two different types of network diagrams ( schematic diagrams and functional flow diagrams ) for improving student understanding of technical systems.
Schematic Diagrams . Schematic diagrams use abstract symbols to represent the component parts of a technical system and connect those abstract symbols with lines to indicate their relationships. They are used extensively to (a) illustrate electronic circuitry and hydraulic or pneumatic flows, (b) diagram system structure in service manuals, and (c) provide visual information during technical instruction.
Alesandrini (1987) refers to the schematic diagram as an abstract graphic, but indicates that sometimes this type of diagram is referred to as arbitrary or logical. She indicates that this type of visual is abstract and conceptual rather than artistic representations of actual objects. According to Alesandrini (1987) , schematic diagrams are very useful in structuring and organizing verbal text and can be used to facilitate learning when no other type of image is possible. Describing schematic diagrams as "logical" suggests that this type of diagram may help to clarify a technical system by representing the system in an organized format.
The use of the schematic diagram for developing an understanding of technical systems is advocated by the U.S. Navy in an electricity and electronics training series produced by the Naval Education and Training Program Development Center (1985) . This publication, Introduction to Electrical Conductors, Wiring Techniques, and Schematic Reading , states that "the schematic diagram is the most useful of all the diagrams in learning overall system operation" (p. 39). In spite of its wide use as a visual aid for technical instruction, little research has been conducted to test its instructional effectiveness. In fact, Johnson (1991) hypothesized that schematic diagrams are often too complex and abstract to be effective for initial system instruction.
McAlister (1992) investigated the effects of using analogical illustrations versus schematic diagrams to teach technical information to middle school-age students. Analogical illustrations use pictures of familiar objects to represent unfamiliar concepts. For example, a picture of a garden hose was used to illustrate how electrical current flows in a wire. McAlister found that analogical illustrations were more effective when teaching students about simple electronic circuits when tested immediately following instruction. However, there were no significant differences in student performance during a retention test administered two weeks later. He also found that schematic diagrams were more effective when teaching object attributes (e.g., "Draw an AND gate and label its parts") when tested initially, and during a retention test two weeks after instruction.
Another example of research related to schematic diagrams is a study by Egan and Schwartz (1979) . During an investigation of knowledge structures and their influence on subjects' ability to recall symbolic drawings, expert and novice subjects were asked to review electronic drawings and then reconstruct the drawings from memory. The results showed that when presented with realistic drawings, the experts were able to recall significantly more of the drawings than the novices. However, when the subjects were presented with drawings that had a random placement of electronic components in a circuit, the experts performed no better than the novices. This study suggests that the memory of expert electronic technicians is organized around "conceptual chunks" of information. The experts were able to recall portions of the drawings as groups of information (e.g., amplifier circuit and tuner circuit) rather than as individual components. These findings lend support to Alesandrini's notion that schematic diagrams are logical and conceptually organized visuals.
Satchwell and Johnson (1992) performed a comparative study to investigate the effectiveness of traditional schematic diagrams with the addition of functional flow diagrams (i.e., diagrams illustrating the electrical system at a conceptual level) on technical system understanding. In this study, functional flow diagrams were designed to represent fundamental concepts and component parts in electrical systems and explicitly show meaningful relationships between concepts and components. The researchers found that the students who used the instructional manual containing the conceptual diagrams achieved significantly higher scores on the unit tests. The unit tests in this study were designed to test technical system understanding at structural, functional, and behavioral levels. Results indicate that although the use of conceptual diagrams had little effect on individuals' understanding of the system structure and component function, there was a significant difference in their level of behavioral understanding. During this investigation, knowledge structure maps were collected from some of the subjects in an attempt to find out how closely the knowledge structures of the subjects resembled those of an expert-like mental model. The researchers found that students who used functional flow diagrams created more expert-like mental models of technical systems than did students who used only traditional schematic diagrams. The authors suggest that using only traditional schematic diagrams to develop complete understanding of technical systems may not be as effective as complimenting traditional schematic diagrams with conceptual diagrams.
Functional Flow Diagrams . Studies have suggested that different features of diagrams might convey different types of information. Satchwell and Johnson (1992) used functional flow diagrams to represent the fundamental concepts or essential component parts of a system and to organize meaningful relationships between those concepts and component parts. The importance of learning concepts and principles has been stressed in the literature ( Ausubel, Novak, & Henesian, 1978 ; deKlerk, 1987; Novak & Gowin, 1984 ; Stice & Alvarez, 1986 ). According to Ausubel's learning theory ( Ausubel et al., 1978 ), concepts play an important role in the acquisition and use of knowledge. In order to learn meaningfully, students must relate ideas to one another and to their existing conceptual schema. Several investigations have attempted to "map" the concepts held by students ( Novak, Gowin, & Johansen, 1983 ; Pankratius & Keith, 1987 ; Satchwell & Johnson, 1992 ; Stice & Alvarez, 1986 ). These studies have shown that conceptual diagrams are effective for (a) helping students gain initial understanding, (b) resolving misconceptions, and (c) assessing students' conceptual knowledge.
In summary, everyone is thought to possess a schema network of connected facts, features, algorithms, skills, or strategies considered useful for understanding the world around them. We rely on this network of information to form specific mental representations referred to as mental models.
The causal mental model is one type of mental model that appears most beneficial for workers in technical fields ( Brewer & Nakamura, 1984 ; de Kleer & Brown, 1981, 1983 ; White & Frederiksen, 1987 ). This type of model differs from other forms of mental representations in that it indicates causality among the system's components and is thought to be playable in the mind through a form of mental simulation. Cognitive research suggests that in order for the progression from novice to expert to take place, novices must develop accurate causal mental models of the technical systems with which they interact. Therefore, the purposes of this experiment were to further explore the effect of functional flow diagrams on technical system understanding and to investigate one pedagogical approach thought to be appropriate for developing the novice's causal mental model.
Method
Subjects
The population for this quasi-experimental study was students enrolled in the Institute of Aviation at the University of Illinois at Urbana-Champaign. The Institute of Aviation, with an annual enrollment of approximately 200 students, is located at the University of Illinois' Willard Airport. It provides Federal Aviation Administration (FAA) certificates for professional pilots as well as aircraft maintenance technology.
The 34 subjects who participated in this study were enrolled in AVI 170, Aircraft Systems II , at the Institute of Aviation during the fall semester. These students were divided by the Institute of Aviation into two laboratory sections that met twice a week for two hours. The students from both sections attended a common two-hour lecture and discussion class once a week. Laboratory Section A was composed of 20 students (19 male students, and 1 female student), who were randomly selected to be the treatment group. Section B, which had 14 students, served as a control group.
All a priori plans to use the data collected from the intact groups, previously described, changed after an uncontrolled extraneous variable was detected. It became apparent, during the third week of this four-week experiment, that at least six subjects from the control group were receiving the treatment under investigation.
Cook and Campbell (1979) , have labeled this extraneous variable as the experimental treatment diffusion effect . According to Cook and Campbell , if the treatment condition is perceived as very desirable relative to the control condition, members of the control group may seek access to the treatment condition. Cook and Campbell suggest that experimental treatment diffusion is especially likely if the experimental and control subjects are in close proximity to one another. If experimental treatment diffusion occurs, the effect of a treatment on any posttests will be obscured. Several of the functional flow diagrams developed for this study had unique patterns of component placement. These unique patterns were not of particular importance to this study; however, they started to appear on several of the knowledge structure maps developed by members of the control group during the card-sorting tasks. Postexperimental interviews were conducted with several subjects from the control group suspected of a treatment diffusion effect. These interviews revealed that at least three members of the control group were roommates with members of the treatment group. In addition, one subject who did not live with a member of the treatment group admitted to looking at the treatment package while at a friend's house.
To minimize this experimental treatment diffusion effect, the data collected from the control subjects in this experiment were not included in the data analysis. Instead, the control group data from a previous study by Satchwell and Johnson (1992) were used in the data analysis. This control group data represent the ten subjects who were enrolled in AVI 170, Aircraft Systems II, at the Institute of Aviation at the University of Illinois at Urbana-Champaign during the Fall semester of 1991.
Studies have shown that prior experience ( Chi, Glaser, & Farr, 1988 ), as well as skill level ( Gitomer, 1988 ), influences the development of a person's knowledge structure. According to Glaser (1984) , prior knowledge is almost certain to affect learning. Therefore, it was important to establish that the two experimental groups were initially equal in both aptitude and domain knowledge. Two standardized examinations were used as aptitude measures: (a) the American College Testing Program (ACT) examination, and (b) the Survey of Mechanical Insight examination. These exams are general measures of academic and mechanical aptitude, respectively, and are used for entrance screening by the University of Illinois and the Institute of Aviation. The Survey of Mechanical Insight examination, developed by Miller (1955) , has a reliability, as determined by KR-20, of .87 and a split-half reliability, as corrected by the Spearman Brown formula, of .88. Grades earned in a prerequisite basic electronics course were used as a domain-specific indicator of domain knowledge.
Because of the documented effects of individual differences regarding prior knowledge ( Chi et al., 1988 ; Gitomer, 1988 ; Glaser, 1984) , it was important to establish that the two groups (i.e., the control group used for the previous study by Satchwell and Johnson [Control-91] and the experimental treatment group for this investigation [Treatment-92]), were initially equal in both aptitude and domain knowledge. ACT scores, University of Illinois GPA, Survey of Mechanical Insight Examination scores, and AVI 145 Final Grade were compared to see if the two groups (i.e., Treatment-92 and Control-91), were equal in aptitude and domain knowledge. As indicated in Table 1, there were no significant aptitude and domain knowledge differences between the treatment group in this current investigation and the control group participating in the previous study by Satchwell and Johnson (1992) .
As a result of the experimental treatment diffusion effect, the control group data from a previous study were used in the data analysis. Because of the documented effects of individual differences previously described, it was also necessary to determine that the two control groups (i.e., the control group used for the previous study by Satchwell and Johnson (Control-91) and the control group for this investigation (Control-92) were initially equal in both aptitude and domain knowledge. The same indices used to establish equality in the previous analysis were compared to see if the two groups (i.e., Control-91 and Control-92) were equal in aptitude and domain knowledge. As indicated in Table 2, there were no significant aptitude or domain knowledge differences between the two control groups.
Table 1 Treatment-92 vs. Control-91
Demographics n Treatment-
92 MeanSD n Control-
91 MeanSD U P
Mechanical
Insight a19 57.90 31.00 8 50.50 29.00 66.00 .594 ACT 18 24.78 3.15 10 24.70 3.30 78.00 .560 AVI 145 b 20 3.50 1.05 10 3.60 0.97 107.00 .745 University GPA c 20 3.95 0.49 10 3.91 0.23 94.00 .792
a Percentage of Correct Responses. b Maximum score = 5.0.
c Grade Point Average on a 5.0 Scale.After establishing that there were no significant aptitude and domain knowledge differences, the two experimental groups for this investigation were the Treatment-92 group (n = 20) and the Control-91 group (n = 10).
Table 2 Control-91 vs. Control-92
Demographics n Treatment-
92 MeanSD n Control-
91 MeanSD U P
Mechanical
Insight a8 50.50 29.00 11 46.50 25.00 46.50 .836 ACT 10 24.70 3.30 10 24.40 3.92 53.00 .819 AVI 145 b 10 3.60 0.97 14 3.57 1.16 71.00 .952 University GPA c 10 3.91 0.23 14 3.86 0.45 81.00 .520
a Percentage of Correct Responses. b Maximum score = 5.0.
c Grade Point Average on a 5.0 Scale.Materials and Instrumentation
Instructional Materials. The field training package, Introduction to King Air Electrical System s, was an integrated part of the Aircraft Systems II course curriculum. This individualized training manual uses schematic diagrams to teach about the electrical systems and subsystems of the King Air 90, 2300, and 300 series aircraft. This manual introduces the major electrical concepts of DC generation, dual-bus DC distribution, multiple-bus DC distribution, and AC generation/distribution ( Beech Aircraft Corporation, 1986 ). Voltage regulation is the first electrical system introduced in the training manual. Figure 1 illustrates the schematic diagram used to depict the voltage regulation system. A total of 39 diagrams of this type are used throughout the instructional manual to illustrate the systems and subsystems being covered.
Figure 1 An example of the type of schematic diagram used for the control group.
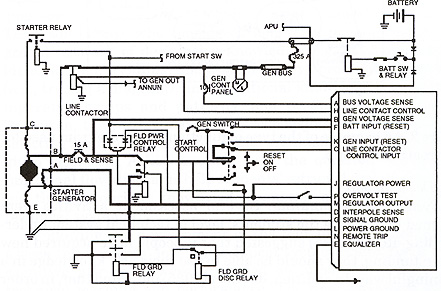
Note: From Introduction to King Air Electrical Systems (pp. 3-4) by Beech
Aircraft Corporation, 1986, Wichita, Kansas: Beech Aircraft Corporation
Technical Training Center. Copyright 1986 by Beech Aircraft. Reprinted
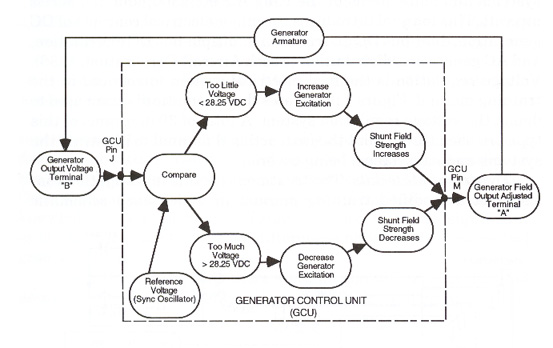
by permissionTreatment Materials. The treatment for this investigation consisted of a modified training manual in which each schematic diagram in the manual was preceded with a functional flow diagram depicting the system at a conceptual level and indicating the causal nature of the system. The functional flow diagrams were those used in the previous investigation by Satchwell and Johnson (1992) . Figure 2 illustrates the functional flow diagram used to depict a voltage regulation system. This diagram is typical of those used throughout the treatment version of the manual.
Figure 2 An example of the type of functional flow diagram used for the treatment group.
Test Development
Systems understanding . Several assessment activities were designed to evaluate the students' level of technical system understanding. Royer (1986) suggested that if people have acquired new understanding, they should be able to use their new knowledge in a meaningful way. In addition, de Kleer (1985) indicated that, in order for people to develop a causal mental model of a physical system, they must be able to reason qualitatively about the system's structure, function, and behavior. Combining Royer's notion of the demonstration of understanding with de Kleer's theory of qualitative reasoning resulted in the following working definition of technical system understanding: the ability to use system knowledge in a meaningful way and to reason qualitatively about (a) the structure of the system, (b) the function of the components within the system, and (c) the behavior of those components as they interact with other components in the system. Guided by this working definition of system understanding, four unit tests were developed to assess each subject's knowledge of the structural, functional, and behavioral aspects of the electrical systems introduced in the training manual (see Satchwell & Johnson, 1992 , for sample test items). Three domain experts were independently provided with the unit tests and asked to categorize each test item into structural, functional, or behavioral categories. An interrater agreement ratio of .91 was obtained, indicating that there was considerable agreement between the domain experts on the categorization of the items. These tests were administered during the laboratory class that followed the completion of each of the four units of instruction.
Cognitive Attributes. One research question was asked during this study that did not appear in the initial investigation by Satchwell and Johnson (1992) . Do functional flow diagrams affect a student's cognitive abilities related to technical system understanding? This question is related to the cognitive system model presented by Tennyson (1988) , who considered long-term memory as an integrated network of declarative knowledge (e.g., electronic symbol identification, recalling, and system theory), procedural knowledge (e.g., tracing a diagram), and conditional knowledge (e.g., identifying relationships and patterns, and predicting). According to Tennyson , the retrieval system is responsible for the processes of selecting appropriate knowledge and organizing knowledge for any given situation. Asked another way, the question becomes: Do functional flow diagrams help students' retrieval systems in selecting the appropriate knowledge to answer questions concerning technical systems?
Following the development of the four unit tests designed to assess the students' level of technical system understanding, six cognitive attributes were identified as important processes for technical learning and performance. The first, electronic symbol identification, was defined as the ability to recognize abstract symbols used to represent electronic components and understand their meaning. The second cognitive process, recalling, was described for this study as activating prior knowledge about something that has already been learned ( Marzano et al., 1988 ). The third cognitive attribute, system theory, was defined as the process of knowing and understanding the relationship between the input, processes, and output of a technical system. The fourth cognitive attribute identified for this study was the procedural knowledge of tracing a diagram. This cognitive process was described as knowing how to trace (i.e., mentally and/or physically) a network diagram. The last two cognitive attributes are related to the notion of conditional knowledge ( Tennyson, 1988 ) and are concerned with knowing why and when to select specific concepts, rules, and principles. The fifth cognitive process was the ability to identify relationships and patterns among the components and subsystems that exist in technical systems. The final cognitive process, predicting, was defined as the ability to anticipate the correct outcome in situations where multiple outcomes are possible.
Three domain experts were provided with a list of these six cognitive processes and were asked to reflect on each test question and come to a consensus regarding which cognitive attribute(s) was used to answer each question on the unit tests. Table 3 shows sample test items addressing each of the six cognitive attributes identified by this study.
The Card-Sorting Tasks
To provide an additional depth of analysis relative to the subjects' knowledge structures of technical systems, each participant was asked to perform several card-sorting tasks after completing each unit of instruction. During each card-sorting session, up to four conceptual maps were constructed by each subject to provide evidence of their conceptual understanding of the system. The use of this assessment strategy is easily administered and evaluates the structure of each students' mental representation of the way that the system works, their mental model ( Jonassen et al., 1990 ; Satchwell & Johnson, 1992 ). The card-sorting tasks consisted of two types of knowledge structure assessments used by Satchwell and Johnson (1992) : the modified fill-in-the-structure task ( Naveh-Benjamine & Lin, 1991 ) and the non-structured sorting task. During the modified fill-in-the-structure task, the subjects were individually asked to arrange their cards on a sheet of paper that contained the accurate skeletal structure of the system without the concept labels. The complexity of this task varied from five to fifteen different concepts for each map. At the end of a five-minute period, the subjects were asked to glue their cards onto the paper.
Table 3 Sample Test Questions Directed at Six Cognitive Attributes
Cognitive Tribute Sample Test Questions System Theory During voltage regulation, the adjusted generator field
output is sent to terminal ____ of the starter/generator.
When both generators are on-line and producing power,
which generator feeds current to the No. 2 dual-fed bus?Electronic
Symbol
IdentificationThe external power unit supplies power to which bus(es)?
On the dual-fed system, where does the power to energize
the inverters come from?Tracing a
DiagramOn the multiple-bus system, which bus is the power select
relay energized from?
Without external power applied and the battery switch off,
list the bus(es) that can receive power.Recalling Can the triple-fed bus energize the right generator bus?
What is the function of a diode?Identifying
Relationships
&PatternsWhich bus does the battery feed directly into?
If the generator field circuit opens, generator output is?Predicting During the generator-assisted start, can the generator that
is on-line still recharge the battery?
If the starter switch is activated with a generator on-line,
the generator will?The non-structured sorting task was slightly more difficult to perform. During this task, each subject was provided with a blank sheet of paper and a set of cards that contained the concept labels. The subjects were then asked to arrange the cards in a way that represented the proper flow of the selected concepts. At the end of five minutes, the subjects were asked to glue their cards in place, draw lines to indicate the relationship between concepts, and then place arrowheads at the ends of each line to indicate the direction of current flow in the system.
Procedure
The experiment took place over a four-week period. Each week students were assigned one unit of the training manual to be completed outside of class. Subjects were asked to complete each unit using the following procedures: (a) viewing a videotape that accompanied the manual, (b) reading each unit of instruction, and (c) answering the questions at the end of each unit. Following each unit of instruction, the subjects were given unit tests that were designed around the structure, function, and behavior of the system.
During the assigned laboratory session following each unit test, subjects were asked to complete several card-sorting tasks. Johnson and Satchwell (1992) reported that the structured card-sorting tasks were easier to complete. Therefore, each card-sorting session was initiated with at least one modified fill-in-the-structure task to help eliminate any possible test anxieties held by the students. During each session the modified fill-in-the-structure tasks were followed by at least one non-structured task.
Results
Test Analysis
Technical System Understanding . The Mann-Whitney U test was computed using structural items, functional items, behavioral items, and total scores as the dependent variables. The Mann-Whitney U test statistic revealed a statistically significant difference (Mann-Whitney U test statistic = 12.00, p < .05) for the functional level of technical system understanding. The mean score ( M = 10.75) for the functional level of technical system understanding for students who received the functional flow diagrams was found to be significantly higher than the mean score ( M = 8.10) for subjects receiving the training manual containing schematic diagrams. Therefore, the null hypothesis was rejected regarding the functional level of understanding. However, the null hypothesis is supported with regard to the level of system understanding of structure, behavior, and overall system understanding (i.e., total exam scores).
Cognitive Abilities . Analysis of variance (ANOVA) was computed using the following dependent variables: system theory, electronic symbol identification, tracing a diagram, recalling, identifying relationships and patterns, and predicting. The ANOVA resulted in significant differences among the experimental groups for four of the six cognitive attributes, F (5,24) = 3.40, p < .05, explored by each respective attribute test items in the performance tests administered after each unit of instruction (see Table 4). The mean and standard deviation scores by experimental group for the six cognitive attributes are provided in Table 5. As might have been anticipated, subjects receiving instruction using functional flow diagrams performed better on the test items related to the cognitive attributes of system theory and predicting. Subjects from the treatment group also out-performed control group subjects on test items requiring electronic symbol identification. This is contrary to the a priori notion that subjects using schematic diagrams during instruction would perform better on test items related to this cognitive process because of the repeated use of abstract electronic symbols. A statistically significant difference was found in subjects' mean scores on attribute test items related to tracing a diagram. Subjects from the control group out-performed subjects from the treatment group receiving the functional flow diagrams. This is consistent with an a priori prediction that students using schematic diagrams would have to trace the schematic diagram several times in order to develop an understanding of the system.
Table 4 Analysis of Variance on Experimental Group and Cognitive Attributes
Cognitive Attribute df Sum of
SquaresMean
SquareF
System Theory 1 0.313 0.36 8.74* Electronic Symbol
Identification1 0.166 0.01 22.82* Tracing a Diagram 1 0.054 0.01 4.84* Recalling 1 0.003 0.01 0.22 Identifying Relationships
& Patterns1 0.002 0.01 0.23 Predicting 1 0.104 0.02 4.66*
*p < .05.
Table 5 Means and Standard Deviations for Cognitive Attributes
Treatment-92
(n = 20)Control-91
(n=10)Cognitive Attribute M SD M SD
System Theory 0.83 0.20 0.62 0.16 Electronic Symbol
Identification0.91 0.08 0.75 0.10 Tracing a Diagram 0.74 0.10 0.83 0.12 Recalling 0.78 0.10 0.76 0.12 Identifying Relationships
& Patterns0.78 0.10 0.76 0.10 Predicting 0.76 0.17 0.63 0.11
Knowledge Structure Analysis
During the card-sorting tasks, a total of 10 knowledge structure maps was developed by each of the subjects. The maps represent 10 different concepts taught in the training manual. These data were analyzed in a number of ways. First, the knowledge structure maps were analyzed to calculate a measure of spatial association. Data matrices were constructed for each concept map. Generalized measures of association between the data matrices were then determined using MicroQAP, a microcomputer implementation of generalized measures of spatial association ( Anselin, 1986 ). Correlation coefficients comparing subject maps to expert maps were calculated and averaged across all card-sorting tasks. The results of a t test calculation identified no significant differences between the control and treatment groups in their knowledge construction, t (22) = 1.261, p > .05.
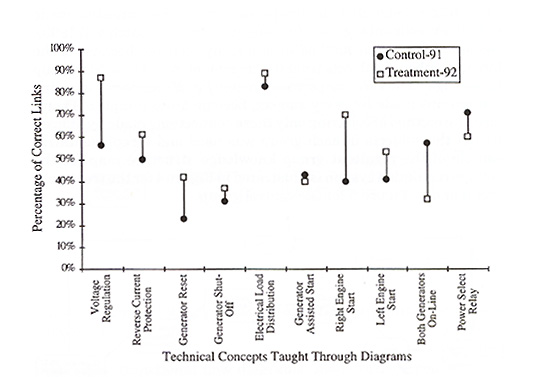
To provide another index of similarity and to further illustrate differences between the control and treatment groups' ability to create an expert-like mental model, the total number of correct links between concepts was tabulated for each subject's knowledge structure map. As shown in Figure 3, there was a distinguishable difference between the two groups in their ability to place the concept cards in the correct location on the knowledge structure maps related to voltage regulation, generator reset, and right engine start. The group that learned from the functional flow diagrams was able to accurately link a total of 57% of the concepts while the group that learned from the schematic diagrams was able to accurately link a total of 51% of the concepts. Also, the control group was able to correctly place a higher percentage of concepts on maps related to generator-assisted start, both generators on-line, and power select relay (see Figure 3).
Figure 3 Comparison of accuracy in knowledge construction tasks.
In addition to the similarity indices (i.e., generalized measures of association and the total number of correct links), the knowledge structure maps were analyzed to determine how they varied from the ideal layout. Group knowledge structure maps were generated from the individual maps to determine if any common misconceptions, held by the subjects, could be identified. The group knowledge structure maps were generated using a method adopted from the work of Gitomer (1988) in which only connections (i.e., correct and erroneous) made by at least half of the subjects were identified. This method of representing results of the generated group maps differs from that of the previous Satchwell and Johnson study (1992) . As they disseminated the results of that study, the authors presented a group knowledge structure map indicating every connection made by both experimental groups ( n = 4) (see Johnson & Satchwell 1993 ). Deviation from their method in this study occurred because of the larger number of subjects from the treatment group ( n = 20). Group knowledge structure maps constructed for 20 subjects, showing connections made by every subject, become quite complex. Therefore, the method of selecting only those connections made by at least half of the subjects in each group was used and a representative sample of the resultant group knowledge structure map for the voltage regulation system is illustrated in Figure 4 for the treatment group and in Figure 5 for the control group.
Figure 4 Treatment-92 group knowledge structure map for voltage regulation.
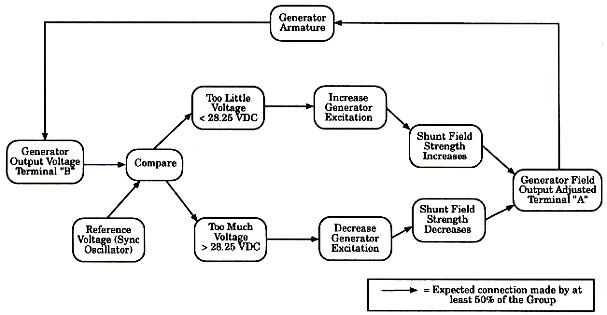
A visual analysis between the treatment group's representation across all 10 concepts reveals a number of things. First, the group representations exhibit a number of missing expected connections. Of the 94 possible connections on the expert-like maps, only 60% of those expected connections were made by the majority of subjects who received functional flow diagrams during instruction, while 66% of the expected connections were made by the majority from the control group.
Another observation from this visual analysis was the number of erroneous connections made by the majority of subjects from both groups. The majority of subjects who received the treatment during instruction (functional flow diagrams) made three erroneous connections across all 10 maps and the control group majority made a total of 34 erroneous connections. Of the 34 erroneous connections made by the majority of control group subjects, 6 of them can be identified as reversals, indicating a misconception about the direction of current flow.
Figure 5 Control-91 group knowledge structure map for voltage regulation.
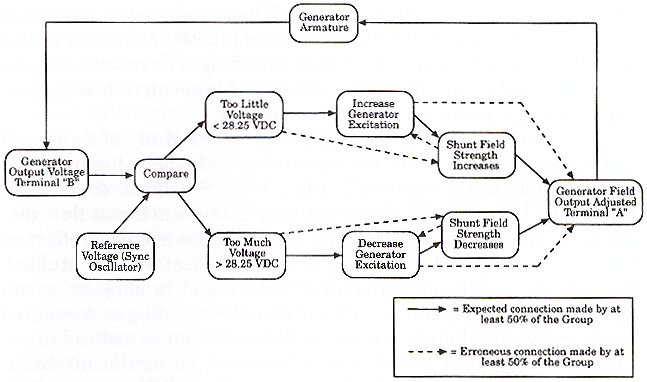
The group knowledge structure maps developed for the voltage regulation system (see Figures 4 and 5), indicate that the majority of students from both groups was able to make all of the expected connections correctly. However, the knowledge structure map developed for the control group (see Figure 5) indicates six erroneous connections made by half of the subjects in this group. This suggests that students who received the treatment had fewer misconceptions about the operation of this system.
Discussion
Care must be taken when interpreting the findings of this study. However, the findings, when combined with those from the previous study by Satchwell and Johnson (1992) , have practical value in spite of the problems encountered during this study and the small sample size used during both investigations. When combined, the findings increase confidence in the effectiveness of functional flow diagrams for enhancing technical system understanding. The results also can be used as indicators for future studies of innovative pedagogical approaches for technical system instruction.
The results, after replicating the previous study of Satchwell and Johnson (1992) , were not consistent with their disseminated findings ( Johnson & Satchwell, 1992 , 1993; Satchwell & Johnson, 1992 ). The initial study suggested that using functional flow diagrams to complement instructional materials has a positive effect on learners' overall understanding of the technical system studied. Statistically significant differences were found in subjects' mean scores related to the functional level of understanding as measured by respective attribute test items in the performance tests administered after each unit of instruction. However, no significant differences were found for an overall understanding of the system. This pedagogical approach appears to be an effective way of helping students develop accurate knowledge structures for reasoning about the function of technical systems.
Another inconsistency with the earlier findings of Satchwell and Johnson (1992) was found regarding the similarity indices (i.e., generalized measures of association and the total number of correct links). Correlation coefficients comparing subject maps to expert maps were calculated and averaged across all card-sorting tasks. The results of a t test calculation identified no significant difference between the control and treatment groups in their ability to develop accurate knowledge structure maps. However, several group differences were revealed by displaying the percentage of correct links (see Figure 3). One difference found was that the subjects from the treatment group receiving the functional flow diagrams created a more expert-like mental model of the voltage regulation system than did students who used only schematic diagrams.
Displaying the percentage of correct links for both groups revealed one other difference inconsistent with the findings of Satchwell and Johnson in their previous study (1992). The control group receiving only schematic diagrams outperformed the treatment group receiving the additional functional flow diagrams during the last two card-sorting tasks. What could account for this inconsistency? During this investigation, the Institute of Aviation received notice from the University of Illinois of a pending reduction in funding of the Institute. This occurred during the week prior to beginning this experiment and possibly may have had a negative influence on the study's participants. The inconsistent finding from that of Satchwell and Johnson's earlier investigation (1992) suggests that the performance of the treatment group may have been reduced by the negative information.
The process of generating group knowledge structure maps for the various concepts studied during this experiment helped to support the notion of "conceptual chunking" that takes place when experts organize their domain-specific knowledge. Evidence of this can be seen in the connections made by the majority of subjects from each group. Even though several of the group maps are not very accurate when compared to the expert map, conceptual chunks of information can be identified in each map.
This investigation extended the previous study of Satchwell and Johnson (1992) by exploring the effect that the functional flow diagram might have on a student's cognitive abilities related to technical systems understanding. Although this study found that the use of functional flow diagrams was effective at increasing students' ability to understand system theory and to make predictions regarding system outcomes, additional research is needed in this area.
Why were the functional flow diagrams effective at increasing the students' understanding at the functional level, as well as their ability to understand system theory and to predict system outcomes? While other factors could have been involved, it appears that three characteristics of the functional flow diagram may account for this effect. One obvious characteristic of the functional flow diagram is its simplicity. These diagrams depict only the essential components of the system while the schematic diagrams used in the control package include non-essential parts (see Figure 1). This simplicity may help students resolve any ambiguities about the system. A second characteristic that may explain the effectiveness of the functional flow diagrams is its ability to show meaningful relationships between the concepts and the component parts of a given system (e.g., the line contractor closes before power can energize the generator bus). The third unique characteristic of the functional flow diagram is its ability to convey the causal nature of the system to the learner (e.g., the generator field circuit opens and generator output is inhibited), thereby helping the learner develop a mental model that resembles the expert's causal mental model. Students who develop expert-like mental models are able to infer how technical systems will behave under various conditions ( Schlager et al., 1988 ; White & Frederiksen, 1987 ) and entertain specific hypotheses to correctly predict system outcomes when multiple outcomes are possible ( Norman, 1983 ).
Implications for Theory and Technical Training
The findings of this study support the notion of conceptual chunking identified in documented literature ( Egan & Schwartz, 1979 ; Gitomer, 1988 ). When group maps are generated, chunks of information can be illustrated for the majority of students. These generated-group knowledge structure maps also help to support the claim by Means and Gott (1988) that novices have fewer, less-developed mental models. While novices may know about individual components within a technical system, they often do not know which components are important to a problem, or how the parts relate to each other and to the system as a whole ( Johnson, 1987 ; Means & Gott, 1988 ; Schlager et al., 1988 ).
The results also may support the findings of McAlister (1992) , who concluded that schematic diagrams provide information about visible attributes of a system. During his study, subjects using schematic diagrams were able to "develop a mental model of something they previously knew very little about" (p. 89). Subjects who learned about technical systems using schematic diagrams were able to construct relatively accurate knowledge structure maps.
In addition to augmenting existing theory, this study has implications for instructional designers, instructional media illustrators, and practitioners. Instructional designers should reflect on these findings when designing instructional materials for technical system instruction. When considered together, the findings of this study and others ( Brown & Burton, 1987 ; de Kleer, 1985 ; Satchwell & Johnson, 1992 ) suggest that instructional materials, designed to teach technical system understanding, may be developed and evaluated at three different levels (i.e., structural, functional, and behavioral) and that the use of functional flow diagrams enhances students' conceptual understanding of the system. While the traditional focus on overt, observable behaviors is still important during technical instruction, cognitive theory mandates a significant change in emphasis, whereby student outcomes are described and assessed in terms of modifications to the internal representations of knowledge held by students. The card-sorting task, although not the focus of this study, proved to be an effective way of assessing students' internal knowledge structures of technical systems. This technique lends itself to a variety of applications in which a person's knowledge structure needs to be assessed. Further refinements in this technique may lead to the development of an authentic assessment tool, as recommended by cognitive theory, that can be used effectively in technical courses.
Instructional media illustrators (e.g., those who illustrate textbooks, service manuals, procedure charts, or computer programs) should consider these findings when selecting what type of illustrations to use when depicting technical systems for instruction. Introducing technical systems instruction using functional flow diagrams leads to an increased understanding of the technical system, as well as a modification to the mental model sustained by students. Functional flow diagrams, illustrating the fundamental concepts and component parts of technical systems, help to reinforce a critical systems view by explicitly showing the "big picture" of a system and its related subsystems. Functional flow diagrams also can be used to illustrate explicitly the causal relationships between a system's essential components, as well as the direction of flow through the system using arrows and action-oriented concept labels. Developing causal mental models by illustrating technical systems, via functional flow diagrams, will enable the novice to be more successful in analyzing the conceptual aspects of a technical system. The findings of this study, when combined with those of the previous Satchwell and Johnson (1992) investigation, suggest that instructors who want to teach technical systems at a conceptual level of understanding should consider introducing these systems to their students using a functional flow diagram.
These investigations provided examples of multiple methods of student assessment. First, each unit of instruction was evaluated by unit tests designed around three levels of system understanding (i.e., structural, functional, and behavioral) and six cognitive attributes (i.e., system theory, electronic symbol identification, tracing a diagram, recalling, identifying relationships and patterns, and predicting). The second student assessment was in the form of two types of card-sorting tasks, one structured and the other non-structured. Knowledge structures cannot be assessed using traditional measurement devices. Instructors wishing to measure the growth of students' mental models of technical systems should consider using this card-sorting assessment tool. This methodology has been found to be an effective, authentic means of evaluating the knowledge structures held by students.
This study provided partial support for one pedagogical strategy that, according to Johnson and Satchwell (1993) , "has the potential to improve technical training" (p. 88). A major goal of technical training is to help students acquire the knowledge and skills that will enable them to interact competently with technical systems. The technician who is able to develop an accurate causal model of a system should be better able to understand the structural, functional, and behavioral aspects of that system. Technicians capable of reasoning about the system in this way may become more efficient troubleshooters, thus reducing the high cost of maintenance. Through investigations of this type, additional effective pedagogical methods may be found for assisting student acquisition of expertise.
Implication for Further Research
While an improved understanding of functional flow diagrams has been gained through this study, relevant questions remain. The following recommendations are made to guide future research efforts.
The amount of time needed to move an individual from the novice level to the desired level of competence is enormous ( Glaser & Chi, 1988 ; Posner, 1988 ). While the impact of functional flow diagrams on training time was not examined in this study, it is likely that training time could be reduced through effective pedagogical methods. Further study of this important variable is needed.
While this study demonstrated limited effects of functional flow diagrams on technical system understanding, the results are constrained by the small sample size, its restriction to one educational setting, and its limitation to only electrical systems. To further enhance this line of research, this study should be replicated to verify the results. Future efforts should include larger numbers of students, involve numerous educational settings, and extend beyond the electrical system used in this study. One important consideration to be controlled for during future replications of this study is the experimental treatment diffusion effect that was encountered during this study. This can be controlled for by making certain that members of the experimental groups do not receive the treatment at the same time.
With the rapid advances in instructional technology, it is possible to incorporate functional flow diagrams into computer-based instruction programs Johnson, Flesher, Ferej, & Jehng, 1992 ). Studies should be extended beyond textbook representations to hypermedia and animated representations to test these types of graphic illustration.
Author
Satchwell is Project Coordinator for the Integrated Mathematics, Science, and Technology Project, Illinois State University, Normal, IL.
References
Alesandrini , K. L. (1987). Computer graphics in learning and instruction. In H. A. Houghton, & D. M. Willows (Eds.), The psychology of illustration (pp. 159-188). New York: Springer-Verlag.
Anselin , L. (1986). MicroQAP, a microcomputer implementation of generalized measures of spatial association [Computer program]. Santa Barbara: Department of Geography, University of California. (National Science Foundation Grant No. SES-8600465)
Ausubel , D. P., Novak, J. D., & Henesian, H. (1978). Educational psychology: A cognitive view (2nd ed.). New York: Holt, Rinehart, and Winston.
Beech Aircraft Corporation (1986). Introduction to King Air electrical systems, field training package . Wichita, KS: Author.
Borgman , C. L. (1982). Mental models: Ways of looking at a system. Bulletin of the American Society for Information Science, 9 (2), 38-39.
Bouwman , M. J. (1983). Human diagnostic reasoning by computer: An illustration from financial analysis. Management Science, 29 (6), 653-672.
Brewer , W. F., & Nakamura, G. V. (1984). The nature and functions of schemas. In R. S. Wyer, & T. K. Srull (Eds.), Handbook of social cognition (pp. 110-160). Hillsdale, NJ: Erlbaum.
Brown , J., & Burton, R. R. (1987). Reactive learning environments for teaching electronic troubleshooting. In W. B. Rouse (Ed.), Advances in man-machine systems research (pp. 65-98). Greenwich, CT: JAI Press.
Chi , M. T. H., Feltovich, P. J., & Glaser, R. (1981). Categorization and representation of physics problems by expert and novices. Cognitive Science, 5 , 121-152.
Chi, M. T. H., Glaser, R., & Farr, M. J. (Eds.). (1988). The nature of expertise . Hillsdale, NJ: Lawrence Erlbaum Associates.
Cook , T. D., & Campbell, D. T. (1979). Quasi-experimentation: Design and analysis issues for field settings . Chicago, IL: Rand McNally.
Craik , K. J. W. (1943). The nature of explanation . New York: The Cambridge University Press.
de Kleer , J. (1985). How circuits work. In D. G. Bobrow (Ed.), Qualitative reasoning about physical systems (pp. 205-280). Cambridge, MA: The MIT Press.
de Kleer, J., & Brown, J. S. (1981). Mental models of physical mechanisms and their acquisition. In J. R. Anderson (Ed.), Cognitive skills and their acquisition (pp. 285-309). Hillsdale, NJ: Lawrence Erlbaum Associates.
de Kleer, J., & Brown, J. S. (1983). Assumptions and ambiguities in mechanistic mental models. In D. Gentner & A. L. Stevens (Eds.), Mental models (pp. 155-190). Hillsdale, NJ: Lawrence Erlbaum Associates.
de Klerk, L. F. W. (1987, April). The role of prior experience in learning from instruction . Paper presented at the annual meeting of the American Educational Research Association, Washington, DC. (ERIC Document Reproduction Service No. ED 286 931)
Egan , D. E., & Schwartz, B. J. (1979). Chunking in recall of symbolic drawings . Memory and Cognition, 7 (2), 149-158.
Flesher , J. W. (1993). An exploration of technical troubleshooting expertise in design, manufacturing, and repair contexts (electronics troubleshooting, troubleshooting instruction). Dissertation Abstracts International, 54 . (University Microfilms No. ADG93-14867)
Gitomer , D. H. (1988). Individual differences in technical troubleshooting. Human Performance, 1 (2), 111-131.
Glaser , R. (1984). Education and thinking: The role of knowledge. American Psychologist, 39 (2), 93-104.
Glaser, R., & Chi, M. T. H. (1988). Overview. In M. T. H. Chi, R. Glaser, & M. J. Farr (Eds.), The nature of expertise (pp. xv-xxviii). Hillsdale, NJ: Lawrence Erlbaum Associates.
Gott , S. P., Bennett, W., & Gillet, W. (1986). Models of technical competence for intelligent tutoring systems. Journal of Computer-based Instruction, 13 (2), 43-46.
Jagacinski , R. J., & Miller, R. A. (1978). Describing the human operator's internal model of a dynamic system. Human Factors, 20 (4), 425-433.
Johnson , S. D. (1987). Knowledge and skill differences between expert and novice service technicians on technical troubleshooting tasks (Technical Report No. 20). St. Paul: University of Minnesota, Training and Development Research Center. (ERIC Document Reproduction Service No. ED 284 054)
Johnson, S. D. (1988). Cognitive analysis of expert and novice troubleshooting performance. Performance Improvement Quarterly, 1 (3), 38-54.
Johnson, S. D. (1991). Training technical troubleshooters. Technical and Skills Training, 2 (7), 9-16.
Johnson, S. D., & Satchwell, R. E. (1992, November). The effect of functional flow diagrams on the technical system understanding of apprentice aircraft maintenance mechanics . (Tech. Rep. No. MDS-469). Berkeley: University of California at Berkeley, National Center for Research in Vocational Education.
Johnson, S. D., & Satchwell, R. E. (1993). The effect of functional flow diagrams on apprentice aircraft mechanics' technical system understanding. Performance Improvement Quarterly , 6 (4), 73-91.
Johnson, S. D., Flesher, J. W., Ferej, A., & Jehng, J. C. (1992). Application of cognitive theory to the design, development, and implementation of a computer-based troubleshooting tutor (Report No. 265). Berkeley: University of California, National Center for Research in Vocational Education.
Johnson-Laird , P. N. (1980). Mental models in cognitive science. Cognitive Science, 4 (1), 71-115.
Johnson-Laird, P. N. (1983). Mental models . Cambridge, MA: Harvard University Press.
Jonassen , D. H., Beissner, K., Kenny, R., Jost, K., Reid, D., & Yacci, M. (1990). Conveying, assessing, and learning (Strategies for) structural knowledge. In M. R. Simonson, & C. Hargrave (Eds.), Proceedings of Selected Paper Presentations at the Convention of the Association for Educational Communications and Technology (pp. 297-308). Ames, Iowa: Iowa State University. (ERIC Document Reproduction Service No. ED 323 934)
Kieras , D. E., & Bovair, S. (1984). The role of a mental model in learning to operate a device. Cognitive Science, 8 , 255-273.
Larkin , J., McDermott, J., Simon, D. P., & Simon, H. A. (1980). Expert and novice performance in solving physics problems. Science, 208 (4450), 1335-1342.
Marzano , R. J., Brandt, R. S., Hughes, C. S., Jones, B. F., Presseisen, B. Z., Rankin, S. C., & Suhor, C. (1988). Dimensions of thinking: A framework for curriculum and instruction . Alexandria, VA: The Association for Supervision and Curriculum Development.
Mayer , R. E., & Gallini, J. K. (1990). When is an illustration worth ten thousand words? Journal of Educational Psychology, 82 (4), 715-726.
McAlister , B. K. (1992). Effects of analogical vs. schematic illustrations on initial learning and retention of technical material by eighth-grade students. Dissertation Abstracts International, 53 . (University Microfilms No. AAD92-36536)
Means , B., & Gott, S. P. (1988). Cognitive task analysis as a basis for tutor development: Articulating abstract knowledge representation. In J. Psotka, L. D. Massey, & S. A. Mutter (Eds.), Intelligent tutoring systems: Lessons learned (pp. 35-57). Hillsdale, NJ: Lawrence Erlbaum Associates.
Miller , D. R. (1955). The survey of mechanical insight . New York, NY: CBT/McGraw Hill.
Naval Education and Training Program Development Center. (1985). Module 4: Introduction to electrical conductors, wiring techniques, and schematic reading . (Naval Education and Training Command Publication No. 0507-LP-172-0405). Washington, DC: U.S. Government Printing Office.
Naveh-Benjamine , M., & Lin, Y. (1991). Assessing student's origination of concepts: A manual for measuring course-specific knowledge structures . Ann Arbor: National Center for Research to Improve Postsecondary Teaching and Learning, University of Michigan. (ERIC Document Reproduction Service No. ED 338 124)
Norman , D. A. (1983). Some observations on mental models. In D. Gentner & A. L. Stevens (Eds.), Mental models (pp. 7-14). Hillsdale, NJ: Lawrence Erlbaum Associates.
Novak , J., & Gowin, D. B. (1984). Learning how to learn . Cambridge: Cambridge University Press.
Novak, J., Gowin, D. B., & Johansen, G. T. (1983). The use of concept mapping and knowledge via mapping with junior high school science students. Science Education, 67 (5), 625-645.
Pankratius , W. J., & Keith, T. M. (1987, March). Building an organized knowledge base: Concept mapping in secondary school science . Paper presented at the annual meeting of the National Science Teachers Association, Washington, DC. (ERIC Document Reproduction Service No. ED 280 720)
Posner , M. I. (1988). Introduction: What is it to be an expert? In M. T. H. Chi, R. Glaser, & M. J. Farr (Eds.), The nature of expertise (pp.xxix-xxxvi). Hillsdale, NJ: Lawrence Erlbaum Associates.
Rouse , W. B., & Morris, N. M. (1985). On looking into the black box: Prospects and limits in the search for mental models (Report No.ONR-TR-85-2). Arlington, VA: Office of Naval Research, Personnel and Training Research Programs Office. (ERIC Document Reproduction Service No. ED 268 131)
Royer , J. M. (1986). Designing instruction to produce understanding: An approach based on cognitive theory. In G. D. Phye & T. Andre (Eds.), Cognitive classroom learning: Understanding, thinking and problem-solving (pp. 83-117). New York: Academic Press.
Satchwell , R. E., & Johnson, S. D. (1992, April). The effect of conceptual diagrams on technical system understanding . Paper presented at the annual meeting of the American Educational Research Association, San Francisco, CA.
Schlager , M., Means, B., & Roth, C. (1988, April). Cognitive analysis of expert knowledge: Input into design of training . Paper presented at the annual meeting of the American Educational Research Association, New Orleans, LA.
Stice , C. F., & Alvarez, M. C. (1986). Hierarchical concept mapping: Young children learning how to learn (A viable heuristic for the primary grades) (Report No. 5). Nashville: Tennessee State University, Center of Excellence, Basic Skills for the Disadvantaged, Reading/Writing Component. (ERIC Document Reproduction Service No. ED 274 946)
v Tennyson , R. D. (1988). An instructional strategy planning model to improve learning and cognition. Computers in Human Behavior, 4 (1), 13-22.
White , B. Y., & Frederiksen, J. R. (1987). Causal model progressions as a foundation for intelligent learning environments (Report No. 6686). Cambridge, MA: BBN Laboratories.
Reference Citation: Satchwell, R. E. (1996). Using functional flow diagrams to enhance technical systems understanding. Journal of Industrial Teacher Education , 34(2), 50-81.