JITE v44n3 - Retrospective Pretest: A Practical Technique For Professional Development Evaluation
Retrospective Pretest: A Practical Technique for Professional Development Evaluation
Jeff M. Allen, Ph.D.
University of North TexasKim Nimon, Ph.D.
Southern Methodist UniversityAbstract
The purpose of this study was to field test an instrument incorporating a retrospective pretest to determine whether it could reliably be used as an evaluation tool for a professional development conference. Based on a prominent evaluation taxonomy, the instrument provides a practical, low-cost approach to evaluating the quality of professional development interventions across a wide variety of disciplines. The instrument includes not only the questions typically associated with measuring participants’ reactions but also includes a set of questions to gauge whether and how much learning occurred. Results indicate that the data produced from the instrument were reliable.
Introduction
Professional development programs at the national, state, regional, and local levels are as diverse as the teachers attending the programs. Such programs may necessitate a week-long statewide conference, or a 45-minute after-school program. Conferences and after-school programs are often the preferred means of ongoing learning for experienced professionals.
However, as these programs conclude and teachers return to the classroom, administrators may be left wondering what effect these programs had on their teachers: Did the teachers like the program?
Did they gain any new knowledge, attitudes, or skills? Will the teachers’ on-the-job behavior change? What organizational improvements are likely to occur? Answering these questions requires that such programs be evaluated at multiple levels ( Kirkpatrick & Kirkpatrick, 2006 ).
Common to the majority of these evaluation levels is the concept of change. One of the most common techniques to measure change is the traditional pretest-posttest model. Evaluating change using a pretest-posttest model includes three phases: (a) administration of a pretest measuring the variable(s) of interest, (b) implementation of the intervention (or program), and (c) administration of a posttest that measures the variable(s) of interest again ( Gall, Gall & Borg, 2003 ).
However, implementing program evaluations to measure change using a traditional pretest-posttest model can be difficult to plan and execute ( Lynch, 2002; Martineau 2004 ). Not only must program evaluators gain stakeholders’ support to obtain reliable measures of change ( Martineau, 2004 ), but they must also respond to the challenges associated with garnering repeated measures when participants arrive late or leave early and developing instruments that are sufficiently sensitive to detect small program outcomes ( Lynch, 2002 ). The practical response to these challenges is that many programs do not benefit from a formal evaluation process, thereby leaving administrators with little information regarding program effectiveness.
Retrospective Pretest
The use of the retrospective pretest to evaluate program outcomes is making its way into the professional development spotlight. Evidence of this trend can be seen by the emergence of articles and presentations ( e.g., Hill & Betz, 2005 ; Lamb, 2005 ; Lynch, 2002 , Nimon & Allen, 2007 ) that describe retrospective pretest methods to help practitioners respond to the practical and measurement challenges associated with assessing program outcomes. Although many professional development specialists may be unaware of these techniques, the strategy of ascertaining participants’ retrospective accounts of their knowledge, skills, or attitudes prior to an intervention is not new.
Recognizing that traditional pretests are sometimes difficult or impossible to administer and citing exemplar studies conducted by Deutsch and Collins (1951) , Sears, Maccoby, and Levin (1957) , and Walk (1956) , Campbell and Stanley (1963) advocated the retrospective pretest as an alternative technique to measure individuals’ pre-intervention behavior. In essence, a retrospective pretest is distinguished from the traditional pretest by its relationship to the intervention (or program). That is, a retrospective pretest is a pretest administered post-intervention, asking individuals to recall their behavior prior to an intervention.
Since its inception, the retrospective pretest has been incorporated in a variety of designs. In its first implementation, the retrospective pretest was used across areas of psychology to obtain refined psychometrics, such as patterns of child rearing ( Sears et al., 1957 ), measurements of fear ( Walk, 1956 ), and effects of racially mixed housing on prejudice ( Deutsch & Collins, 1951 ). In these cases, obtaining traditional pretest measurements was not possible or practical. However, by administering a retrospective pretest, practitioners were able to verify the pre-intervention equivalence of their experimental and control groups and to curb threats to validity that would have been associated with a posttest-only design.
Building on the research from the 1950s that incorporated the retrospective pretest, Howard, Ralph, Gulanick, Maxwell, and Gerber (1979) prescribed the tool as a remedy for response shift bias. Their research found that, when individuals did not have sufficient information to judge their initial level of functioning (i.e., individuals did not know what they did not know), the retrospective pretest provided a more accurate measure of pre-intervention behavior. Because the evaluation was administered post-intervention, participants could apply program knowledge in forming self-reports of their pre-intervention behavior.
Subsequent research (for a full review see Nimon & Allen, 2007 ), across a wide variety of measures, has indicated that retrospective pretests provide a more accurate measure of pre- intervention behavior. Allowing individuals to report their pre- and post-intervention level of functioning using the knowledge they gained from the intervention mitigates the effect of measurement standard variance that can occur in traditional pretest-posttest designs. In most cases, when participants do not have sufficient knowledge to gauge their pre-intervention behavior, they tend to overestimate their level of functioning. In traditional pretest-posttest designs, this effect has a negative influence on program outcome measures. When participants’ pre-intervention behavior is measured retrospectively, they generally provide more conservative estimates than they provide prior to the intervention. This effect has a positive influence on program outcome measures.
While Howard et al. (1979) prescribed adding the retrospective pretest to traditional pretest-posttest designs as a means of detecting and managing the presence of response shift bias (i.e., a statistically significant difference between retrospective pretest and traditional pretest), contemporary evaluators ( e.g., Lamb & Tschillard, 2005 ; Martineau, 2004 ; Raidl, Johnson, Gardiner, Denham, Spain & Lanting, 2002 ) have promoted the use of the retrospective pretest in lieu of the traditional pretest. Citing data which suggest that traditional pretests underestimate the impact of interventions, Lamb and Tschillard (2005) asserted that the retrospective pretest is just as useful as the traditional pretest in determining program impact in the absence of response shift bias and is even more useful when subjects’ understanding of their level of functioning changes as a consequence of the intervention. Similarly, Martineau (2004) argued that the retrospective pretest correlates more highly with objective measures of change than self-report gains based on traditional pretest ratings. Finally, Raidl et al. (2002) promoted the retrospective pretest over the traditional pretest because it addresses the challenges associated with obtaining complete datasets. Especially in the presence of late arrivers and early leavers, the instrument is useful because it can be administered at the conclusion of a program, in concert with a traditional posttest.
Evaluating Professional Development Conferences
Participants’ reactions to professional development conference sessions are typically implemented via smile sheets administered at the end of each program ( Kirkpatrick & Kirkpatrick, 2006 ). While over 90% of professional development programs measure participants’ reactions ( Sugrue & Rivera, 2005 ), evaluating learning is often considered a challenge that cannot be met because of issues relating to implementation, cost, and usage ( Lynch, 2002 ).
The purpose of this study was to field test an instrument incorporating a retrospective pretest to determine whether it could be used reliably as an evaluation tool for a professional development conference. The instrument includes not only questions typically associated with measuring participants’ reactions, but also includes a set of questions to gauge whether and how much learning occurred. Incorporating two levels (appropriate for this application) of Kirkpatrick and Kirkpatrick’s (2006) evaluation model, the instrument solicits level 1 (reaction) and level 2 (learning) evaluation data. The instrument was designed to be administered across all of the conference sessions, thereby providing a practical, low-cost, and useful evaluation tool (see Figure 1). As such, the study also served to measure participants’ reactions to each conference session as well as changes in learning.
Methods
Participants
During an annual professional development summer conference, the workforce education department of a public university hosted a professional development conference for a segment of educators employed in its state. Four hundred and six secondary educators attended the conference, and of those attending, 7 were pre-service teachers, 3 were administrators, 24 did not specify their role, and the remaining identified themselves as teachers. On average, participants attended 10 professional development sessions over the course of the 3-day conference. Over the 3-day period, 75 conference sessions were evaluated. All conference sessions were 60 minutes in length.
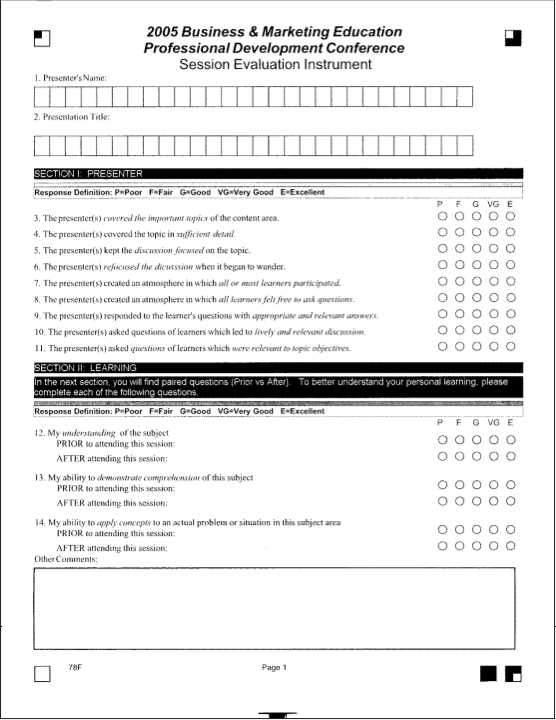
Figure 1 . Session evaluation instrument.
Instrumentation
At the end of each session, participants were asked to complete the session evaluation instrument designed by the authors for the study (see Figure 1). It should be noted that this is the first instrument of this nature used for professional development conferences of this scale. Items 1 – 2 of the instrument identify the presenter’s name and presentation title. Items 3 – 14 operationalize the first two levels of evaluation as defined by Kirkpatrick and Kirkpatrick (2006) , incorporating a five-point Likert scale (1 = poor ; 2 = fair ; 3 = good ; 4 = very good ; 5 = excellent ).
Level 1: Reaction . At the first level of Kirkpatrick and Kirkpatrick’s (2006) evaluation model, participants’ reactions to training are assessed. In the session evaluation instrument, items 3 – 11 solicit participants’ reactions to the session, answering the question – How well did conferees like the session? An overall reaction to the session was computed by averaging each participant’s response to items 3 – 11.
Level 2: Learning . In Kirkpatrick and Kirkpatrick’s (2006) evaluation model, the second level of evaluation builds on the first by determining how much knowledge was acquired as a consequence of the training. In the session evaluation instrument, items 12 – 14 measure participants’ perceptions of how much they learned from the session. Participants were asked to answer questions 12 – 14 twice. First, they were asked to retrospectively identify their level of knowledge prior to attending the session. Second, they were asked to report on their level of knowledge after attending the session. A retrospective pretest score was computed by averaging each participant’s retrospective response to items 12 – 14. A posttest score was computed by averaging each participant’s post-session response to items 12 – 14.
Data Analysis
Coefficient alpha was used to evaluate the reliability of the scale and subscales scores resulting from the instrument. Descriptive statistics and weighted means ( Hedges & Olkin, 1985 ) were used to compare participants’ reaction and learning across conference sessions. For each session, paired-samples t tests were employed to determine whether there was a statistically significant difference in participants’ retrospective pretest and posttest scores. To determine the practical significance of measured changes in learning, d was calculated as defined by Dunlap, Cortina, Vaslow, and Burke (1996 , p. 171):
d = t c [2(1- r )/ n ] 1/2
where t c is t for correlated measures, r is the correlation between measures, and n is the sample size per group. Descriptive statistics and weighted means ( Hedge & Olkin, 1985 ) were used to compare the standardized mean differences ( d ) across conference sessions.
Results
Reliability
The evaluation instrument was administered after each of the conference’s 75 sessions, providing over 1,200 responses to the survey. Across the 75 sessions, coefficient alpha for the entire instrument ranged in values from 0.788 to 0.970 (see Table 1). Coefficient alpha values for the level 1 subscale (items 3 – 11) ranged from 0.905 to 0.992. Coefficient alpha values for the level 2 retrospective pretest subscale (retrospective response to items 12 – 14) ranged from 0.876 to 0.994. Coefficient alpha values for the posttest subscale (post-session response to items 12 – 14) ranged from 0.754 to 0.990.
Validity
The validation of any instrument must be proven through multiple interventions in multiple situations. The authors do not purport any validity beyond this study. The intent of this particular application is simply to demonstrate that this type of instrument is a viable method of obtaining reliable quantitative data during professional development conference. It is hoped that this application of this type of retrospective instrument will lead others to conduct similar studies that can provide further insight into the validity of this instrument.
Table 1
Coefficient Alpha Reliability Measurements for Session Evaluation Instrument a Items Min Max Total 3 – 11 0.788 0.970 12PRIOR– 14PRIOR 12AFTER– 14AFTER Reaction 3 – 11 0.905 0.992 Retrospective learning 12PRIOR– 14PRIOR 0.876 0.994 Post-session learning 12AFTER– 14AFTER 0.754 0.990 Note: a Instrument administered across 75 conference program sessions
To determine whether the difference between the prior and post knowledge survey responses was driven by a desire for the participants to appear favorably with the presenters, a review of qualitative feedback was conducted. The open-ended comment section allowed participants to explain the difference in prior and post responses. Although most participants recorded no clear reasons for the difference in prior and post knowledge, those who did respond indicated overwhelmingly that they had learned new knowledge and skills. Responses such as “The session helped me to better integrate classroom management into my CTE classroom” and “This information will be used day one in class” further support the quantitative difference in prior and post knowledge changes reported. These specific examples reflect the theme provided by other participants.
Descriptive and Inferential Statistics
Table 2 summarizes the descriptive statistics for the reaction scores, retrospective pretest scores, and posttest scores. It also includes descriptive statistics for the resultant effect sizes generated when comparing the retrospective pretest scores to posttest scores.
Level 1: Reaction . Averaging participants’ reaction scores across each session produced session reaction scores that ranged between 2.957 to 4.761, with a mean of 4.291 and a standard deviation of 0.319. Weighted by the number of participants attending each of the 75 sessions, the average reaction rating, across all conference sessions, was 4.262. These results indicate that on average participants rated the conference “very good” from the perspective of satisfied they were with the conference sessions.
Table 2
Conference Evaluation Results a Straight Weighted x Min Max SD M a M b Reaction 2.957 4.761 0.319 4.291 4.262 Retrospective 1.518 3.717 0.427 2.836 2.810 Pretest Posttest 2.922 4.471 0.342 3.970 3.923 d Post-Retro 0.385 2.246 0.374 1.274 1.242 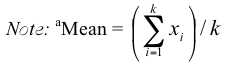
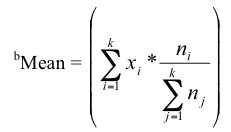
k = # of sessions, n = # of participants per session.
Level 2: Retrospective pretest . Averaging participants’ retrospective pretest scores across each session produced session scores that ranged from 1.518 to 3.717, with a mean of 2.836 and a standard deviation of 0.427. Weighted by the number of participants attending each of the 75 sessions, the average retrospective pretest score, across all conference sessions, was 2.810. These results indicate than on average, participants rated their pre-workshop knowledge of the conference session material as “good”.
Level 2: Retrospective posttest . Averaging participants’ posttest scores across each session produced scores that ranged from 2.922 to 4.471, with a mean of 3.970 and a standard deviation of 0.342.Weighted by the number of participants attending each of the 75 sessions, the average retrospective posttest score, across all conference sessions, was 3.923. These results indicate than on average, participants rated their post-workshop knowledge of the conference session material as “very good”.
Level 2: Change . Analyzing the retrospective pretest and posttest scores with a paired samples t test revealed that each of the session’s pretest and posttest scores were statistically significantly different from each other at the .05 alpha level. Across the 75 sessions, the standardized mean difference ( Cohen, 1988 ) between the two scores ranged from .385 to 2.246, with a mean of 1.274 and a standard deviation of .374. Through the use of a weighted average based on the number of participants completing the evaluation ( Hedges & Olkin, 1985 ), the posttest scores across the 75 sessions were on average 1.242 standard deviations greater than the retrospective pretest scores.
Discussion
Results indicate that the data produced from the instrument designed for this study were reliable. However, because the data were based on participants’ memory of their pre-intervention behavior, the validity of the results may be in question. While the retrospective pretest stands alone as a remedy for the confounding effect that an intervention can have on instrumentation ( Lamb, 2005 ), it is often associated with threats to validity including implicit theory of change ( Ross & Conway, 1986 ) and impression management ( Pearson, Ross, & Dawes, 1992 ).
While further revisions to the instrument and encompassing methodology should consider how resultant data can be validated, it is also important to consider validity issues within the context of the intervention. For example in this study, the data were collected at a professional development conference. Impression management therefore did not likely threaten the validity of the results because participants were not in a situation in which it was important to please the presenter or their boss. Further, if the instrument measured a perceived change in learning rather than an actual change in learning, the measurement is significant because the process of adopting an implicit theory of change is an important step in the process of transferring learning to on-the-job behavior ( W. K. Kellogg Foundation, 2004 ).
While the retrospective pretest has been described as a useful but imperfect tool ( Lamb, 2005 ), it uniquely provides a technique to garner pre-intervention data that might not otherwise be feasible. As defined by Campbell and Stanley (1963) , it uniquely serves to curb the rival hypotheses of history, selective mortality, and shifts in initial selection.
In the case of this study, employing a retrospective pretest in conjunction with a posttest provided conference stakeholders with information to relate levels of learning to groups of participants and presentation content (Figures 2 and 3 provide example reports generated from the survey data). This information served not only to measure the quality of the professional development conference described, but also to provide pertinent data to improve the quality of future conferences.
Because this instrument was designed to be content neutral, its application extends across disciplines. Just as the retrospective pretest technique has been successfully used in medical, training, organizational development, and educational interventions ( Nimon & Allen, 2007 ), the instrument described herein has the opportunity to be used across a wide variety of professional development interventions.
Implications for Educators and Administrators
Retrospective analysis is an underutilized assessment tool that can serve as a practical and appropriate evaluation technique to assess the learning and performance improvements gained during professional development. However, the authors wish to note that this technique is not a replacement for traditional pretest-posttest techniques. It is an evaluation technique best utilized when the ability to independently assess learning and performance improvement gains is limited due to time and resources.
The ability of professional development program evaluators to quantitatively measure learning and performance improvement is challenged by both time and resources. We believe that this cost- effective technique provides another valuable tool for professional development evaluators and yields reliable information for program development administrators at any level.
Professional Development Conference Session Evaluation Summary Report Reaction Pretest Posttest Session # n M SD M SD M SD d Session 1045 27 4.35 .59 2.63 0.98 3.81 0.88 1.62 Session 1050 26 3.78 .88 2.94 0.83 3.81 0.87 1.02 Session 1055 9 4.35 .56 2.63 0.77 3.96 0.72 1.79 Session 1060 28 4.26 .72 3.05 0.99 4.04 0.78 1.11 Session 1065 195 4.42 .71 3.08 1.32 4.10 0.78 0.94 Session 1070 33 4.07 .74 3.13 0.60 3.88 0.55 1.29 Session 1075 107 4.43 .65 3.04 1.05 4.02 0.80 1.05 Session 1080 68 4.17 .68 2.25 0.84 3.94 0.65 2.25 Session 1085 39 4.54 .59 2.87 1.13 4.31 0.79 1.47 Session 1090 102 4.25 .72 3.24 1.01 3.92 0.83 0.74 Session 1095 46 4.76 .47 2.83 1.15 4.47 0.59 1.80 Figure 2 . Session evaluation summary report (partial).Session 1110 38 4.21 .62 2.82 0.76 3.84
Professional Development Conference Session Evaluation Detailed Report Session 1045 n = 27 M SD 1. The presenter covered the important topics of the 4.41 0.57 content area. 2. The presenter covered the topic in sufficient detail . 4.41 0.57 3. The presenter kept the discussion focused on the 4.48 0.51 topic. 4. The presenter refocused the discussion when it 4.37 0.74 began to wander. 5. The presenter created an atmosphere in which all 4.30 0.82 or most learners participated. 6. The presenter created an atmosphere in which all 4.37 0.74 learners felt free to ask questions. 7. The presenter responded to the learner’s questions 4.37 0.74 with appropriate and relevant answers. 8. The presenter asked questions of learners which 4.19 0.79 led to lively and relevant discussion . 9. The presenter asked question of learners which 4.30 0.72 were relevant to topic objectives. 10. My understanding of the subject. PRIOR to attending this presentation: 2.59 0.97 AFTER attending this presentation: 3.85 0.82 11. My ability to demonstrate comprehension of this subject. PRIOR to attending this presentation: 2.70 1.03 AFTER attending this presentation: 3.81 0.88 12. My ability to apply concepts to an actual problem or situation in this subject area. PRIOR to attending this presentation: 2.59 1.01 AFTER attending this presentation: 3.78 0.97 Figure 3 . Session evaluation detailed report.
References
Campbell, D. T., & Stanley, J. C. (1963). Experimental and quasi- experimental designs for research on teaching. Chicago, IL: RandMcNally.
Cohen, J. (1988). Statistical power analysis for the behavioral sciences (2 nd ed.). Hillsdale, NJ: Erlbaum.
Deutsch, M., & Collins, M. E. (1951). Interracial housing: A psychological evaluation of a social experiment. Minneapolis: University of Minnesota Press.
Dunlap, W. P., Cortina, J. M., Vaslow, J. B., & Burke, M. J. (1996). Meta-analysis of experiments with matched groups or repeated measures. Psychological Methods, 1, 170-177.
Gall, M. D., Gall, J. P., & Borg, W. R. (2003). Educational research: An introduction (7 th ed.). New York: Allyn and Bacon.
Hedges, L. V., & Olkin, I. (1985). Statistical methods for meta- analysis. New York: Academic Press.
Hill, L. G., & Betz, D. L. (2005). Revisiting the retrospective pretest. American Journal of Evaluation, 26 , 501-507.
Howard, G. S., Ralph, K. M., Gulanick, N. A., Maxwell, S. E., & Gerber, S. K. (1979). Internal validity in pretest-posttest self- report evaluations and a re-evaluation of retrospective pretests. Applied Psychological Measurement, 3 , 1-23.
Kirkpatrick, D. L., & Kirkpatrick, J. D. (2006). Evaluation training programs: The four levels (3 ed .). San Francisco, Berrett- Koehler Publishers, Inc.
Lamb, T. (2005). The retrospective pretest: An imperfect but useful tool. The Evaluation Exchange, 11 (2). Retrieved October, 19, 2005, from http://www.gse.harvard.edu/hfrp/eval/issue30/spotlight.html
Note : The url provided above returned invalid results.
Visit the homepage at:
http://www.hfrp.org/Lamb, T. A., & Tschillard, R. (2005, Spring). Evaluating learning in professional development workshops: Using the retrospective pretest. Journal of Research in Professional Learning. Retrieved October 19, 20005, from http://www.nsdc.org/library/publications/research/lamb.pdf
Lynch, K. B. (2002, November). When you don't know what you don't know: Evaluating workshops and training sessions using the retrospective pretest methods. Paper presented at the meeting of the American Evaluation Association Annual Conference, Arlington, VA.
Martineau, J. (2004). Evaluating leadership development programs: A professional guide. Greensboro, NC: Center for Creative Leadership.
Nimon, K., & Allen, J. (2007). A review of the retrospective pretest: Implications for performance improvement evaluation and research. Workforce Education Forum, 44 (1), 36 – 55.
Pearson, R. W., Ross, M., & Dawes, R. M. (1992). Personal recall and the limits of retrospective questions in surveys. In J. M. Tanur (Ed.), Questions and survey questions: Meaning, memory, expression, and social interactions in survey (pp. 65-94). New York: Russell Sage.
Raidl, M., Johnson, S., Gardiner, K., Denham, M., Spain, K., & Lanting, R. (2004). Use retrospective surveys to obtain complete data sets and measure impact in extension programs. Journal of Extension, 42(2). Retrieved October 19, 2005, from http://www.joe.org/joe/2004april/rb2.shtml
Ross, M., & Conway, M. (1986). Remembering one’s own past: The construction of personal histories. In R. M. Sorrentino & E. T. Higgins (Eds.), Handbook of motivation and cognition (pp. 122- 144). New York: Guilford Press.
Sears, R. R., Maccoby, E. E., & Levin, H. (1957). Patterns of child rearing. Evanston, IL: Row, Peterson.
Sugrue, B., & Rivera, R. J. (2005). State of the industry: ASTD’s annual review of trends in workplace learning and performance. Alexandria, VA: American Society for Training & Development.
Walk, R. D. (1956). Self-ratings of fear in a fear-invoking situation. Journal of Abnormal and Social Psychology, 52 , 171-178.
W. K. Kellogg Foundation (2004). Logic model development guide. Battle Creek, MI: Author.
Jeff M. Allen is an Associate Professor in the College of Education at the University of North Texas . He can be reached at jallen@unt.edu .
Kim Nimon is a Research Assistant Professor in the College of Education and Human Development at Southern Methodist University . She can be reached at kim.nimon@gmail.com .