JITE v45n1 - Analysis of Cognitive and Performance Assessments In an Engineering/Technical Graphics Curriculum
Analysis of Cognitive and Performance Assessments in an Engineering/Technical Graphics Curriculum
Jeremy V. Ernst
North Carolina State University
Abstract
The purpose of this study was to evaluate cognitive and performance assessments using high school trade and industrial engineering/technical graphics student scores on a standardized post-assessment and a series of curriculum specified performance projects in the state of North Carolina. Paired performance and cognitive student achievement data were collected and examined uncovering variations, differences, and correlations between the two methods of assessment. Significant differences between North Carolina Engineering/Technical Graphics I cognitive and performance assessment results were identified. Further examination of the data provided evidence that the cognitive and performance assessment results tend to increase or decrease together. Potential refinement of state assessment procedures and the possibility for assimilation of assessment practices given the need for varied assessment for individual and school accountability are discussed.
Introduction
Recent state and national standards documents and other systematic initiatives have encouraged improvements in state curricula and teacher instruction. Along with transformation in educational practice and instruction, a change in assessment practices is also required ( Firestone & Schorr, 2004 ). Kiker ( 2007 ) indicates that business and industry leaders, paired with school reform advocates, suggest that successful preparation for the workplace and further education requires more than traditional core academic knowledge but also performance-based demonstrations and applications of knowledge. This presents a need for the development of assessments that measure 21st century skills and aptitudes within students.
The purpose of assessment is to accredit knowledge and performance of students ( Barrow, 2006 ). The role assessment plays in education has been expanded recently to gauge school quality. Student achievements on standardized tests have been progressively considered as principal indicators for school evaluation in the United States. “Most Americans believe students’ standardized test performances are the only legitimate indicator of a school’s instructional effectiveness” ( Popham, 2005 ). Over recent years, extensive changes in student assessment practices have been proposed. Federal and state agencies have encouraged the use of assessment procedures that are reflective of actual professional situations while implementing standardized assessments for accountability purposes ( Pell, 2006 ). Career and Technical Education (CTE) courses use performance-based measures that model work environments maximizing opportunities for applicable feedback.
CTE courses possess performance components that are fundamental in the measurement of skill-based technical proficiencies. Requiring students to directly demonstrate their abilities provides opportunities for the instructor to effectively assess competence ( Bracey & Resnick, 1998 ). Reeves ( 1996 ) suggested that standardized cognitive means of measurement fail to capture a true indication of individual performance competency, demonstrating the inadequacy of cognitive assessments and promoting alternative assessments.
Attainment of curricular goals through instructional standards-based content culminating in marketable knowledge and skill is a desired outcome of CTE. However, standardized assessment measures provide uniform measurement across student populations. “It is important that schools be held accountable, and that their performance be evaluated based on how well they succeed in teaching their students the basic set of knowledge and skills which they will need to become productive members of society” ( Petterway, 2006 ). The current school accountability measurement system leans heavily in favor of standardized assessment. A standardized test is any test that is administered, scored, and interpreted in a consistent, predetermined manner. Standardized tests are designed to make predictions about how a test taker will perform in a subsequent setting ( Popham, 2005 ).
Popham ( 2005 ) reports that there are two commonly used forms of standardized tests—standardized achievement tests and standardized curricular tests. Nationally standardized achievement tests make use of a comparative measurement approach. The essential rationale of all such tests is to compare a student’s score with the scores earned by a previous set of test takers. Standardized curricular tests have been developed for accountability at the state level to better assess students’ mastery of approved skills and knowledge. There is no single standardized achievement assessment that embodies an inclusive mapping of the content for student and school achievement ( Haladyna, Nolen, & Haas, 1991 ). It is not the intent of the developers and publishers of standardized educational tests to fully represent individual and school content attainment; it is merely one of many achievement indicators. Multiple indicators are better representative of achievement provided its complex nature.
A large number of items are organized into developmental acquisition or skill-based learning sequences in curriculum-based (criterion-referenced) instruments and referenced to programming guides or curricula. Since the early 1990s the North Carolina Department of Public Instruction has developed assessments for all curricula. Every high school course offered in the state of North Carolina in Career and Technical Education has a standardized curricular assessment. The assessment is twofold in that it consists of a cognitive segment and a performance segment. The cognitive assessment, a component of the Vocational Competency Achievement Tracking System (VoCATS), is composed of multiple-choice test items that are found in secure course test item banks. VoCATS is a competency-based, computer-supported system encompassing course planning for each program, lesson planning within each course area, and standardized assessment items for each course’s content. The performance assessment is composed of prescriptive activities accompanied by rubrics that identify desirable elements of the performance artifacts and categorize the level of attainment. An investigation was launched to pursue performance assessment and its potential incorporation into the state accountability system by first analyzing the Engineering/Technical Graphics I curriculum.
The Engineering/Technical Graphics I course is one of the many course offerings under the Engineering Technologies pathway of Trade and Industrial Education in the state of North Carolina. This course introduces students to the use of graphic tools used to communicate and understand concepts in the areas of architecture, manufacturing, and engineering. Topics include problem-solving strategies, classical representation methods (i.e. sketching), geometric construction techniques, orthographic projection, and 3-D modeling. Skills in communication and problem-solving are reinforced in this course.
Engineering/Technical Graphics Team
An engineering/technical graphics team was assembled to develop test items for the Engineering/Technical Graphics I assessment. The engineering/technical graphics team consisted of six engineering/technical graphics teachers from around the state, a local university representative, three CTE directors from around the state, and two VoCATS coordinators to oversee the CTE assessment process. Previous rubrics from North Carolina engineering/technical graphics curriculum projects were gathered and student drawings were acquired at different levels of quality. The team made copies of the student work and assessed each drawing using the previous engineering/technical graphics rubrics. Upon comparison of the scoring, the team found that there was a high degree of dissimilarity. Individual interpretations of the rubrics were similar, but different scoring results were calculated. The issue was constantly revisited throughout the course of a year, and the rubrics were eventually refined to the point that there were only minor differences in scoring between evaluators. The refined rubrics were then brought to the engineering/technical graphics teachers at a statewide conference to further investigate the scoring consistency. Drawings were distributed to the teachers and were evaluated. The results noted that a strong degree of scoring inconsistency still existed for rubric-based evaluation of performance assessment. Without extensive training, the refined rubrics did not seem to be a viable solution to the scoring inconsistency between performance evaluators.
Meanwhile, the CTE division of the North Carolina Department of Public Instruction launched an initiative to evaluate performance assessment in all program areas. The issue of scoring inconsistency was revisited, and upon further investigation, it was concluded that the use of rubrics in performance assessments was not the problem, but instead the performance assignments were so vaguely written that they were difficult to evaluate even when provided with a standardized assessment instrument. Other notable findings were that there were too many performance assessments in each course given the time allotments. The curriculum design process was altered to account for these performance assessment results. The Engineering/Technical Graphics I curriculum was updated to reflect these developmental changes.
Methodology
Teachers across the state of North Carolina were contacted and teacher participants in the study were selected based on interest. Seven teacher participants were selected from six different North Carolina counties to make up the engineering/technical graphics assessment team. The Engineering/Technical Graphics I curriculum is standardized in the state of North Carolina. The teachers used the existing Engineering/Technical Graphics I curriculum rubric and selected performance activities. Four performance projects were identified in which students could participate. Each performance project represented 25 points (of 100) of the overall student performance score. The teachers used as their cognitive assessment the state end-of-course assessment developed and administered by the state of North Carolina. The state VoCATS assessments are secure; classroom teachers cannot access assessments prior to administering them to their students. The VoCATS evaluation is scored on a 100-point scale. The teachers scored the three performance assessments and submitted them to the North Carolina Department of Public Instruction. The CTE division of the North Carolina Department of Public Instruction collected and scored the cognitive assessment items identified from the North Carolina VoCATS database. The purpose of these paired evaluations was to identify relationships when comparing cognitive and performance scores in Engineering/Technical Graphics I. The data were used to evaluate the null hypothesis: There are no significant differences in the means of the engineering/technical graphics student participants’ overall performance assessment scores and their VoCATS post-assessment scores.
Presentation and Discussion of Data
The Engineering/Technical Graphics I performance and cognitive (VoCATS) data was examined to uncover variations, differences, and correlations. A scatter plot, (see Figure 1) of VoCATS post-assessment scores and overall performance assessment scores was constructed to provide a visual representation of the array of student achievement for the 157 engineering/technical graphics student participants. The scatter plot of the data does not display a clear linear alignment but does exhibit a concentrated grouping with visibly higher scores on the performance assessments when compared to the VoCATS post assessment.
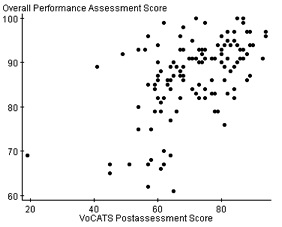
The average of VoCATS post-assessment scores (71.77 of a possible 100) for the 157 engineering/technical graphics student participants is noticeably lower than the performance assessment scores (87 of a possible 100). The variance (149.15) and standard deviation (12.21) of VoCATS post-assessment scores are large in comparison to the variance (70.38) and standard deviation (8.39) of performance assessment scores indicating a larger spread of the engineering/technical graphics student participant scores on VoCATS post assessment. The standard error (0.97) of VoCATS post-assessment scores is greater than the standard error (0.67) of performance assessment scores uncovering a larger fluctuation in score values from participant to participant for the VoCATS post assessment. The medians of VoCATS and performance assessments exhibit minimal deviance from the means of VoCATS and performance assessments suggesting a somewhat symmetrical participant score distribution for both assessments. The range is calculated based on the minimum and maximum scores on the VoCATS and performance assessments. The sizable range (75) on VoCATS assessment in relation to the performance assessment range (39) reiterates the degree of difference in variability of engineering/technical graphics student participants between the two assessments (refer to Table 1).
| Assessment | n | Mean | Variance | Std. Dev. | Std. Err. | Median | Range |
|---|---|---|---|---|---|---|---|
| Vo-CATS | 157 | 71.7707 | 149.1522 | 12.21279 | 0.974687 | 72 | 75 |
| Performance | 157 | 87 | 70.38461 | 8.389554 | 0.669559 | 89 | 39 |
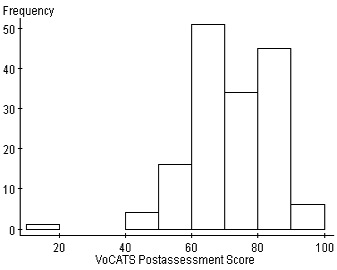
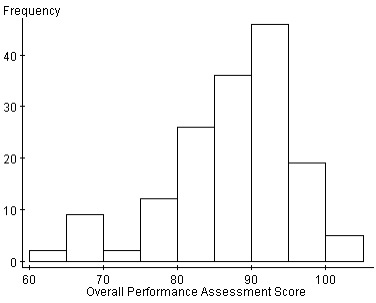
Figure 2 and Figure 3 represent the number of occurrences for VoCATS scores and performance scores for engineering/technical graphics student participants. Both histograms are skewed to the left indicating some upper limit; in this case, the upper limit is the maximum score of 100. A histogram representing a distribution is skewed if one of its tails is extended. A positive skew refers to a histogram that has a distinguishable tail in the positive direction and a negative skew has a distinguishable tail in the negative direction ( Agresti & Finlay, 1997 ). Negative skewness is common in education where examinations are administered after a sequence of learning exercises. The VoCATS histogram exhibits a slightly greater skew than the performance histogram. The enlarged negative skewness of the VoCATS histogram is likely attributed to by the single engineering/technical graphics student participant score of 19 of 100.
A hypothesis test was conducted given the clear differences in means and standard deviations of the engineering/technical graphics participant VoCATS and performance assessments indicated in Table 1. The Z-score was calculated using the following null hypothesis: There are no significant differences in means of the engineering/technical graphics student participants’ overall performance assessment scores and their VoCATS post-assessment scores. Based on analysis of the Z-statistic (12.88) and the proportional value (<0.0001), the null hypothesis is rejected providing evidence that there is a significant difference between the means of the engineering/technical graphics student participants’ overall performance assessment scores and their VoCATS post-assessment scores (refer to Table 2).
| VoCATS (n) | Performance (n) | Sample Mean | Std. Err . | Z-Stat | P-value |
|---|---|---|---|---|---|
| 157 | 157 | 15.23 | 1.18 | 12.88 | <0.0001 |
Table 3 offers an additional hypothesis test that was conducted based on the differences in variances of the engineering/technical graphics participant VoCATS and performance assessment scores indicated in Table 1. The F-statistic was calculated using the following null hypothesis: There are no significant differences in the variances of the engineering/technical graphics student participants’ overall performance assessment scores and their VoCATS post-assessment scores. Based on analysis of the F-statistic (0.47) and the proportional value (<0.0001), the null hypothesis is rejected providing evidence that there is a significant difference between the means of the engineering/technical graphics student participants’ overall performance assessment score variance and VoCATS post-assessment score variance.
A correlation coefficient was calculated (Table 3) between VoCATS and performance assessment scores to show how strongly the cognitive and performance assessments are related. Based on the correlation results (0.5633226) in Table 3, there is evidence that the two assessment scores tend to increase or decrease together, although not in a directly proportional manner.
| VoCATS (n) | Performance (n) | Sample Ratio | F-Stat | P-value | r |
|---|---|---|---|---|---|
| 157 | 157 | 0.47 | 0.4 | -0.0001 | 0.56 |
Conclusions
Decades of research and applied experience have honed the abilities of educational measurement practitioners to develop and implement a number of common assessment procedures ( Williamson & Bauer, 2004 ). Even commonly used standardized testing measures with solid groundings and considerable histories must be constantly revisited. Through revisiting assessment pieces, cognitive or performance-based, measures are refined to more accurately gauge true student competence and ability. Based on significant differences between North Carolina Engineering/Technical Graphics I cognitive and performance assessment results, there is evidence to suggest that standardized assessments be used in conjunction with performance assessments to further provide evaluation of educational and professional standards in CTE. However, there is evidence that the two assessment scores tend to increase or decrease together. Upon further refinement of state assessment procedures, this finding and future findings like this can open the possibility for assimilation of assessment practices given the need for varied assessment for individual and school accountability. Until reliable assessments are developed for each course offering in CTE, existing state and national standardized assessments will continue to be relied on for school accountability and student exit requirements. Further development and implementation of performance-based assessments that require students to exhibit both skills and knowledge is imperative. More research in this area and other areas within CTE is necessary.
Assessment sends a message to students about the enduring concepts and applicable information that should be retained in order to succeed in a discipline. This brings about a new importance of assessment content. If both skill-based performance and cognitive knowledge measure are of equal importance in CTE, this should be reflected in assessment practice. Cognitive and performance assessment should be held in equal regard and should carry equal weight when considering curricular revisions and additions as well as assessment procedures.
Jeremy V. Ernst is an assistant professor in the College of Education at North Carolina State University. He can be reached at Jeremy_ernst@ncsu.edu
References
Agresti, A. & Finlay, B. (1997). Statistical Methods for the Social Sciences (3rd Edition). Upper Saddle River, NJ: Prentice Hall.
Barrow, M. (2006). Assessment and student transformation: Linking character and intellect. Studies in Higher Education. 31 (3), 357-372.
Bracey, G. W. and Resnick, M. A. (1998). Raising the bar: A school board primer on student achievement. Alexandria, Virginia: National School Boards Association. (ED 425 541).
Firestone, W. A. & Schorr, R. Y. (2004). Introduction. In W. A. Firestone, R. Y. Schorr and L. F. Monfils (Eds), The Ambiguity of Teaching to the Test (pp. 1–18). Mahwah, NJ: Lawrence Erlbaum
Haladyna, T. M., Nolen, S. B., & Haas, N. S. (1991). Raising standardized achievement test scores and the origins of test score pollution. Educational Researcher, 20 (5), 2-7.
Kiker, J. (2007). Move beyond “seat time” and narrowly defined knowledge and skills. Techniques. 82 (5), 38-40.
Pell, G. & Roberts, T. E. (2006). Setting standards for student assessment. International Journal of Research and Method in Education. 29 (1), 91-103.
Petterway, A. L. (2006). Statewide standardized assessments and their impact on ESL students. National Forum of Educational Administration and Supervision Journal, 22 (2), 1-4.
Popham, W. J. (2005, April - May). Instructionally insensitive Eutopia. 38-31.
Reeves, T. C., Laffey, J. A., & Marlino, M. R. (1996, April) New approaches to cognitive assessment in engineering education. Paper Presented at the Annual Meeting of the American Educational Research Association, New York, NY, Session 3.32
Willamson, D. M. & Bauer, M. (2004). Design rationale for a complex performance assessment. International Journal of Testing, 4 (4), 303-332.