JOTS v38n2 Student Professional Development: Competency-Based Learning and Assessment
Student Professional Development: Competency-Based Learning and Assessment
Jacqulyn A. Baughman, Thomas J. Brumm, and Steven K. Mickelson
Abstract
This case study examines the implementation of competency-based learning (CBL) and assessment as a measure of student professional development. Students enrolled in an industrial technology undergraduate course at a Midwestern university participated in this study. Based on the degree program outcomes, the “top five” course competencies were identified, and their key action items were assessed using an industry-based, 360-degree assessment process. Significant differences in the average initial and final assessed values were used to determine professional development gains. Findings showed that self-assessed professional gains were achieved, self-assessed results were higher than peer results, and overall peer assessments indicated aggregate gains in professional development. This case study provides a foundational framework for further research studies in competency- based learning and assessment.
Keywords: competencies, professional development, competency-based assessment
Background
Because most college-aged students are entering adulthood, the attitudes, interests, values, and character development that underlie their behaviors may not be at a professional level ( Hayward, Noonan, & Shain, 1999 ). Student development has been described as “the ways that a student grows, progresses, or increases his or her developmental capabilities as a result of enrollment in an institution of higher education” ( Rodgers, 1990 , p. 27), and is about becoming a more complex individual ( McEwen, 2005 ). The complementary theory used to explain and understand student development allows educators to “proactively identify and address student needs, design programs, develop policies, and create healthy environments that encourage positive growth in students” ( Evans, Forney, & Guido-DiBrito, 1998 , p. 5). Existing student development theories are very much interrelated ( Gardner, 2009 ). Psychosocial development theories are concerned with the content of development including growth or change related to how students view themselves and their abilities, the relationships they have with others in their lives, and the future direction of their lives ( Chickering & Reisser, 1993 ). This encompasses adult development and career development ( McEwen, 2005 ).
Competencies are the result of integrative learning experiences in which skills, abilities, and knowledge interact to form learning bundles that have a currency related to the task for which they are assembled; interest in competencies is accelerating throughout the world ( R. Voorhees, 2001 ). Until recently, competencies have been discussed from the demand side of employment, and consideration has been given primarily to the needs of employers. Competency models can be used by the supply side of the labor market as well, such as a learner or student, incumbent worker, or hopeful and expectant new employees applying for a position to achieve job stability ( Ennis, 2008) . Competency-based models enjoy an obvious connection to aspirational student learning statements, because they shift the focus from instructional delivery to student performance ( A. Voorhees, 2001 ). Competency-based learning (CBL) involves redefining program, classroom, and experiential education objectives as competencies or skills and focusing coursework on competency development ( Brumm, Mickelson, Steward, & Kaleita, 2006 ).
Postsecondary education has become progressively responsive to the needs of business and industry, where learning is closely tied to competencies and performance-based assessment of those competencies ( Gardner, 2009 ). Building a bridge between the educational paradigm that depends on traditional credit hour measures of student achievement and the learning revolution can be found in competencybased approaches ( R. Voorhees, 2001 ). These competencies are crucial for students before, during, and after attending postsecondary institutions ( National Center for Education Statistics [NCES], 2002 ). In a 2002 report, the U.S. National Postsecondary Education Cooperative Working Group on Competency-Based Initiatives determined three reasons why it is important to implement competency-based initiatives in colleges and universities:
The definition of workplace competencies is the application of knowledge, skills, attitudes and values, and behaviors ( Ewell, 1984 ). These competencies are directly measurable through actions or demonstrations of the existence of those competencies in the individual. Thus the opportunity to gain practice in the application of competencies and focused reflection in a workplace connects with experiential learning, which is defined as “the process whereby knowledge is created through the transformation of experience and knowledge results from the combination of grasping and transforming experience” ( Kolb, 1984 , p. 41).
Since the 1990s, competencies have become code words for the human resources and strategic management practices of recruiting, selecting, placing, leading, and training employees and evaluating employee performance. Competency-based assessment and feedback has become a predominant workplace reality, which is commonly used as an organizational development tool for the learner ( McCarthy & Garavan, 2001 ). A competency-based assessment tool popularized in the 1980s, mostly as an executive development tool that gained currency in the 1990s, is the multi-rater or 360-degree feedback process (McCarthy amp; Garavan, 2001). The fundamental premise is that data gathered from multiple perspectives are more comprehensive and objective than data gathered from only one source ( Dyer, 2001 ).
Many organizations use some form of the 360-feedback assessment process ( Nowack, 1993 ), and it is implemented in a variety of ways. Ratings from self and others, however, constitute the core of the 360-degree feedback process ( Tornow & London, 1998 ). Self-ratings are the first step to development for the feedback recipient. The value lies in the diversity of information it provides to the feedback recipient and how it is interpreted. It can be perceived as a positive self-development platform, in stark contrast to traditional top-downward evaluation process. Under ideal circumstances, it is used as an assessment for personal development rather than evaluation ( Tornow & London, 1998 ). Widespread in many organizations around the world ( Brutus et al., 2006 ), this process is reportedly used by 90% of Fortune 500 companies in the United States ( Carruthers, 2003 ). The popularity of this practice has stimulated much research enthusiasm in the academic field ( Dai, De Meuse, & Peterson, 2010 ).
Incentivizing Competency-Based Learning
Institutional accountability, articulation and student transfer issues, and workplace market alignment have become critical drivers that can provide the impetus for institutions to shift to competency-based models ( A. Voorhees, 2001 ). Increasingly, accreditation requirements challenge faculty to look ahead to anticipate emerging skills or a change in the emphasis on certain skills that could impact the preparedness of engineers and technology graduates for employability in the knowledge-intensive workplace. Competencies provide students with a clear map and the navigational tools needed to move expeditiously toward their goals ( R. Voorhees, 2001 ). The advantage of competency-based learning (CBL) is that competencies are transparent; that is, all participants in the learning process understand the learning goals and outcomes. Competency expectations have increased significantly across all sectors of the economy, and the abilities employers expect new college graduates to demonstrate the first day on the job have been ratcheted up to an “über level” ( Hanneman & Gardner, 2010 ).
Purpose of the Study
Specifically, the primary purpose of this study was to measure student professional development utilizing an industry-based, 360-degree competency assessment process. An additional goal was the development of a framework for CBL and assessment that can be used in other higher education settings.
The Foundation
Competency-Based Approach to Accreditation
The chosen Midwestern university’s unique approach to accreditation requirements was to address them through development of workplace competencies ( Brumm, Mickelson, et al., 2006 ). Identification of key industry employer needs drove this rationale: “employers of the graduates of our program are increasingly focusing on workplace competencies in their hiring practices, and student development of competencies is, therefore, critical to career success after graduation” ( Brumm, Mickelson, et al., 2006 , p. 1163). Through collaboration with Development Dimensions International, Inc. (DDI), a global provider of competency-based performance management tools and services, 14 unique workplace competencies were developed ( http://learn.ae.iastate.edu/ Competencydefinitions.pdf). These competencies were mapped directly to outcomes of degree programs. Seven, which were regularly mentioned by employers, were identified as “core” competencies. Each competency was defined clearly, concisely, and independently. Specific to each definition, a set of observable and measurable key actions was developed. By closely tying competencies with performance-based assessment of those competencies, a bridge is built between traditional measures of student achievement and competency-based approaches ( R. Voorhees, 2001 ).
Course Connectivity
Competency-based models rely on both the judgment of those external to the learning process and on measurable assessment ( R. Voorhees, 2001 ). A conceptual model of learning based on competencies does not work solely at the level of skill, abilities, and knowledge but seeks to formulate curriculum and assessment at the competency level; this embodies integration of skills, abilities, and knowledge needed to become part of the disciplinary community of practice ( Jones, 2001 ). Competencies have a stronger impact on student learning when they are linked to and embedded within specific courses and across the curriculum ( DDI, 2004 ).
A lean/cellular manufacturing course for senior-level undergraduate students provided the opportunity to design a CBL experience. Based on the instructor’s industry background, professional development based on competency assessment was considered critical to prepare students for success in the workplace environment. The intent of the course design was to provide students the opportunity to “step through the looking glass” and understand the roles competencies and competency assessment play in professional/career development. In this pursuit, all coursework and activities developed were focused on competency development. This chosen Midwestern university’s Industrial Technology assessment plan already contained competency-based learning tools that easily integrated into the course: 14 workplace competencies and a competency assessment format. Based on previous stakeholder assessment feedback, all 14 workplace competencies would not be utilized for the 360-degree process. Thus, a review of the course “core” competency frequency, coupled with the instructor’s 360-degree assessment industry experience, was used to identify the top five course competencies: (a) analysis and judgment, (b) communication, (c) initiative, (d) continuous learning, and (e) teamwork. These top five competencies were the basis for the implementation of the 360-degree assessment process, and they are shown in Table 1.
Method
Twenty-six students enrolled in a lean/cellular manufacturing course in the Industrial Technology program at the Midwestern university that participated in this study. The top five competencies were used for initial and final assessments, of both self and peers, during the semester. Key actions associated with each competency were assessed utilizing the department’s Likert-scale format. These assessment ratings were based on how often a key action was performed, ranging from 1 to 5 with 1 = never or almost never, 2 = seldom, 3 = sometimes, 4 = often, and 5 = always or almost always.
The top five competencies, along with the assessment process, were introduced to students the first day of the course. The students completed an online initial competency self-assessment the first week of class focused on these five competencies. During the second week of class, industry teams were formed, and industry mentors were assigned for the semester’s lean manufacturing project. During the first five weeks, students experienced in-class simulations and other instructional activities involving lean tool applications, including: 5S, value stream mapping, A3, standard work, JIT, and jidoka ( Pascal, 2007 ). At mid-term, student teams presented their lean project progress/status overview, and completed an “initial” online peer/team member assessment. The instructor provided confidential peer feedback to each student the following week. The student lean project teams spent the next five weeks predominantly out of the classroom working on-site with their industry mentors. During the 14th week, final self- and peer-competency assessments were completed. The instructor provided confidential results for peer assessments the following week.
| Competency | Definitions |
|---|---|
| Analysis and Judgment | Identifying and understanding issues, problems, and opportunities;developing the relevant criteria and comparing data from different sources to draw conclusions: using effective approaches for choosing courses of action or developing appropriate solutions; taking actions that are consistent with available facts, constraints, and probably consequences. |
| Communication | Clearly conveying information and ideas through a variety of media to individuals or groups in a manner that engages the audience and helps them understand and retain the message. |
| Initiative | Taking prompt action to accomplish objectives; taking action to achieve goals beyond what is required; being proactive. |
| Continuous Learning | Actively identifying new areas for learning; regularly creating and taking advantage of learning opportunities: using newly gained knowledge and skill on the job, and learning through applications. |
| Teamwork | Effectively participating as a member of a team to move the teamtoward completion of goals. |
| Competency | Key Actions | |
|---|---|---|
| Analysis & Judgment | KA1 | Identifies issues, problems and opportunities. |
| KA2 | Gathers information. | |
| KA3 | Interprets information. | |
| KA4 | Generates alternatives. | |
| KA5 | Chooses appropriate action. | |
| KA6 | Commits to action. | |
| KA7 | Involves others. | |
| KA8 | Values diversity. | |
| Communication | KA1 | Organizes the communication. |
| KA2 | Maintains audience attention. | |
| KA3 | Adjusts to audience. | |
| KA4 | Ensures understanding. | |
| KA5 | Adheres to accepted conventions. | |
| KA6 | Comprehends communication from others. | |
| Initiative | KA1 | Goes above and beyond. |
| KA2 | Responds quickly. | |
| KA3 | Takes independent action. | |
| Continuous Learning | KA1 | Targets learning needs. |
| KA2 | Seeks learning activities. | |
| KA3 | Maximizes learning. | |
| KA4 | Applies knowledge or skill. | |
| KA5 | Takes risks in learning. | |
| Teamwork | KA1 | Facilitates goal accomplishment. |
| KA2 | Informs others on team. | |
| KA3 | Involves others. | |
| KA4 | Models commitment. | |
| Engineering/Technical Knowledge | KA1 | Knowledge of mathematics. |
| KA2 | Knowledge of science. | |
| KA3 | Knowledge of experimental analysis. | |
| KA4 | Knowledge of current engineering/technology tools* | |
| KA5 | Knowledge of technology. |
Results
All initial and final competency assessments were analyzed with SPSS 19 software using paired sample t-testing. The t-test is the optimal data analysis method used to compare the means of paired samples and is recommended for small sample sizes (N < 30). The selfand peer-competency assessments were assigned to all students. One student didn’t complete the initial, and another didn’t complete the final self-assessment. These were not included in the data analysis (N = 24). Definitions of the top five competencies are shown in Table 1. The competencies’ key action items, shown in Table 2, were assessed, and an average value was reported.
Self-Assessment
The average results for key action items within each of the top five competencies, based on the initial and final self-assessments are shown in Figure 1. Additionally, Table 3 provides specific paired t-Test self-assessment results for the key actions (KA). Significant differences (p < .05) are indicated with an asterisk (*). Overall, an increase in final over the initial assessed average value was found in at least one key action (KA) item (*) for each of the five top competencies. These measured average increases serve as an indicator of selfassessed professional development.
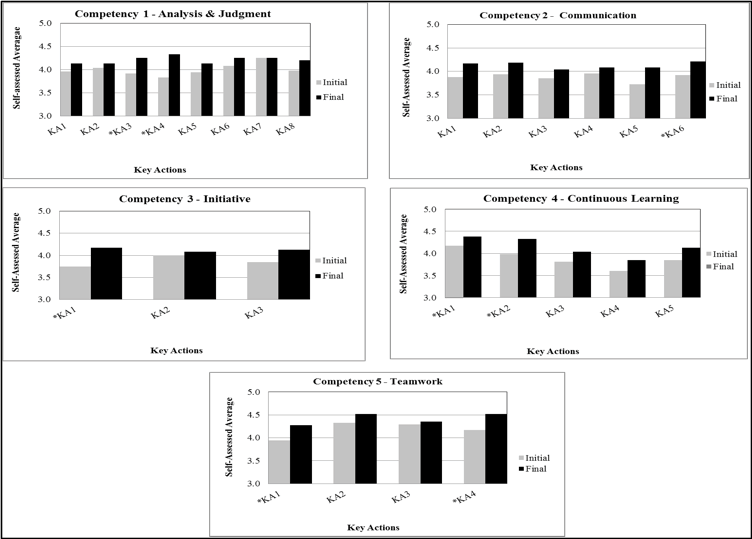
Figure 1. Self-assessed average for five workplace competencies' key actions. (N = 24). *p < .05, two-tailed. Self-assessment average results. The Likert scale used was based on how often a key action was performed, ranging from 1 to 5 with 1 = never or almost never, 2 = seldom, 3 = sometimes, 4 = often, and 5 = always or almost always.
| Competency | Key Action | Assess | M | SD | t | df | r | p |
|---|---|---|---|---|---|---|---|---|
| Note. *p < .05, two-tailed. Assessed average results for each key action (KA) related to the top 5 course competencies. The Likert scaled used for assessment was based on how often a key action was performed, ranging from 1 to 5 with 1 = never or almost never, 2 = seldom, 3 = sometimes, 4 = often, and 5 = always or almost always. | ||||||||
| 1. Analysis & Judgment | ||||||||
| Chooses appropriate action | KA1 | initial | 3.96 | 0.464 | -1.446 | 23 | 0.235 | 0.162 |
| final | 4.13 | 0.448 | ||||||
| Gathers information | KA2 | initial | 4.04 | 0.550 | -0.526 | 23 | -0.018 | 0.604 |
| final | 4.13 | 0.537 | ||||||
| Generates alternatives | KA3 | initial | 3.92 | 0.584 | -2.326 | 23 | 0.306 | 0.029* |
| final | 4.25 | 0.608 | ||||||
| Identifies issues, problems, and opportunities | KA4 | initial | 3.83 | 0.581 | -3.464 | 23 | 0.370 | 0.002* |
| final | 4.33 | 0.670 | ||||||
| Interprets information | KA5 | initial | 3.94 | 0.648 | -0.901 | 23 | -0.308 | 0.377 |
| final | 4.13 | 0.612 | ||||||
| Commits to action | KA6 | initial | 4.08 | 0.654 | -0.089 | 23 | -0.055 | 0.382 |
| final | 4.25 | 0.608 | ||||||
| Involves others | KA7 | initial | 4.25 | 0.590 | 0.000 | 23 | 0.539 | 1.000 |
| final | 4.25 | 0.752 | ||||||
| Valuing diversity | KA8 | initial | 3.98 | 0.651 | -1.394 | 23 | 0.377 | 0.177 |
| final | 4.20 | 0.592 | ||||||
| 2. Communication | ||||||||
| Adheres to accepted conventions | KA1 | initial | 3.88 | 0.680 | -1.664 | 23 | -0.066 | 0.110 |
| final | 4.17 | 0.482 | ||||||
| Adjusts to the audience | KA2 | initial | 3.94 | 0.631 | -1.813 | 23 | 0.241 | 0.830 |
| final | 4.19 | 0.404 | ||||||
| Comprehends communication from others | KA3 | initial | 3.85 | 0.744 | -1.013 | 23 | 0.110 | 0.322 |
| final | 4.04 | 0.606 | ||||||
| Ensures understanding | KA4 | initial | 3.96 | 0.624 | -0.647 | 23 | -0.098 | 0.524 |
| final | 4.08 | 0.654 | ||||||
| Maintains audience attention | KA5 | initial | 3.73 | 0.659 | -1.764 | 23 | -0.094 | 0.910 |
| final | 4.08 | 0.670 | ||||||
| Organizes the Communication | KA6 | initial | 3.92 | 0.637 | -2.299 | 23 | 0.351 | 0.031* |
| final | 4.21 | 0.404 | ||||||
| 3. Initiative | ||||||||
| Goes above and beyond | KA1 | initial | 3.75 | 0.626 | -2.908 | 23 | 0.399 | 0.008* |
| final | 4.17 | 0.654 | ||||||
| Responds quickly | KA2 | initial | 4.00 | 0.643 | -0.558 | 23 | 0.309 | 0.583 |
| final | 4.08 | 0.602 | ||||||
| Takes independent action | KA3 | initial | 3.85 | 0.651 | -1.313 | 23 | -0.245 | 0.202 |
| final | 4.13 | 0.630 | ||||||
| 4. Continuous Learning | ||||||||
| Applies knowledge or skill | KA1 | initial | 4.17 | 0.602 | -1.479 | 23 | 0.292 | 0.015* |
| final | 4.38 | 0.557 | ||||||
| Maximizes learning | KA2 | initial | 3.98 | 0.699 | -2.132 | 23 | 0.260 | 0.044* |
| final | 4.33 | 0.637 | ||||||
| Seeks learning activities | KA3 | initial | 3.81 | 0.548 | -1.326 | 23 | 0.051 | 0.198 |
| final | 4.04 | 0.674 | ||||||
| Takes risks in learning | KA4 | initial | 3.60 | 0.737 | -1.297 | 23 | 0.118 | 0.207 |
| final | 3.85 | 0.683 | ||||||
| Targets learning needs | KA5 | initial | 3.85 | 0.744 | -1.556 | 23 | 0.119 | 0.133 |
| final | 4.13 | 0.540 | ||||||
| 5. Teamwork | ||||||||
| Facilitates goal accomplishment | KA1 | initial | 3.94 | 0.558 | -2.563 | 23 | 0.316 | 0.017* |
| final | 4.27 | 0.531 | ||||||
| Informs others on team | KA2 | initial | 4.33 | 0.545 | -1.334 | 23 | 0.252 | 0.195 |
| final | 4.52 | 0.580 | ||||||
| Involves others | KA3 | initial | 4.29 | 0.550 | -0.514 | 23 | 0.501 | 0.612 |
| final | 4.35 | 0.634 | ||||||
Self- vs. Peer Assessments
A comparison of the results for the key actions between all self- and peer assessments is shown in Figures 2 and 3, respectively. In the initial assessment, significant differences (*) were detected in specific key action items in two of the five competencies (analysis and judgment, and teamwork), between self and peer results. In all cases, the self-assessed average results were higher than peer-assessed average results. In the final assessment results, significant differences in specific key action item averages were also found for two of the five competencies (initial and teamwork). Once again, self-assessed average values were higher than peer-assessed average values. Results indicate that for both the initial and final assessments, KA2 in the teamwork competency was the significant difference commonality. Additionally, Table 4 provides specific paired t-Test self-assessment results for the key actions (KA). Significant differences (p < .05) are indicated with an asterisk (*).
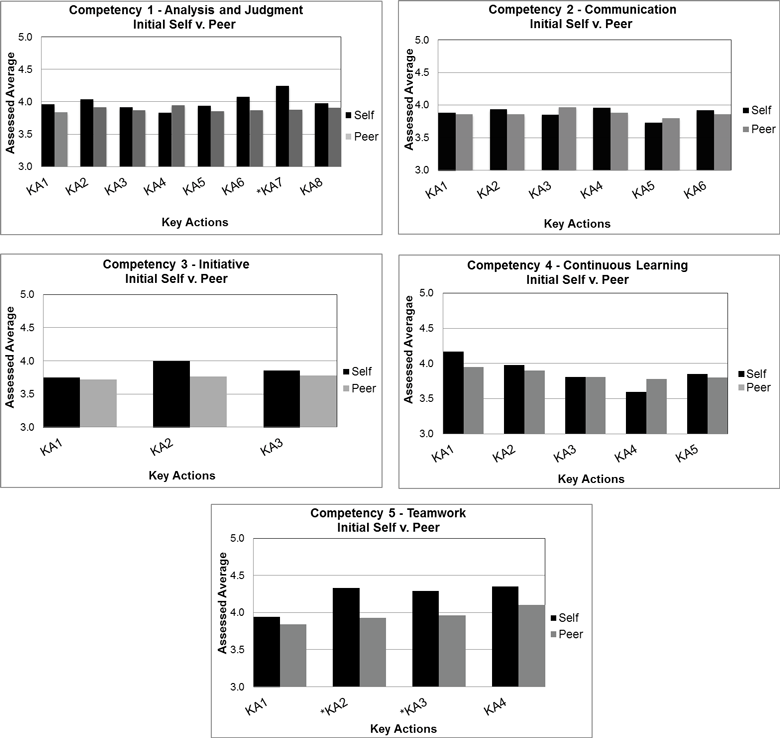
Figure 2. Initial self- vs. peer-assessed average ranking for key actions. (N = 24). *p < .05. The Likert scale used was based on how often a key action was performed, ranging from 1 to 5 with 1 = never or almost never, 2 = seldom, 4 = often, and 5 = always or almost always.
Peer Assessments
The average results for key action items contained within each of the top five competencies for the initial and final peer assessments are shown in Figure 4, with significant differences (p < .05) indicated with an asterisk (*). Overall, in four of the five competencies, significant differences (*) in the average assessed value were found in at least one key action item. These key action items experienced an increased average value in the final average assessed value over the initial. As a peer assessment/student aggregate, this measured increase serves as an indication of professional growth over the semester.
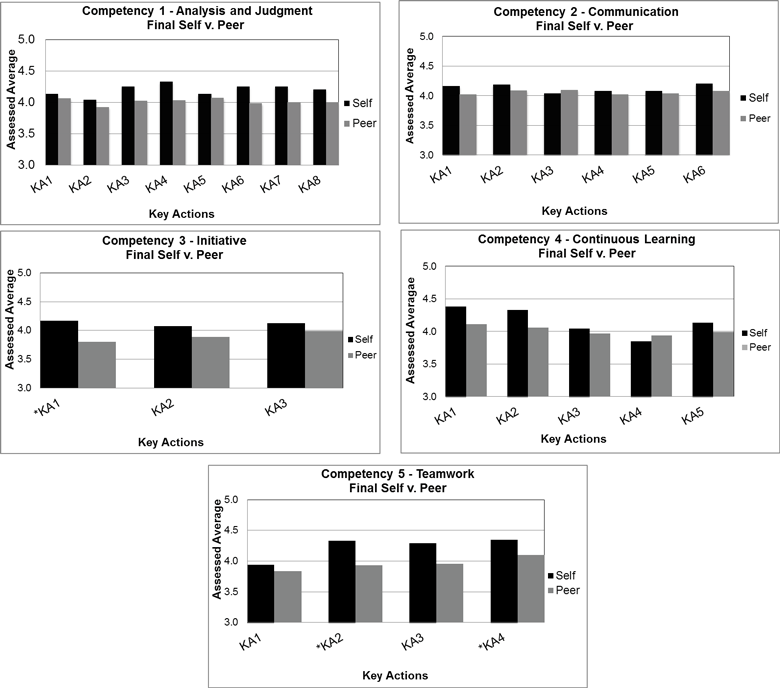
Figure 3. Final self- vs. peer-assessed average rankings for key actions (N = 24) *p < .05. The Likert scale used was based on how often a key action was performed, ranging from 1 to 5 with 1 = never or almost never, 2 = seldom, 4 = often, and 5 = always or almost always.
Findings
A 360-degree assessment process was implemented into an undergraduate course utilizing the department’s competency assessment format. Key action items associated with the top five course competencies were assessed. The self-assessment results showed higher final average assessed values in at least one key action item for each of the five competencies. No commonalities in the key action items between the initial and final self-assessment results were observed. The measured increases in key action final average results indicated self-perceived professional gains achieved (Figure 1). The comparison of self- v. peer-assessment results showed two commonalities:
- Higher average values were all detected in the self-assessments, and
- Teamwork competency: KA2 showed higher self-assessed values in both the initial and final assessments (Figures 2 and 3).
The overall peer-assessment results showed higher average final results in at least one key action item for each of the five course competencies (Figure 4).
Discussion and Conclusions
The results are indicative of the complex task of comparing self-perception to others, which involves social information processing and interpersonal insight ( London, 1994 ). Psychological mechanisms related to how we operate in social environments may become impediments to accurate self-assessment. In this study, significant differences detected in comparing self-assessments v. peer assessments showed self-assessments with higher average values. As Tornow (1993) found, self-assessments are, on average, higher than others, including peers. Although peer ratings often tend to be far lower than self-ratings, they are fast becoming one of the most valued sources of appraisal as opposed to the usual supervisor ratings ( McCarthy & Garavan, 2001 ). According to Jones and Bearley (1996) , this is a direct consequence of an organization’s increased focus on self-managed work teams and flatter structures. Peer feedback provides insight into how one behaves in team situations; it also explains the influencing behaviors that serve to gain commitments when no direct authority can be exercised ( Lepsinger & Lucia, 1997 ). Classroom research has demonstrated reasonable agreement between self- and peer ratings ( McGourty, Dominick, Besterfield-Sacre, Shuman, & Wolfe, 2000 ), and correlations ranging from 0.12 to 0.39 ( Reilly, 1996 ) have been reported. Correlations results found in this study ranged from –0.429 to 0.534 for the initial self- vs. peer assessments and from –0.394 to 0.354 for the final assessments. Researchers have suggested that low agreement may be due to real behavioral or skill differences in the target student as perceived by sources with different perspectives such as fellow students ( Tornow, 1993 ).
| Competency | Key Actions | Assess | Mself | Mpeer | t | df | r | p |
|---|---|---|---|---|---|---|---|---|
| Note. *p < .05, two-tailed. Assessed average results for each key action (KA) related to the top 5 course competencies. The Likert scaled used for assessment was based on how often a key action was performed, ranging from 1 to 5 with 1 = never or almost never, 2 = seldom, 3 = sometimes, 4 = often, and 5 = always or almost always. | ||||||||
| 1. Analysis & Judgment | ||||||||
| Chooses appropriate action | KA1 | initial | 3.96 | 3.84 | 1.633 | 23 | 0.534 | 0.116 |
| final | 4.13 | 4.06 | 0.677 | -0.243 | 0.505 | |||
| Gathers information | KA2 | initial | 4.04 | 3.92 | 1.136 | 23 | -0.054 | 0.268 |
| final | 4.13 | 4.06 | 0.748 | 0.052 | 0.462 | |||
| Generates alternatives | KA3 | initial | 3.92 | 3.87 | 0.655 | 23 | 0.208 | 0.519 |
| final | 4.25 | 4.02 | 1.875 | 0.040 | 0.074 | |||
| Identifies issues, problems, and opportunities | KA4 | initial | 3.83 | 3.95 | -0.703 | 23 | 0.091 | 0.489 |
| final | 4.33 | 4.03 | 1.976 | 0.033 | 0.060 | |||
| Interprets information | KA5 | initial | 3.94 | 3.86 | 0.628 | 23 | 0.160 | 0.536 |
| final | 4.13 | 4.07 | 0.542 | 0.254 | 0.593 | |||
| Commits to action | KA6 | initial | 4.08 | 3.87 | 1.724 | 23 | 0.188 | 0.098 |
| final | 4.25 | 3.98 | 1.777 | -0.055 | 0.089 | |||
| Involves others | KA7 | initial | 4.25 | 3.88 | 3.037 | 23 | 0.018 | 0.006* |
| final | 4.25 | 4.00 | 1.474 | -0.027 | 0.154 | |||
| Valuing diversity | KA8 | initial | 3.98 | 3.91 | 0.601 | 23 | 0.238 | 0.554 |
| final | 4.20 | 4.00 | 1.595 | 0.354 | 0.125 | |||
| 2. Communication | ||||||||
| Adheres to accepted conventions | KA1 | initial | 3.88 | 3.86 | 0.256 | 23 | -0.043 | 0.800 |
| final | 4.17 | 4.02 | 1.245 | 0.044 | 0.226 | |||
| Adjusts to the audience | KA2 | initial | 3.94 | 3.86 | 0.465 | 23 | -0.262 | 0.647 |
| final | 4.19 | 4.09 | 1.169 | 0.166 | 0.254 | |||
| Comprehends communication from others | KA3 | initial | 3.85 | 3.97 | -0.593 | 23 | 0.064 | 0.559 |
| final | 4.04 | 4.10 | -0.134 | 0.064 | 0.895 | |||
| Ensures understanding | KA4 | initial | 3.96 | 3.88 | 0.685 | 23 | 0.056 | 0.500 |
| final | 4.08 | 4.02 | 0.571 | 0.038 | 0.573 | |||
| Maintains audience attention | KA5 | initial | 3.73 | 3.80 | -0.363 | 23 | -0.105 | 0.720 |
| final | 4.08 | 4.04 | 0.447 | -0.030 | 0.659 | |||
| Organizes the Communication | KA6 | initial | 3.92 | 3.86 | 0.602 | 23 | 0.028 | 0.553 |
| final | 4.21 | 4.08 | 1.479 | 0.262 | 0.153 | |||
| 3. Initiative | ||||||||
| Goes above and beyond | KA1 | initial | 3.75 | 3.72 | 0.392 | 23 | 0.211 | 0.699 |
| final | 4.17 | 3.80 | 2.295 | 0.097 | 0.031* | |||
| Responds quickly | KA2 | initial | 4.00 | 3.76 | 1.747 | 23 | -0.129 | 0.094 |
| final | 4.08 | 3.89 | 1.425 | 0.143 | 0.168 | |||
| Takes independent action | KA3 | initial | 3.85 | 3.78 | 0.617 | 23 | -0.174 | 0.544 |
| final | 4.13 | 3.99 | 0.984 | 0.074 | 0.335 | |||
| 4. Continuous Learning | ||||||||
| Applies knowledge or skill | KA1 | initial | 4.17 | 3.95 | 1.736 | 23 | -0.121 | 0.096 |
| final | 4.38 | 4.11 | 1.684 | -0.245 | 0.106 | |||
| Maximizes learning | KA2 | initial | 3.98 | 3.90 | 0.517 | 23 | -0.243 | 0.610 |
| final | 4.33 | 4.06 | 1.559 | -0.396 | 0.133 | |||
| Seeks learning activities | KA3 | initial | 3.81 | 3.81 | 0.194 | 23 | -0.089 | 0.848 |
| final | 4.04 | 3.97 | 0.536 | 0.023 | 0.597 | |||
| Takes risks in learning | KA4 | initial | 3.60 | 3.78 | -0.999 | 23 | -0.099 | 0.328 |
| final | 3.85 | 3.94 | -0.336 | -0.036 | 0.740 | |||
| Targets learning needs | KA5 | initial | 3.85 | 3.80 | 0.391 | 23 | -0.420 | 0.699 |
| final | 4.13 | 3.99 | 1.215 | 0.116 | 0.237 | |||
| 5.Teamwork | ||||||||
| Facilitates goal accomplishment | KA1 | initial | 3.94 | 3.84 | 0.761 | 23 | -0.283 | 0.454 |
| final | 4.27 | 4.07 | 1.521 | -0.185 | 0.142 | |||
| Informs others on team | KA2 | initial | 4.33 | 3.93 | 3.328 | 23 | -0.047 | 0.003* |
| final | 4.52 | 4.07 | 3.040 | 0.066 | 0.006* | |||
| Involves others | KA3 | initial | 4.29 | 3.96 | 2.876 | 23 | 0.131 | 0.009* |
| final | 4.35 | 4.10 | 1.985 | 0.283 | 0.059 | |||
| Models commitment | KA4 | initial | 4.17 | 4.23 | -0.071 | 23 | -0.264 | 0.944 |
| final | 4.52 | 4.01 | 3.112 | 0.091 | 0.005* | |||
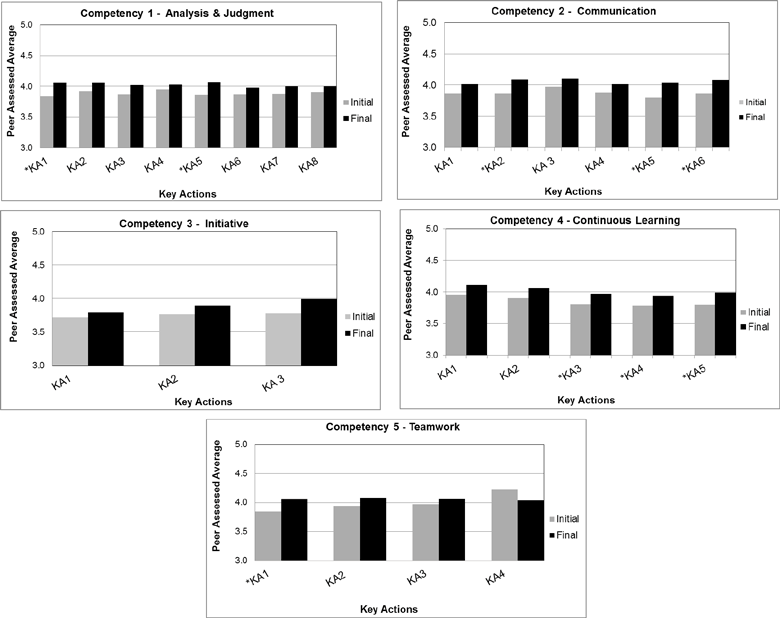
Figure 4. Peer-assessed average ranking for key actions (N = 24) *p < .05. Assessed average results for each key action (KA) related to the top 5 course competencies. The Likert scale used for assessment was based on how often a key action was performed, ranging from 1 to 5 with 1 = never or almost never, 2 = seldom, 3 = sometimes, 4 = often, and 5 = always or almost always.
This case study was limited to the assessment of the top five workplace competencies determined for one course, one semester (16 weeks), and small sample size (N = 24). A great deal of research has been directed at the relationship between individual characteristics and rating tendencies; research has focused on characteristics of the raters, the ratee, or both. These characteristics were not the central focus of this study. Additionally, self- and peer evaluations are not entirely free of bias, also not addressed in this study. Rather, the focus was to determine if competency assessment could be implemented into the classroom to measure and detect evidence of perceived student professional development.
The value of competency assessment as a measure both in this study and in industry is that it provides input that can be utilized into professional self-development efforts. This study provided a framework for competency-based learning and assessment that can be utilized in a higher education environment. Despite its limitations, the implications for future research are evident. More studies are needed to collect and analyze data regarding competency-based learning and the use of multisource/360-degree assessments to measure student professional development in an educational setting. It gives us an inkling of the possibilities and impact that future studies can provide, not only to improve our approach to student assessment, but also in curricular improvement efforts that better prepare students for their professional endeavors.
| Competency | Key Actions | Assess | M | SD | t | df | r | p |
|---|---|---|---|---|---|---|---|---|
| Note. *p < .05, two-tailed. Assessed average results for each key action (KA) related to the top 5 course competencies. The Likert scaled used for assessment was based on how often a key action was performed, ranging from 1 to 5 with 1 = never or almost never, 2 = seldom, 3 = sometimes, 4 = often, and 5 = always or almost always. | ||||||||
| 1. Analysis & Judgment | ||||||||
| Chooses appropriate action | KA1 | initial | 3.84 | 0.371 | -2.652 | 23 | 0.509 | 0.014* |
| final | 4.06 | 0.461 | ||||||
| Gathers information | KA2 | initial | 3.92 | 0.288 | -1.562 | 23 | 0.467 | 0.131 |
| final | 4.06 | 0.514 | ||||||
| Generates alternatives | KA3 | initial | 3.87 | 0.327 | -1.059 | 23 | 0.259 | 0.300 |
| final | 4.02 | 0.503 | ||||||
| Identifies issues, problems, and opportunities | KA4 | initial | 3.95 | 0.377 | -1.028 | 23 | 0.664 | 0.314 |
| final | 4.03 | 0.535 | ||||||
| Interprets information | KA5 | initial | 3.86 | 0.338 | -2.452 | 23 | 0.571 | 0.022* |
| final | 4.07 | 0.521 | ||||||
| Commits to action | KA6 | initial | 3.87 | 0.336 | -0.998 | 23 | 0.307 | 0.328 |
| final | 3.98 | 0.584 | ||||||
| Involves others | KA7 | initial | 3.88 | 0.330 | -1.319 | 23 | 0.553 | 0.199 |
| final | 4.00 | 0.581 | ||||||
| Valuing diversity | KA8 | initial | 3.91 | 0.394 | -0.780 | 23 | 0.412 | 0.433 |
| final | 4.00 | 0.577 | ||||||
| 2. Communication | ||||||||
| Adheres to accepted conventions | KA1 | initial | 3.86 | 0.459 | -1.652 | 23 | 0.468 | 0.111 |
| final | 4.02 | 0.494 | ||||||
| Adjusts to the audience | KA2 | initial | 3.86 | 0.373 | -3.037 | 23 | 0.617 | 0.006* |
| final | 4.09 | 0.048 | ||||||
| Comprehends communication from others | KA3 | initial | 3.97 | 0.329 | -1.528 | 23 | 0.578 | 0.139 |
| final | 4.10 | 0.524 | ||||||
| Ensures understanding | KA4 | initial | 3.88 | 0.303 | -1.810 | 23 | 0.542 | 0.082 |
| final | 4.02 | 0.457 | ||||||
| Maintains audience attention | KA5 | initial | 3.80 | 0.337 | -2.732 | 23 | 0.45 | 0.011* |
| final | 4.04 | 0.465 | ||||||
| Organizes the Communication | KA6 | initial | 3.86 | 0.350 | -2.706 | 23 | 0.62 | 0.012* |
| final | 4.08 | 0.528 | ||||||
| 3. Initiative | ||||||||
| Goes above and beyond | KA1 | initial | 3.72 | 0.364 | -0.606 | 23 | 0.424 | 0.550 |
| final | 3.80 | 0.692 | ||||||
| Responds quickly | KA2 | initial | 3.76 | 0.429 | -0.943 | 23 | 0.266 | 0.355 |
| final | 3.89 | 0.670 | ||||||
| Takes independent action | KA3 | initial | 3.78 | 0.374 | -1.728 | 23 | 0.156 | 0.096 |
| final | 3.99 | 0.534 | ||||||
| 4. Continuous Learning | ||||||||
| Applies knowledge or skill | KA1 | initial | 3.95 | 0.183 | -1.614 | 23 | 0.104 | 0.119 |
| final | 4.11 | 0.513 | ||||||
| Maximizes learning | KA2 | initial | 3.90 | 0.309 | -1.700 | 23 | 0.438 | 0.101 |
| final | 4.06 | 0.538 | ||||||
| Seeks learning activities | KA3 | initial | 3.81 | 0.395 | -2.064 | 23 | 0.614 | 0.049* |
| final | 3.97 | 0.048 | ||||||
| Takes risks in learning | KA4 | initial | 3.78 | 0.273 | -2.101 | 23 | 0.53 | 0.046* |
| final | 3.94 | 0.439 | ||||||
| Targets learning needs | KA5 | initial | 3.80 | 0.260 | -2.080 | 23 | 0.406 | 0.048* |
| final | 3.99 | 0.504 | ||||||
| 5.Teamwork | ||||||||
| Facilitates goal accomplishment | KA1 | initial | 3.84 | 0.415 | -2.830 | 23 | 0.536 | 0.009* |
| final | 4.07 | 0.463 | ||||||
| Informs others on team | KA2 | initial | 3.93 | 0.035 | -1.311 | 23 | 0.428 | 0.202 |
| final | 4.07 | 0.584 | ||||||
| Involves others | KA3 | initial | 3.96 | 0.033 | -1.227 | 23 | 0.335 | 0.213 |
| final | 4.10 | 0.592 | ||||||
| Models commitment | KA4 | initial | 4.23 | 0.487 | 1.874 | 23 | 0.482 | 0.073 |
| final | 4.01 | 0.665 | ||||||
Dr. Jacqulyn A. Baughman is a Lecturer in the Department of Ag & Biosystems Engineering, and Director of Graduate Education for the Biorenewable Resources and Technology Graduate Program at Iowa State University, Ames. She is a member of the Alpha Xi chapter of Epsilon Pi Tau.
Dr. Thomas J. Brumm is an Associate Professor in the Department of Ag & Biosystems Engineering, Director of Assessment for the College of Engineering, and Professor-in-Charge of Engineering-LAS Online Learning at Iowa State University, Ames. He is a member of the Alpha Xi chapter of Epsilon Pi Tau.
Dr. Steven K. Mickelson is the Charles R. & Jane F. Olsen Professor of Engineering and Chair of the Ag & Biosystems Engineering Department at Iowa State University, Ames.
References
Brumm, T., Mickelson, S., Steward, B., & Kaleita, A. (2006). Competency-based outcomes assessment for agricultural engineering programs. International Journal of Engineering Education, 22 (6), 1163–1172.
Brutus, S., Derayeh, M., Fletcher, C., Bailey, C., Velazques, P., Shi, K., Labath, V. (2006). Internationalization of multi-source feedback systems: A six country exploratory analysis of 360-degreee feedback. International Journal of Human Resource Management, 18 , 1888–1906.
Carruthers, F. (2003). Nothing but the truth. Australian Financial Review , 78.
Chickering, A., & Reisser, L. (1993). Education and identity (2nd ed.). San Francisco: Jossey-Bass.
Dai, G., De Meuse, K., & Peterson, C. (2010). Impact of multi-source feedback on leadership competency development: A longitudinal field study. Journal of Managerial Issues 22 , 197–219.
Development Dimensions International [DDI]. (2004). Retrieved on January 30, 2012, from http://www.ddiworld.com
Dyer, K. (2001). The power of 360-degree feedback. Educational Leadership, 5 , 35–38.
Ennis, M. (2008). Competency models: A review of the literature and the role of the employment and training administration (ETA) . Pilots and Demonstration Team, Division of Research and Evaluation, Office of Policy Development and Research Employment and Training Administration: U.S. Department of Labor.
Evans, N. J., Forney, D. S., & Guido-DiBrito, F. (1998). Student development in college: Theory, research, and practice . San Francisco: Jossey-Bass.
Ewell, P. (1984). The self-regarding institution; information for excellence . National Center for Higher Education Management Systems. Boulder, Colorado, pp. 45–57.
Gardner, S. K. (2009). Student development theory: A primer. ASHE Higher Education Report, 34 (6), 15–28.
Hanneman, L., & Gardner, P. (2010). CERI research brief 1-2010: Under the economic turmoil a skills gap simmers . Collegiate Employment Research Institute, Michigan State University. Retrieved August 1, 2011, from http://www.ceri.msu.edu
Hayward, L., & Blackmer, B. (2007). A 360-degree assessment model for integrating technical and professional skills to facilitate successful workplace transition . Retrieved from http://www.naceweb.org/foundation/done/360degree/?referal=
Hayward, L., Noonan, A., & Shain, D. (1999). Qualitative case study of physical therapist students’ attitudes, motivations, and affective behaviors. JAH, 28 (3), 155–164.
Jones, E. (2001). Working in partnership with faculty to transform undergraduate curricula. New Directions for Institutional Research, (110) , 15–27.
Jones, J., & Bearley, W. (1996). 360-degree feedback: Strategies, tactics and techniques for developing leaders . Minneapolis: Lakewood Publications.
Kolb, D. (1984). Experiential learning: Experience as the source of learning and development . Englewood Cliffs, NJ: Prentice-Hall.
Lepsinger, R., & Lucia, A. (1997). The art and science of 360-degree feedback . San Francisco: Jossey-Bass
London, M. (1994). Interpersonal insight into organizations: Cognitive models for human resource development. Human Resource Management Review, 4 , 311–332.
McCarthy, A., & Garavan, T. (2001). 360 [degrees] feedback process: Performance, improvement and employee career development. Journal of European Industrial Training, 25 (1), 5–32. Retrieved
August 1, 2011, from ABI/INFORM Global. (Document ID: 115923735).McEwen, M. K. (2005). The nature and uses of theory. In M. E. Wilson & L. Wolf-Wendel (Eds.), ASHE reader on college student development theory (pp. 5–24). Boston: Pearson Custom Publishing.
McGourty, J., Dominick, P., Besterfield-Sacre, M., Shuman, L., & Wolfe, H. (2000). Improving student learning through the use of multisource assessment and feedback. 30th ASEE/IEEE Frontiers in Education Conference. October 18–21, 2000, Kansas City, MO.
National Center for Education Statistics [NCES]. (2002). Defining and assessing learning: Exploring competency-based initiatives, NCES 2002-159 . The Council of the National Postsecondary Education Cooperative Working Group on Competency-Based Initiatives. Washington, DC: U.S. Department of Education.
Nowack, K. M. (1993). 360-degree feedback: The whole story. Training & Development, 47 (1), 69. Retrieved September 5, 2011, from ABI/INFORM Global. (Document ID: 818982).
Pascal, D. (2007). Lean production simplified: A plain-language guide to the world’s most powerful production system (2nd ed.). Boca Raton, FL: CRC Press, Taylor & Francis Group.
Reilly, R. (1996). Team feedback . Presented at the 11th Annual Conf. Society for Industrial and Organizational Psychology, San Diego, CA, 1996.
Rodgers, R. F. (1990). Recent theories and research underlying student development. In D. Creamer & Associates (Eds.), College student development: Theory and practice for the 1990s (pp. 27–79). Alexandria, VA: American College Personnel Association.
Tornow, W. (1993). Perspective or reality? Is multi-perspective measurement a means or an end? Human Resources Management, 32 , 221–229.
Tornow, W., & London, M. (1998). Maximizing the value of 360-degree feedback: A process for successful individual and organizational development . San Francisco: Jossey-Bass.
Voorhees, A. (2001). Creating and implementing competency learning models. New Directions for Institutional Research, 2001 (110), 83–95.
Voorhees, R. (2001). Competency-based learning models: A necessary future. New Directions for Institutional Research, 2001 (110), 5–13.