JSTE v48n2 - High School Engineering and Technology Education Integration through Design Challenges
High School Engineering and Technology Education Integration through Design Challenges
Nathan Mentzer
Purdue University
Abstract
This study contextualized the use of the engineering design process by providing descriptions of how each element in a design process was integrated in an eleventh grade industry and engineering systems course. The guiding research question for this inquiry was: How do students engage in the engineering design process in a course where technology and engineering intersect? Data to address this question were collected during six weeks of observation and discussions with students at a suburban high school of 1500 students. Additional data were obtained from student and teacher generated documents, such as lesson plans, handouts, student journals, reports and presentations.
This study assumed six critical elements of engineering design: problem definition, development of solutions, analysis/modeling, experimentation, decision making and teamwork. These six elements of an iterative process were derived from a review of engineering design literature and became a lens through which the classroom learning experiences were viewed.
Evident in the observations was the theme of student transition from teacher driven problems with narrow boundaries, to student driven problem definition with wide boundaries. In this research, projects started as small individual activities early in the fall term. As the semester progressed, projects became more complex, and a necessity for teamwork emerged. Each activity in the fall provided students with experience and skills in areas of engineering design and material fabrication. This preparation provided a conceptual and practical foundation for the open-ended spring design challenge.
Introduction
Technological literacy is an important educational goal for all high school students ( International Technology Education Association, 2000 ). Scholars in technology education and engineering disciplines, as well as the general public, have expressed the need for technological literacy and asserted that our K-12 educational system must address the issue ( Gamire & Pearson, 2006 ; Gorham, 2002 ; International Technology Education Association, 1996 , 2000 ; Pearson & Young, 2002 ). The impacts of decisions related to technologies are complex; the ability to make thoughtful decisions regarding the relationship between society and technology is essential for our nation’s continued economic prosperity ( Pearson & Young, 2002 ).
Though a need for a technologically literate citizenry is evident, many people do not possess the literacy to make informed decisions about technology. The ability for consumers, as well as business and political leaders, to weigh the impacts and implications of their decisions regarding the use and development of technologies is essential but currently insufficient ( Pearson & Young, 2002 ).
Engineering and engineering design are included in Standards for Technological Literacy ( International Technology Education Association, 2000 ). Including engineering content in technology education curricula demands the field identify opportunities and approaches to teaching engineering at the high school level. Engineering design challenges include the application of engineering principles to solve real-world problems with an active, hands-on methodology. Incorporating engineering design challenges in formal coursework is one approach to teaching the engineering process through practical application. “In brief, available research suggests that these kinds of courses appear to improve retention, student satisfaction, diversity, and student learning” ( Dym, Agogino, Eris, Frey, & Leifer, 2005 , p. 114).
Purpose of the Study
The purpose of this case study was to identify evidence of the engineering design process in a high school technology education classroom using naturalistic inquiry. The guiding research question for this inquiry was: How do students engage in the engineering design process in courses where technology and engineering intersect? Data to address this question were collected during six weeks of observation and discussion with students at a suburban high school of 1500 students. Field notes were compiled by the author during five extended visits spanning an academic year. Additional data were obtained from student and teacher generated documents, such as lesson plans, handouts, student journals, reports and presentations. The fall semester provided students with a series of small structured design challenges to contextualize engineering concepts in hands-on activities and to prepare them to approach an open ended large scale design project during the spring semester.
Technological Literacy Includes an Understanding of Engineering
The role of engineering in developing technological literacy was established in the Standards for Technological Literacy . The International Technology and Engineering Educators Association has identified 20 standards for facilitating the development of technological literacy. Standard number nine reads, “Students will develop an understanding of engineering design” ( International Technology Education Association, 2000 , p. 210). Gorham and colleagues (2003) described a synergistic relationship between engineering and technology education toward a common goal of technological literacy, suggesting that the Engineering Criteria 2000 ( Engineering Accreditation Commission of the Accreditation Board for Engineering and Technology Inc., 2001 ) and Standards for Technological Literacy show “clear connections” (p. 97).
As suggested by Hailey, Erekson, Becker, and Thomas (2005) , “The design process described in [the Standards for Technological Literacy ] Standard 8 is very similar to the introductory engineering design process described in freshman engineering design texts with two notable exceptions” (p. 24).
The first highlighted difference shows the role of analysis in introductory engineering design compared with Standard 8, which prescribes selecting an approach, making a model or prototype, and testing the approach. Engineering programs teach analysis as the decision making tool for evaluating a set of design alternatives, where ‘analysis’ means the analytical solution of a problem using mathematics and principles of science.
The second highlighted difference shows the importance of creating or making the designs, as prescribed by Standard 8, in contrast with the introductory engineering design process, which prescribes that students develop ‘design specifications’ so someone can create the design, not necessarily the engineer or engineering student. (pp. 24-25)
Lewis (2005) suggested that one method of integrating engineering and technology education is through the use of design challenges. This recommendation corroborated the position of Gorham, Newberry, and Bickart (2003) , who held that a synergistic relationship is evident between the fields. Technology educators often pose design challenges to students in their classes. As students progress through the technology education design model, the addition of analysis to this procedure might facilitate the integration of engineering design. Lewis commented:
Design appropriate for technology education is characterized by open-ended problems where the designer bridges the gap between past experiences and the current problem to be solved; one method of achieving this transition is through engineering design challenges. (p. 49)
Characteristics of Engineering Design
Design is recognized as the critical element of engineering thinking which differentiates engineering from other problem solving approaches ( Dym, 1999 ). The definition of engineering design has been established by the Accreditation Board for Engineering and Technology (ABET) (2007) :
Engineering design is the process of devising a system, component, or process to meet desired needs. It is a decision-making process (often iterative), in which the basic sciences, mathematics, and the engineering sciences are applied to convert resources optimally to meet these stated needs. (p. 21)
Smith (2000) surveyed the teaching of engineering design to first and second year students in a reflective column in the Journal of Engineering Education . Smith highlighted several texts which articulate engineering design on a level appropriate for early design experiences. Introduction to Engineering Design , by Eide, Jenison, Mashaw, and Northup (2001) was among the noteworthy texts. It is generally congruent with other introductory college level texts describing the engineering design process for engineering students ( Dym & Little, 2004 ; Eide, Jenison, Mashaw, & Northup, 1998 ; Eide, Jenison, Northup, & Mickelson, 2008 ; Moore, Atman, Bursic, Shuman, & Gottfried, 1995 ). Table 1 displays the design process as synthesized from the literature and employed in the current study. The six main elements are described generally as follows:
Problem Definition . Problem definition includes addressing well-defined and ill-defined questions, as stated by Dym and others (2005) :
No sooner has a client or professor defined a series of objectives for a designed artifact than the designers—whether in a real design studio or in a classroom—want to know what the client really wants. What is a safe product? What do you mean cheap? How do you define the best? (p. 104)
As part of defining the problem, a clear view of the need must be articulated in association with identifying the constraints governing the problem. This clear view of the problem and its boundaries is well articulated in the literature and these two design models.
Solutions . Multiple solutions are identified through two intertwined approaches: researching existing solutions and brainstorming alternative solutions. Strong design teams gather information from multiple sources, judge its quality, and document their efforts ( Davis, Gentili, Trevisan, & Calkins, 2002 ).
| Element | Characteristics |
|---|---|
| Problem definition | Questioning |
| Constraints | |
| Component/system level | |
| Evaluation criteria | |
| Solutions | Research existing |
| Brainstorm alternative | |
| Analysis/modeling | Prediction |
| Uncertainty | |
| Estimation | |
| Experimentation | Empirical data gathering |
| Based on analysis | |
| Prototyping | |
| Decision making | Evaluation of potential solutions |
| Optimizing | |
| Teamwork | Working effectively on teams |
| Communications |
Analysis/Modeling . “Mathematical or analytical models used to express some aspect of an artifact’s function or behavior, where the behavior is in turn often derived from some physical principle(s)” ( Dym, et al., 2005 , p. 108). This analysis should consider technical, financial, system, life-cycle, and potential failure ( Davis, et al., 2002 ). Modeling approaches are limited and incomplete at times, and, therefore, statistical tools should be considered to further understanding of the phenomenon. Estimation may be used since systems are complex, and modeling every aspect of the behavior is not always practical ( Dym, et al., 2005 , p. 106).
Experimentation . Experimentation is guided by analysis and modeling for purposes of validating the model and providing empirical evidence where data is insufficient. “The design of systems is rarely accomplished exclusively by applying fundamental scientific principles. In most cases, the design of systems also requires some use of empirical data and experimentation” ( Dym, et al., 2005 , p. 106). An interactive relationship between experimentation and modeling serves to guide the development of understanding and design progression ( Box & Liu, 1999 ).
Decision Making . “[D]esign is a rational process of choosing among alternatives” ( Dym, et al., 2005 , p. 107). A decision matrix helps assist students in objectively considering the alternatives based on their advantages and disadvantages ( Gomez, Oaks, & Leone, 2004 ). Quality design decisions involve full team participation and consensus, and an optimized solution based on iteration and refinement ( Davis, et al., 2002 ).
Teamwork/Communications . ABET criterion 3(d) articulated a need for students to function on a multidisciplinary team. “[B]oth cornerstone and capstone project based courses are seen as opportunities to improve students’ ability to work in teams, as well as their communication skills” ( Dym, et al., 2005 , p. 107). Good teams exhibit characteristics such as clear purpose, defined roles and responsibilities, inspiring climate and attitude, effective resource management, and an incentive implementation plan ( Davis, et al., 2002 ). An essential component of design team success is communications. “Different languages are employed to represent engineering and design knowledge at different times, and the same knowledge is often cast into different forms or languages to serve different purposes” ( Dym, et al., 2005 , p. 108). Dym further suggested multiple communication mediums which include verbal, graphical, mathematical or analytical models, and numerical.
Methods
Qualitative case study methodology was employed in this study. As described by Gall, Gall and Borg, “A case study is conduced to shed light on a particular phenomenon, that is, a set of processes, events, individuals, or other things of interest to the researchers” ( 2005 , p. 308). In order to most effectively establish this rapport, six weeks of site visits were conducted during the school year. Gaining entry to the research site means study participants forget a researcher is present and “let down their guard” ( Gans, 1968 ). After entry had been gained, observations were conducted. Documents were gathered including lesson plans, student handouts, and student generated materials. These documents and observations served to present a comprehensive description of the research site, including the teaching methodologies employed, and the delivery of specific content.
Analysis strategies included a general review of all information, feedback from informants, data reduction, and categorization. Data analysis was conducted as conceptualized by Creswell (1998) as a “spiral” (p. 143). Data collection led to data management, reading and memoing, describing, classifying and interpreting and finally representing. This iterative process evolved as the study progressed thus shaping the data collection and being shaped by data which were collected and interpreted.
Data collection included journaling observations during lectures and labs where the researcher was seated in a student desk near the back corner of the classroom. The researcher took an active role in moving among groups of students as they worked on projects in the lab settings. Quotes, as well as observations, were documented. The researcher regularly asked the students what they were doing and why, probing for a verbalized explanation in student language. Care was taken to minimize leading questions from the dialog, and limit interactions to what became typical questions, “how and why.” Students grew accustomed to this regular inquiry and would anticipate the questions before the researcher would ask. This regular dialog became a natural interaction between the researcher and students.
Documents were collected from the students and teachers. All students were required by their instructors to complete a journal as a part of their daily routine. As students completed assignments, they would submit a report for evaluation to the instructors. This report included their daily journal, student data collected, analysis completed (typically in the form of a worksheet) and written reflective components in which students were asked to describe the process and what they could have improved for next time. All data were reviewed multiple times to prepare for classifying. Data categorization followed a constant comparative strategy as outlined by Bogdan and Biklen (1982) , Stainback and Stainback (1988) , and Taylor and Bogdan (1998) . This strategy involved a six-step methodology wherein categories were created by important issues or recurring events. Additional data were collected to provide many examples for each category. Data coding and themes generation were, in part, established a priori to parallel the six elements of engineering design for this study (found in Table 1). Theme generation was not limited to these six elements; as data were reviewed additional emergent themes were discovered in the analysis process. Patterns and relationships were identified and additional data collection served to refine findings.
Verification
“Qualitative researchers strive for ‘understanding,’ that deep structure of knowledge that comes from visiting personally with informants, spending extensive time in the field, and probing to obtain detailed meanings” ( Creswell, 1998 , p. 193). Verification that data were collected and interpreted appropriately was critical to the quality of this study. As Eisner (1991) suggested, “We seek a confluence of evidence that breeds credibility, that allows us to feel confidence about our observations, interpretations, and conclusions” (p. 110).
Multiple procedures of verification were followed in this study. Creswell (1998) suggested engaging in a minimum of two verification procedures. For purposes of verification in this study, the researcher has utilized five procedures: prolonged engagement in the field; triangulation; clarifying researcher bias; member checks; and rich, thick description. The researcher has made five site visits, four of which spanned a total of six weeks and included observation of the interactions between the participating teachers and their students. This extended series of observations provided the researcher with data saturation and ensured multiple observations for each theme established. Triangulation was addressed through connecting gathered observations, student generated documents, teacher generated documents, and informal interviews with 53 students in two sections of the participating classes. Researcher bias was briefly presented in the findings section prior to describing the results so that the reader may understand how the researcher’s background might influence the interpretation and approach. Member checks were conducted through formal meetings with the participating instructors scheduled during each of the four observational visits. The entire qualitative findings section was presented to the participating teachers for feedback and corrections. Lincoln and Guba (1985) , consider member checking to be “the most critical technique for establishing credibility” (p. 314). Rich, thick descriptions are presented in the results section which “…allows the reader to make decisions regarding transferability” ( Creswell, 1998 , p. 203).
The Research Setting
Site selection criteria included a clear emphasis on infusing engineering concepts into a traditional technology education classroom and a diverse group of learners. A high school classroom was identified in which a physics teacher and a technology education teacher worked as a team to infuse and apply engineering concepts in a course called “Industry and Engineering Systems.” This eleventh grade course included an academically diverse array of students. During the fall term, students participated in hands-on learning experiences which represented an intersection of technology education and applied physics, for example; concepts such as motion, forces, electricity, magnetism and simple machines, as well as welding, machining, mechanical fasteners, cutting and bending metals. During the spring term, students applied these concepts in design teams to the Electrathon America challenge, a semester long engineering design challenge. The spring term culminated with fabrication, testing, and redesign of the student designed and built electric cars.
Classroom lectures, activities and lessons modeled infusion of engineering concepts into a technology education classroom. Typical technology education projects during the fall term included magnetic levitation cars, Lego/solar cars, gearing systems, and electric motors. These projects facilitated the marriage of practical applications with engineering design. The instructors' classroom goals included encouraging the students to see the application of math, science, and language arts to hands-on projects and basic engineering concepts.
During the fall semester, teachers concentrated on providing a foundational knowledge base for the spring term. In early January, students started the engineering design challenge with a 1/10th scale model of an electric car and driver. Teams of 2-6 students designed, modeled, and built their Electrathon vehicles. Constraints were imposed by the Electrathon rule book and local facilities. Designs were optimized for weight, balance, tire scrub, air resistance, and other characteristics. Predictive analysis was incorporated into the modeling in the form of model car wind tunnel testing, gear ratio calculation, power demand calculation, and ratios of speed and battery life to distance traveled. Understanding of these parameters was developed in the fall term by building and testing smaller projects such as magnetic levitation cars and calculating horsepower capacity of a student built electric motor.
To insure anonymity, pseudonyms were used to identify the participating teachers, district, and students. Mr. Brewer has been designing, building and racing vehicles with students for 14 years while Mr. Rivet has been teaching for 10 years. Mr. Brewer and Mr. Rivet had 53 students enrolled in the Industry and Engineering Systems courses in which they teach students to think, problem solve, and work as teams to design, build, modify, maintain, and race an Electrathon vehicle. Mr. Brewer is a certified teacher in physics, math and chemistry. Mr. Rivet is a certified career and technical education teacher endorsed in manufacturing technology. They teach courses at Porter Valley High School, which serves approximately 1,500 students in grades 9-12.
Results
Researcher bias is inevitable in presenting qualitative data. The researcher in this study was a former high school technology education teacher with five years experience and adhered to high expectations of students. The researcher had a personal interest in engineering and felt that engineering design could be successfully integrated into technology education curriculum. With this bias presented, the following qualitative data represents a description of what students were encouraged to accomplish during a fall and spring semester at Porter Valley High School. Student quotes, teacher quotes and observations triangulate a common message: Engineering design elements were being applied by the students.
Data were collected on the teaching practices which shaped the learning environment in the form of observations, documents, and curricular plans. Qualitative data collected portray evidence that engineering design was a major focus of this course and that students were practicing these elements of engineering design. Additionally, these data serve to demonstrate a model for infusing engineering design into technology education.
Students who participated in this study enrolled in two co-requisite courses. The courses were scheduled together, facilitating the use of a larger block of time as needed. The fall semester and spring semester were formatted differently based on the goals and educational approaches utilized. During the fall term, the courses were distinctly independent, and the instructors acted in relative isolation from each other. One instructor focused on metal fabrication techniques, and the other instructor focused on teaching engineering as applied physics through a hands-on design based format. The concluding projects for each course in the fall term set the stage for design and fabrication of the engineering design challenge that officially began with the spring term when both classes were fully integrated.
Six main units of instruction were used in teaching engineering design during the fall term. These six units included magnetic levitation, electric motors, solar power, gearing, and two scale modeling experiences. Data were gathered to demonstrate the teacher and student interaction with these six elements. Examples of students’ work are presented in combination with classroom observations.
Problem Definition
Throughout the fall term, students were presented a variety of challenges. The responsibility for defining the problem transitioned from a heavily teacher defined problem to a student defined problem as the semester progressed. An excerpt from Jerome’s journal on the first assignment matched the instructor’s handout almost verbatim, “Our project was to design and construct [a] maglev car with propeller propulsion that will be balanced [and] stable. And race the full length of a 16 foot track in the shortest amount of time.” Another student commented on the first assignment that she recognized aerodynamics are a key subcomponent of the actual problem at hand, “The first thoughts I had on doing this project were on how I was going to be able to make my car aerodynamic.” Though she commented on aerodynamics, she was still following the instructor’s problem definition as it included a requirement for a fast vehicle.
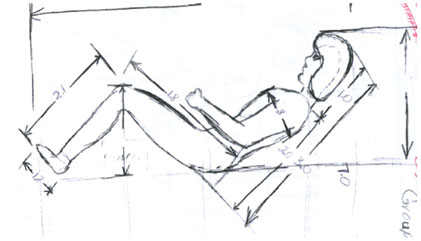
As the semester progressed, students introduced their own constraints in addition to the teachers’ constraints. Near the end of the fall semester, students were assigned a design problem of creating a 1/10 scale model as a prototype for their electric car. One constraint they faced was an ergonomic accommodation of the driver. In Cori’s words, “So to start it off we began by taking all of our needed measurements of our driver. This would allow us to build the frame and body of the car around that of our driver’s body.” Cori’s comments described Figure 1, which showed data gathered by a student team on their driver’s dimensions. This constraining factor was of consideration as it interacted with aerodynamics and physical size restrictions for the cars.
Evidence of evaluation criteria were produced by the instructors and the students. During the first few projects, students were presented with a rubric sheet that included 5-10 areas on which their project would be evaluated. This was a teacher generated form presented with the project briefing. Johan stated in his journal, “We tested the 5 minute run time. Our motor exceed the 5 minutes and ran for 15 minutes plus.” In this instance, the student group had set a more stringent goal than had the instructor, but evaluation criteria followed the same testing procedures. Johan followed up with, “We were really proud!”
Solutions
Students were expected to develop multiple potential solutions to their challenges. These solutions evolved from research of existing solutions and brainstorming alternative solutions. As written by Johan, “When we started our project, we look at the examples and tried to see how we could perfect it.” The instructors provided examples of previous student work and often presented a critique of a few examples during lecture, most examples were marginally functional and facilitated a focus on opportunities for improvement. Students were encouraged to brainstorm and expected to document, with sketches, the various ideas developed. Evidence of the brainstorming sessions was a required component of student journals and included in the final report which accompanied the project for a grade. Students were expected to report details describing their solutions. Cori, a very articulate student, commented:
I figured I would have to carve out the body to make a chamber for the air to go through so the propeller would have more wind hitting it. The next thing I thought about was how to raise the motor up. I decided to use slightly thicker pieces of foam so that they were more stable and have the edged rounded so that it would add to the aerodynamics of my car.
Analysis/Modeling
Students conducted analysis in a variety of activities. Students learned about gear ratios and practiced calculations of motor rotations per minute and wheel rotations per minute given a certain gear ratio. They were expected to be able to calculate gear ratios based on a given sprocket’s number of teeth and a pulley’s diameter. They also worked through calculations to determine the velocity of a car, given a gear ratio, motor RPM and wheel diameter. Students began to articulate connections between variables governing velocity of their moving projects. Johan stated: “In all, I found that the less friction and less wind resistance, the better your car will go down the track, and the faster it will move.” This realization that specific variables govern the physical behavior of our world was a key component of this course according to the instructors.
Students made calculations of power based on the voltage and amperage generated by a pair of solar panels. They practiced calculating power to discover the power produced by a series circuit and a parallel circuit should be the same while the voltage and amperage vary inversely. Students also gathered data on solar power wattage based on distance to a light source. Students took six measurements, calculated power and tabulated the data. An example of Chinelo’s data is shown in Table 2.
| Distance (inches) | Voltage (volts) | Current (amps) | Power (watts) |
|---|---|---|---|
| Note. Data gathered from student worksheet | |||
| 0 | 2.35 | .55 | 1.245 |
| 3 | 2.82 | .31 | 0.626 |
| 6 | 1.94 | .265 | 0.680 |
| 9 | 1.85 | .24 | 0.444 |
| 9 | 1.85 | .24 | 0.444 |
| 9 | 1.85 | .24 | 0.444 |
| 12 | 1.81 | .24 | 0.316 |
| 24 | 1.74 | .06 | 0.123 |
This example has a few multiplication errors in calculating wattage; however, the plot of distance and power (refer to Figure 2) appropriately resembles an exponential curve.
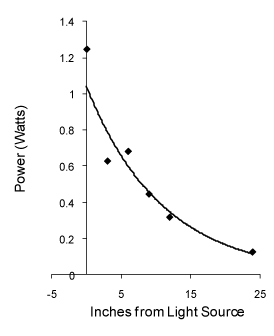
Using this data analysis, students were asked to estimate the power at a distance they had not measured. Chinelo predicted, based on his curve, the power at 20 inches from the source would be approximately 0.159 watts.
As a component of learning analysis, students encountered inconsistencies in data collection. Students attempted to deal with uncertainty in measurement and performance by taking multiple measurements and calculating averages. The researcher observed teams talking about outliers (though not using this term) when referring to measurements that were dramatically higher or lower than other data collected. Typically, students noticed outliers when they inadvertently started a timer too early or too late in comparison to other trials. They used the average speed or times in their calculations. This allowed teams to compare their data to other groups with more confidence that their measurements (and calculations based on these measurements) represented reality.
Experimentation
Each unit of instruction had some element of experimentation. Experimentation was guided by considering variables governing physical behavior of the problem at hand. Students gathered data and prototyped a solution to each challenge. In Cori’s words, “Today we listened to [Mr. Brewer] explain how to use the multi-meter. Then, we went and started finding the volts, amps, and watts that the four different solar panels had.” This journal excerpt reflected on gathering data as a measurement of power based on the distance the solar panel was to the light source. In a following activity, students created a winch powered by the solar panels and lifted small weights. By measuring the amount of weight and time to lift to a specific height, students could compute a horsepower calculation based on a series or parallel circuit. Cori explained:
Today [Mr. Brewer] explained more on how to setup the gearing to test which type of circuit is better in providing more horsepower. Then Asmara and I got to test our system. We also took and did 3 trials of each of the three types of circuits to get a more accurate timing.
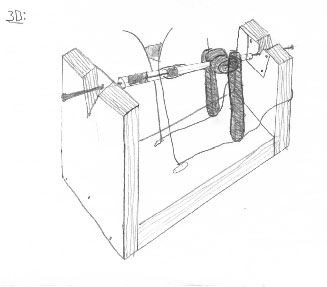
Following the theme of power calculation, students designed and fabricated an electric motor (refer to Figure 3). In this challenge, students refined their design based on data gathered on horsepower. A string was wrapped around the armature and used as a winch to lift weight. Using the same technique as the solar power calculations, students analyzed the horsepower output of their motor and made changes to increase performance. Jovan commented on the iterative process:
My second problem was, I couldn’t get my brushes to work. This problem came with baggage. My coils weren’t wired the right way and then I had to make my brushes to where they wouldn’t short but also have contact for as long as possible. I fixed it by kinking my brush to a point and having it lightly touch the commutators.
Jovan articulated in his report that the experimentation he was conducting tied to an understanding that the magnetic fields caused motion (and power) in the motor. The longer the brushes contacted the commutators, the more powerful his motor. He recognized a tradeoff in the increased contact time with the commutators and the increased potential of a short circuit (if overlap occurred).
Decision Making
Students were presented with opportunities to make many decisions throughout the fall semester. Observational evidence suggested that students used sketching and conversation to discuss alternative solutions. When students were working in teams, they discussed ideas and often, concurrently, attached value judgments. While students were encouraged to separate brainstorming from decision making, students regularly engaged in the two activities simultaneously. In addition, students reflected on their decisions when asked how solutions could be improved. Cori stated in a reflection of the 1/10 scale model:
Some of the ideas I have to make our full size car better, that were not considered while making the 1/10 scale car is to have the foot pedal instead of a thumb throttle. Some advantages to a foot throttle are in having a more familiar feel in the driving of the car. The second reason that this would be preferable is that there are frequently problems with the thumb throttles jamming or breaking during a race, taking lots of valuable time to fix. One disadvantage of this however is that it would limit the height of the people that we could have drive our car.
In this excerpt from her final report, one decision considered alternatives with advantages and disadvantages. Students documented decisions they made in a similar fashion highlighting choices and identifying positive and negative attributes in order to make an informed decision. Dante reflected on decisions he made on a magnetic levitation car, “I learned here that making it look cool doesn’t make it move[,] so for the Electrathon vehicle in the spring, I will make it simple but with all the necessary components made right for functionality.”
Quantitative data were also used to drive decision making. Students used calculations of horsepower to assess changes in their electric motor designs and determine how to wire the solar panels. In brainstorming and preparing a design for the 1/10 scale model car, students gathered quantitative data on driver size (discussed earlier). These data served to constrain decisions on how the driver would comfortably fit into the car when designing the 1/10 scale model. Jovan provided evidence that he used quantitative information presented in lecture to drive the decision making process during the design of the electric motor. Jovan noted a relationship between magnetic strength and distance in his electric motor design, “I want to have my armature to clear my field magnets barely. [Mr. Brewer] said if it’s twice the distance it only retains 1/4 of the magnetivity [magnet strength].”
Teamwork
Teamwork was a critical aspect of this course. Students started the semester with a project in which they worked as individuals, but as the semester progressed, nearly all activities required students to participate in teams. This progression from individual to small groups (then larger groups) allowed students to practice their communication and leadership skills. Students were presented with information on team dynamics such as how to select team members, leadership and group responsibilities. One of the student handouts suggested students consider team members carefully, “As with all team selections you may want to have a member with different skills than you so that they can help complete various tasks.” The team leader, “…should be able to delegate tasks well, not try to do it by themselves.” As the semester progressed, team members gained autonomy in their work habits. Early in the semester, each team member was involved with nearly all aspects of the project, but as the semester progressed, team member specialization and autonomy emerged. Students were expected to discuss plans and divide responsibilities to complete the jobs as suggested in a handout, “The team leader will compile a list of the members of the team and each person will chose one or more tasks on the car that they will be in charge of.”
Students had formal team meetings where a leader facilitated progress, a recorder compiled notes on brainstorming, plans and delegation of responsibilities. Cori, her team’s leader, documented, “I was the one who measured out and did configurations on the foam. Asmara would then cut out the pieces that I measured and Cédrick would do a fantastic job of sanding them down.”
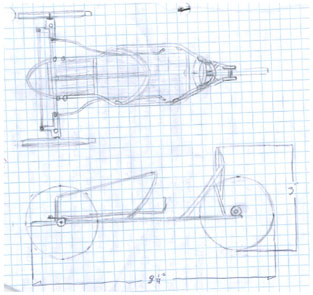
Communication was an important element of teamwork and was used in various forms. Student sketches were a required part of the journaling and reporting process. In Figure 4, Jenson, Joseph, and Jace finalized their sketch for the 1/10 scale model car. This form of visual communication was commonplace among the students as was verbal communication in team meetings. Teams had daily meetings at the beginning and end of each period to plan the coming workload and distribute responsibilities. At the conclusion of each unit of instruction, students create final reports reflecting on their progress, what they learned and what they could have done better for next time. Cori’s report on the 1/10 scale model illustrates her written reflection:
There were several things that I learned during this project. The first was that I got better at welding on small things. I could make decent welds on larger objects before I started that car, and now I am able to do decent welds on smaller items. The second skill I acquired was in being able to work with fiberglass. This was something I had never done before and found that I am fairly good at it. A third skill I improved on was being able to take real measurements and put them into a working model.
Emergent Themes
Two strong emergent themes developed throughout the term and were interwoven into each learning experience. One was the intense focus on preparation for the large spring design challenge. The other emergent theme was a transition from well-defined problems to ill-defined, and was increasingly open-ended as the semester progressed.
The focus in the fall on preparation for the spring challenge was discussed with the students and observed by the researcher. Each activity in the fall connected to some aspect of designing, fabricating, and learning to work as a team. Students learned to weld and practiced cutting, bending, and mechanically fastening metal in methods that could be used in layout and construction of the electric car. Students practiced on the same metal thickness and welding positions that would be directly transferable to the spring challenge.
Aerodynamics of the magnetic levitation car directly transferred to their electric car body with an intermediate step learning about fiberglass plug-mold technologies through their 1/10 scale model car design. Analysis of gear ratios and calculating speed based on motor rpm during their solar car activity transferred to the larger wheels in their spring challenge. The realization that theoretically gearing the car to go faster may actually make the car go slower (as the motor stalls) was a real experience in optimizing the gear ratio of the solar car and winch.
Team size gradually increased in preparation for teams of up to six students in the spring. Thus, leadership and participation were practiced before the spring challenge. While the rules for the spring challenge were well-defined, they focused primarily on safety and fair competition. Car design was largely an open-ended and ill-defined problem. As the fall semester progressed, students experienced an increase in their responsibility to determine the problem definition and evaluation criteria.
One of the capstone fall projects included a 1/10 scale model car, designed, and fabricated from steel frame members. Teams made fully articulated scale driver models to ensure the frame design fit their driver. Wheels and steering linkage were functional. Moving the steering wheel (or levers, as the case may be) moved 1/10 scale tie-rods which moved steering wheels. Mockup batteries and motors were in place to demonstrate fit and consideration of weight and balance issues.
The other capstone fall project was a miniature frame welded from full size material. The fixtures required to produce this frame project were mounted on a small section of plywood, laid out just as the full size car would be a few weeks later. Students discovered the challenges associated with cutting and fabricating steel tube and flat stock at predetermined angles. The instructor provided some of the dimensions as constraints and allowed students to design other aspects of the frame. The required dimensions forced student teams to figure out how to measure their material and develop fixtures to match specifications. This learning experience transferred to the full size car project as their design specifications were laid on a larger plywood board, and angles were critical for steering and the squareness of the frame.
Early projects in the semester were clearly defined and had focused evaluation criteria determined by the instructors. Design briefs listed evaluation criteria for the students to follow. The magnetic levitation design brief stated, “Design and construct a maglev car with a propeller propulsion that will be balanced, stable, and race the full length of a 16 foot track in the shortest amount of time.” Students were provided with a list of constraints and materials available. In another early activity, students designed an electric motor. Their design had some freedom, but a 19-step assembly method narrowed the list of potential solutions. Each motor looked different and, in particular, students’ designs for the brushes varied. However, in later assignments, a much greater degree of freedom was promoted, thereby expanding the problem and solution space with ill-defined problems.
As the capstone fall project, the 1/10 scale model provided students with many opportunities to address the problem creatively. The design was required to be scaled and, potentially, a car the team might want to build in the spring. Decisions on steering, weight distribution, driver position, frame, and roll bar design were entirely up to the students. This ill-defined problem yielded many unique and differing solutions. Students’ problem definitions varied from rider comfort as a priority to aerodynamics as a higher priority, evident in the rider position from recumbent to upright. Ergonomics and aerodynamics are examples of design considerations (at times conflicting), but additional considerations such as safety, impact resistance, durability, and weight were in students’ dialogs.
Discussion
Kindergarten through twelfth grade education has been identified as an opportunity to foster a technologically literate society ( Gamire & Pearson, 2006 ; Gorham, 2002 ; International Technology Education Association, 1996 , 2000 ; Pearson & Young, 2002 ). To be technologically literate includes developing an understanding of the engineering design process ( International Technology Education Association, 2000 ). Engineering design challenges may be a way to bridge the divide between technology education and engineering as they provide an opportunity to focus efforts on a design project while applying engineering principles.
Results of this research suggest that students and teachers were engaged in applying an engineering design process in a technology education context. Hailey et al. (2005) , identified analysis as the missing element in the technology education design process in a comparison with the engineering design process. This research suggested that students were conducting analysis in this classroom. This analysis was contextualized in a hand-on environment using traditional technology education experiences. Designing and building electric motors, for example, is not new to the field, but these students were expected to analyze mechanical power of the motor, calculate electrical consumption. In doing so, they developed measurement skills and made mathematical calculations. Their motors were optimized for performance based on experimentation guided by an understanding of pertinent variables.
Technology education has a successful track record in providing hands on experiences, but may strengthen its ties to an integrative STEM education approach by leveraging natural connections that exist. Performance of the electric motor (again as an example) is contingent on many variables including magnetic strength, friction, and electrical conductivity of the brushes. Scientific and mathematical thinking was applied in this context, potentially strengthening student learning of STEM concepts. The engineering design process often stops short of a building or construction experience. Technology education leverages historic strengths in the element of building and testing. An integration of technology and engineering in this research provided evidence that both can co-exist.
Evidence has been presented that high school students are using the engineering design process in this course through qualitative research methods. In the qualitative tradition of inquiry, this study analyzed data presented; however, not all participants provided journals, reports or even attended class on a regular basis. These students were not formally interviewed and thus, data presented here is limited. Additionally, students vary in their ability to articulate thoughts in conversation and written documents, thus in reviewing these data, it was noted that future study might involve additional data collection, such as formal stratified student interviews to further triangulate findings.
Engineering design challenges are one potential avenue for facilitating the understanding of engineering through handson application. Technology education historically has been the window through which students apply what they have learned in a relevant hands-on fashion. Utilizing the tools specific to engineering in concert with technology education’s hands-on approach may facilitate expanding students’ technological literacy. Students in technology education typically use many tools such as material processing equipment, computer aided design software and teamwork to solve problems. Engineering adds additional tools to the experience in the classroom. The extent to which engineering design is applied in the classroom is related to the developmentally appropriate nature of student learning just as the decision to use power tools (and which ones) in material processing problems. These engineering tools and processes may be developed into the technology education curricula for research and testing. All current students and future community members are directly or indirectly impacted by decisions of engineers. As high school students begin to understand the critical lens used by engineers to make decisions, they, too, will deepen their understanding of the world shaped by engineers.
Acknowledgement
This material is based on work supported by the National Science Foundation under Grant Number ESI-0426421. Any opinions, findings, and conclusions or recommendations expressed in this material are those of the author(s) and do not necessarily reflect the views of the National Science Foundation.
Nathan Mentzer, is an Assistant Professor in the Technology Leadership and Innovation Department at Purdue University. He can be reached at nmentzer@purdue.edu .
References
ABET. (2007). Criteria for Accrediting Engineering Programs. Retrieved March 17, 2007, from http://www.abet.org/Linked%20Documents-UPDATE/Criteria%20and%20PP/E001%2007-08%20EAC%20Criteria%2011-15-06.pdf
Bogdan, R. C., & Biklen, S. K. (1982). Qualitative Research for Education: An Introduction to theory and methods (3rd ed.). Needham Heights: Allyn & Bacon.
Box, G. R. P., & Liu, P. T. Y. (1999). Statistics as a Catalyst to Learning by Scientific Method. Journal of Quality Technology, 31 (1), 1-12.
Creswell, J. W. (1998). Qualitative Inquiry and Research Design . Thousand Oaks: Sage Publications.
Davis, D. C., Gentili, K. L., Trevisan, M. S., & Calkins, D. E. (2002). Engineering Design Assessment Processes and Scoring Scales for Program Improvement and Accountability. Journal of Engineering Education, 91 (2), 211-221.
Dym, C. L. (1999). Learning Engineering: Design, Languages, and Experiences. Journal of Engineering Education, April , 145-148.
Dym, C. L., Agogino, A. M., Eris, O., Frey, D. D., & Leifer, L. J. (2005). Engineering Design Thinking, Teaching, and Learning. Journal of Engineering Education, 34 (1), 103-120.
Dym, C. L., & Little, P. (2004). Engineering Design: A project based approach (Second ed.). Hoboken: John Wiley & Sons.
Eide, A., Jenison, R., Mashaw, L., & Northup, L. (1998). Introduction to Engineering Design . Boston: McGraw-Hill.
Eide, A., Jenison, R., Mashaw, L., & Northup, L. (2001). Introduction to Engineering Design . Boston: McGraw-Hill.
Eide, A., Jenison, R., Northup, L., & Mickelson, S. (2008). Engineering Fundamentals and Problem Solving (Fifth ed.). Boston: McGraw-Hill.
Eisner, E. W. (1991). The enlightened eye: Qualitative inquiry and the enhancement of educational practice . New York: Macmillian.
Engineering Accreditation Commission of the Accreditation Board for Engineering and Technology Inc. (2001). Engineering Criteria 2000 .
Gall, J. P., Gall, M. D., & Borg, W. R. (2005). Applying Educational Research: A Practical Guide (5th ed.). New York: Longman.
Gamire, E., & Pearson, G. (Eds.). (2006). Tech Tally: Approaches to Assessing Technological Literacy . Washington, D.C.: National Academies Press.
Gans, H. (1968). The participant observer as a human being: Observations on the personal aspects of fieldwork. . In H. S. Becker, B. Greer, D. Reisman & R. Weiss (Eds.), Institutions and the Person (pp. 300-317). Chicago: Aldine.
Gattie, D. K., & Wicklein, R. C. (2005, June). Curricular Value and Instructional Needs for Infusing Engineering Design into K-12 Technology Education . Paper presented at the American Society for Engineering Education Annual Conference & Exposition, Portland, OR.
Gomez, A. G., Oaks, W. C., & Leone, L. L. (2004). Engineering Your Future . Okemos: Great Lakes Press, Inc.
Gorham, D. (2002). Engineering and Standards for Technological Literacy. The Technology Teacher, 61 (7), 29-34.
Gorham, D., Newberry, P. B., & Bickart, T. A. (2003). Engineering Accreditation and Standards for Technological Literacy. Journal of Engineering Education, 92 (1), 95-99.
Hailey, C., Erekson, T., Becker, K., & Thomas, M. (2005). National Center for Engineering and Technology Education. The Technology Teacher, 64 (5), 23-26.
International Technology Education Association. (1996). Technology for All Americans: A Rationale and Structure for the Study of Technology . Reston, VA: Author.
International Technology Education Association. (2000). Standards for Technological Literacy: Content for the Study of Technology . Reston, VA: Author.
Lewis, T. (2005). Coming to Terms with Engineering Design as Content. Journal of Technology Education, 16 (2) , 37-54.
Lincoln, Y. S., & Guba, E. G. (1985). Naturalist Inquiry. Beverly Hills: Sage.
Moore, P., Atman, C., Bursic, K. M., Shuman, L. J., & Gottfried, B. S. (1995). Do freshman design texts adequately define the engineering design process? Paper presented at the American Society for Engineering Education Annual Conference, Ahaheim, California, June 25-29.
Pearson, G., & Young, A. T. (Eds.). (2002). Technically Speaking: Why All Americans Need to Know More About Technology : National Academy of Engineering.
Smith, K. (2000). The Academic Bookshelf. Journal of Engineering Education, 89 (2), 105-109.
Stainback, S., & Stainback, W. (1988). Understanding and Conducting Qualitative Research . Newbury Park: Council for Exceptional Children.
Taylor, S., & Bogdan, R. C. (1998). Introduction to Qualitative Research Methods: The Search for Meanings (3rd ed.). New York: John Wiley & Sons, Inc.