JTE - Fall 2004 v16n1 - Technology Education Standards Implementation in Florida
Technology Education Standards Implementation in Florida
Thomas Loveland
Introduction
The release in 1983 of A Nation at Risk initiated far-reaching educational reforms through state and federal legislation. A major thrust of school reform has been the use of mandated or recommended educational standards. Standards-based reform is on the agenda in nearly every state in the nation and in almost every content discipline. New federal and state legislation aimed at educational reform and accountability is increasing the pressure for standards-based reform. National educational associations have proposed content standards for their curriculum areas. The National Science Education Standards (NSES) and National Council of Teachers of Mathematics (NCTM) Math Standards are two recognized content standards-based reforms. In 2000, the International Technology Education Association (ITEA) published the Standards for Technological Literacy.
Similar in scope and intent to the National Science Education Standards, the Standards for Technological Literacy were conceptualized as a way to bring more consistency and accountability to the varied technology education K-12 content in the United States ( International Technology Education Association, 2000 ). The organization's goal was to continue the reform of technology education from its industrial arts past to an interdisciplinary and academic future, thus ensuring continued support from educational and political leaders.
The future of technology education is uncertain. Technology is changing so rapidly that it is difficult for schools to keep up-to-date technologies in the classrooms ( Dugger & Naik, 2001 ). States are using strong local programs to build a case for technology education as a basic core requirement for graduation ( Newberry, 2001 ). These challenges persuaded leaders of the Technology for All Americans Project and the International Technology Education Association to follow the direction of leaders in science and mathematics in developing standards for the field of technology education.
The central problem this paper examines is how content standards devised at the national level filter down into classrooms where teachers make the decision to implement or not. A critical element in dissemination of "top-down" standards is the role of district content area supervisors. There is a paucity of research that explores district-level factors that contribute to or hinder facilitation of education reform. Educational leaders have a lack of understanding about how attributes of the supervisors and districts themselves affect implementation of content standards in classrooms. Two potential results from the study are more efficient ways of disseminating educational innovations in the future and identification of districts that will require more concerted training in the standards.
The purpose of this study is to examine the relationships between school district and technology education district-level supervisor variables and the technology education teachers' perceived levels of classroom implementation of the Standards for Technological Literacy in their respective districts.
Research Questions
Q1. What is the relationship between perceived teacher implementation of the Standards for Technological Literacy and district enrollment? Q2. What is the relationship between perceived teacher implementation of the Standards for Technological Literacy and district school density? Q3. What is the relationship between perceived teacher implementation of the Standards for Technological Literacy and district socio-economic status? Q4. What is the relationship between perceived teacher implementation of the Standards for Technological Literacy and district technology education supervisor length of service? Q5. What is the relationship between perceived teacher implementation of the Standards for Technological Literacy and level of district technology education supervisor involvement in the International Technology Education Association? Implementation Models
What is the effect of national standards on the nation's schools? According to the National Research Council (2002) , there are three interacting channels that could be influenced by the adoption of standards: curriculum, teacher development, and assessment and accountability. Curriculum may be affected in the areas of legislative mandates, district curriculum planning, and textbook publishing. Teacher development may be affected by standards in district professional development, colleges of education, and state agencies. Teacher development often focuses on the initial preparation of teachers, certification and licensure, and ongoing professional training.
Assessment and accountability propels change in school systems. They inform the public about how their schools are doing. Assessment informs supervisors about teacher certification, allocation of resources, and sanctions. The introduction of content standards requirements in state curriculum frameworks, school improvement plans, and school accreditation could give districts a strong incentive to adopt standards into school curriculum. Assessment has a major consequence on college entrance and placement for district students.
How do new national standards get incorporated into classroom curriculum? The National Research Council (2002) identified four critical areas of research regarding the introduction of national standards: contextual forces, educational channels of influence, teachers and teaching practice, and student learning. A framework for investigating the influence of nationally developed standards for mathematics, science and technology education (p. 80) describes how innovations move through the educational system.
Theories on diffusion of innovations and information utilization describe constructs and models for the implementation of new ideas. Traditionally, implementation models were based on those from agriculture, business, and medicine. Social scientists and educators initially adopted these market-based models of innovation in the 1940s to explain how to bring about change in school systems. Early models of educational innovations were based on the concept of student test scores and achievement as the only measure of implementation ( Havelock, 1976 ; Rogers, 1995 ).
In the 1970s researchers began to focus on a different view of educational reform. In a seminal study on educational change, the Rand Corporation ( Berman & Pauly, 1975 ) designed a study through the National Opinion Research Center that carefully studied 293 federally-funded projects in 18 states to determine factors that affected the success of educational innovations. The study concluded that because of the length of time needed for the development of innovations, the incremental rate of educational change and implementation mutation, measuring student outcomes was both premature and inappropriate. Larsen (1985) stated that when utilization of information was described as a single action-based activity that happened in a predetermined period of time, measuring only the narrow dimension of use, research results suggested that utilization did not occur. When implementation included political, socioeconomic, and attitudinal factors, and non-utilization was considered as a category, significant results in utilization studies became more common.
The Rand Change Agent Study hypothesized that superintendents and district officials play major roles in the initiation and continuation stages of innovation. Crandall (1989) described the important contributions that district office-based facilitators make. Their assistance included understanding the needs of students in the district, selecting appropriate innovations to meet those needs, arranging funding, preparing professional development for teachers, and securing support from the school board, superintendent, principals, and teachers. Fullan (1991) stated that district administrators are the key factor in initiating and continuing educational innovations. This leader has a "conceptual understanding of the dynamics of the organization, the processes of change, and the people in (their) jurisdiction (that) represents the most generative...source of ideas about what goes into a plan and what steps have to be taken when things go wrong" (p. 198).
In the Rand Study, multiple regression measures were used to test the variables that affect federal change agent innovations. The researchers summarized seven significant variables that affect the stages of educational innovation. The size of a school district as measured by enrollment (logarithmically adjusted) had the greatest effect. A second variable was enrollment density within the district as measured by the average number of students per school. Whether there were cutbacks in programs in the district in the previous two years had an effect. The fourth variable was the revenue source for the district measured as the percentage of revenue from the state divided by the state average. The fifth and sixth variables measured socio-economic factors: the percentage of families with incomes above $25,000 in 1975 and the percentage of families that were poor and minority. The last significant Rand variable was the length of service of the supervisor in the district. An additional variable according to innovation researchers ( Betances, 1999 ; National Research Council, 2002 ; Odden, 1991 ) was active participation in professional networks like NCTM, National Science Association and the ITEA.
Measurement of the level of implementation as a dependent variable has centered on seven or eight stage models ( Cousins & Leithwood 1993 ; Larsen 1985 ). These models are based on ascending levels of implementation of information and educational innovations. A level one response indicates a lack of awareness of the innovation. Level eight indicates full adoption of the innovation with adaptation to local conditions. Participants choose the self-perceived level that most closely identifies their current level of implementation of the innovation.
A post-study inquiry about the model questioned how to measure the response from someone who completely understands the innovation but disagrees with it or refuses to implement it. Those individuals may have chosen level three or discarded the survey instrument. Additional information in level three might have helped clarify this point. The operational model for the Florida study reported herein and titled Levels of Implementation of the Standards for Technological Literacy was adapted from the Cousins and Leithwood 1993 model by substituting the words Standards for Technological Literacy for the original word intervention. The model is presented in Table 1.
Methodology
A study was designed to look at district-level predictors in the implementation of new content standards, specifically the Standards for Technological Literacy in Florida. The study used a correlation research design to look at the relations between district size, enrollment density, district socioeconomic status, district supervisor length of service, and participation in professional networks and technology education teachers' self-reported perception of implementation of the Standards for Technological Literacy within their classrooms. Table 2 summarizes the complete set of variables.
Table 1
Levels of Implementation of the Standards for Technological Literacy
1 I am not aware of the Standards for Technological Literacy. 2 I am aware of the Standards for Technological Literacy but have not seen a copy (e.g. did not read it or attend workshop). 3 I was exposed to the Standards for Technological Literacy (e.g., read report, attended workshop) but subsequently, have done nothing about it (e.g., no action, no discussion with colleagues/peers). 4 I am currently considering information from the Standards for Technological Literacy (e.g., being discussed or reviewed with colleagues/peers). 5 Based on information from the Standards for Technological Literacy, I have taken steps toward action (e.g., decision to use, plans being made). 6 I am making partial use of information from the Standards for Technological Literacy. Actions have been taken on selected features of the standards, but others have been disregarded. 7 I am making full use of the information from the Standards for Technological Literacy in the form in which it was presented. 8 I am making full use of the information from the Standards for Technological Literacy in a form modified to fit my needs. In order to establish content validity of the instruments and scales, a focus group of professional educators was utilized. Twelve educators attended a Standards Interpretation Workshop in July 2002 in Atlanta, Georgia. Sponsored by the International Technology Education Association, it attracted participants from four southeastern states. The participants included three state supervisors of technology education, two technology education university professors, one district technology education supervisor, one school principal (recent technology education middle school teacher) and five high school technology education teachers. This convenience sample allowed for a wide range of perspectives on technology education. During the workshop, time was set aside for the participants to review the proposed instruments and scales for this study. In pairs, the educators were asked to review a supervisor and teacher survey for clarity of the questions and instructions. They were also asked to review three hierarchical scales: teacher certification, involvement in ITEA, and classroom implementation of the standards. A careful analysis of the group responses led to modest changes in the instruments.
After the study was approved by the Office of Research Compliance at the University of South Florida, a pilot study of the teacher measure was undertaken. Eleven copies of the teacher package were mailed out to a random selection of technology education teachers in a medium-size district in west central Florida. Seven of the eleven teachers responded to the survey, a 64% response rate. No follow-up surveys were sent out. The collected surveys showed that the teachers understood the directions and responded in appropriate ways.
Table 2
Variables Investigated
Variable Name Type Q Measure Scale District
EnrollmentIV 1 Logarithmic transformation of HS and MS enrollment from Florida DOE Website Continuous District School
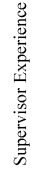
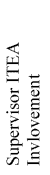
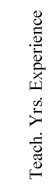
DensityIV 2 Calculated from HS and transformation of HS and MS enrollment from Florida DOE Website Continuous District Socio- Economic Status IV 3 District free and reduced lunch % as reported on the Florida DOE Website Continuous Supervisor Length of Service IV 4 Supervisor self-reported years of service Continuous Supervisor Involvement in National Organization IV 5 Supervisor self-reported level of involvement with ITEA: (4) level Ordered categorical Teacher Implementation of Standards of Technological Literacy (STL) in Classroom DV all Teacher self-reported level of STL implementation eight level scale base on Cousins and Leithwood Continuous derived from pooled teacher (ordered categorical scale Teacher Length of Service NV all Teacher self-reported years of service Continuous Teacher Certification Type NV all Teacher self-reported Type of Certification(5) levels Continuous derived from pooled teacher (ordered categorical scale) Notes . In the Type category IV = independent variable, DV = dependent variable, and
NV = nuisance variable to be adjusted out. The Q category refers to the research
question with which the variable is associated.
The original dependent variable scale ( Larsen, 1980 ) was used with qualitative interviews and the Concerns-Based Adoption Model instrument in a study of 39 mental health facilities reporting levels of information utilization. Cousins and Leithwood (1993) adapted the Larsen scale for their study with 535 Ontario elementary school principals. Their study was conducted utilizing path analysis with LISREL 7. They reported high reliability and validity but did not provide supporting data.
In order to establish concurrent validity of the dependent variable scale, two strategies were developed to compare the self-reported level of implementation by teachers with the reality of their classroom implementation. The first strategy involved the use of a second teacher survey that asked 35 questions to identify the level of implementation. This survey was adapted from a Standards-Based Technology Education Teacher Matrix of Criteria developed and distributed by the International Technology Education Association during their third phase of standards implementation. Twenty technology education teachers from Florida were randomly selected and interviewed using this questionnaire. A rating rubric was developed for the ITEA standards matrix to code teacher responses and assign a true level of implementation. The true level of implementation was compared with the teacher's self-perceived level of implementation. A Pearson correlation coefficient was determined to be .97, a remarkably high correlation for the 20 teachers in the sample. This value indicates that both surveys have good validity.
The second strategy was to use a qualitative method of personal interviews with teachers in their classrooms. Seven technology education classrooms that represented each level of implementation above level one were visited in varying districts and school levels. A list of questions was developed to ask teachers in order to elicit responses that showed their true level of standards implementation in lessons and curriculum. Their responses indicated that they had chosen the level of implementation that matched what they were doing in their classroom.
In July 2002, two Florida Department of Education websites were accessed to provide data for the first three questions: district enrollment, district school density and free and reduced lunch rate. The websites were:
Responses for research questions four and five were collected from a supervisor survey. The survey asked for the district name, number of years of service as a supervisor, level of involvement with ITEA, and whether their technology education supervisor duties were fulltime or part-time.
The one ordered categorical question asked supervisors about their level of involvement with the ITEA. Their choices were: 1) None (no involvement in ITEA, not a member), 2) Minimal (member of ITEA, occasionally reads articles in The Technology Teacher, ITEA has little effect on my supervisory duties or guidance given to teachers), 3) Active (member of ITEA, attends national conferences occasionally, reads articles in The Technology Teacher with strong to moderate interest), and 4) Very Active (member of ITEA and attends national conferences regularly, attends association-designed training on Standards for Technological Literacy, reads articles in The Technology Teacher with strong interest, or writes articles for publication in ITEA journals and websites).
Surveys were distributed at a meeting of the Florida Association of Supervisors of Technology Education. Survey packages were subsequently mailed to the non-attending supervisors. Follow-up emails, letters, and personal phone calls resulted in valid responses from 65 of the 67 (97%) district technology education supervisors in Florida.
A different survey was prepared for distribution to technology education teachers in Florida. In addition to the implementation level, the teacher survey asked for information about two nuisance variables. The teacher survey asked respondents for their district name, years of teaching experience, level of certification, and level of implementation of the Standards for Technological Literacy in their classroom. One ordered categorical question asked teachers about their certification as an industrial arts/technology education teacher. The choices were: Level 1 : no certification, Level 2 : out of field certification, Level 3 : local district certification, Level 4 : State 6-12 Industrial Arts/Technology Education temporary certification or Level 5 : State 6-12 Industrial Arts/Technology Education professional certification.
Collection of teacher data was accomplished in several ways. An online survey was posted on the Florida Technology Education Association (FTEA) website . Surveys were distributed at the FTEA conference in 2002. A list of 1600 Florida technology education teachers (sorted by district) was received from the State Supervisor of technology education. This list was compared to the lists provided by district supervisors of their technology education teachers in order to create a valid list of teachers. Through mass mailing of survey packages, postcards, and online data collection, the 1,083 Florida technology education teachers were contacted. Four hundred valid responses from 62 districts were received, a 37% response rate statewide. These teacher responses, matched with their supervisor's responses, yielded 60 of 67 (89.5%) Florida districts with valid responses for each of the variables. The district level means were used in the data analysis for the study. For example, 14 teacher responses from district #16 were pooled to create district #16 data on years of service, certification level and level of implementation of the standards.
Results
The frequency distribution of Florida technology education teachers self-perceived levels of implementation of the standards is presented in Table 3. When measured at the individual teacher level ( n = 400), this distribution was U-shaped. There were many teachers implementing at very high levels or not at all. When the data was pooled by district ( n = 60), the distribution was normal. Three years after release of the Standards for Technological Literacy, 42% of participating Florida teachers reported using the standards at the top three levels of use. Sixty-three percent had read the standards.
Descriptive statistics, correlation matrix and multiple regression were utilized to analyze the effects of the independent variables on teacher's perceived level of standards implementation. The descriptive statistics for each variable are in Table 4. The teacher variables are given for both statewide ( n = 400) and district pooled ( n = 60). The district pooled data were used for the correlation and multiple regression analysis.
Table 3
Frequency Distribution of Teacher Levels of ImplementationNote : n = 400
Implementation Level f % Cum.
f .Cum.
%1. No Awareness 76 19.00 76 19.00 2. Aware, but Not Read 70 17.50 146 36.50 3. Read, but No Action 36 9.00 182 45.50 4. Considering Information 18 4.50 200 50.00 5. Decision to Use 33 8.25 233 58.25 6. Partial Use 65 16.25 298 74.50 7. Full Use As Is 23 5.75 321 80.25 8. Adapted Full Use 79 19.75 400 100.00
Table 4
Descriptive Summary of Independent, Nuisance and Dependent Variables
Variable n M SD Skewness Kurtosis District Enrollment (log) 60 3.89 0.64 0.102 -0.755 District School Density 60 1052.00 468.00 0.251 -0.575 District Socio-Economic Status 60 44.38 11.98 0.358 -0.267 Supervisor Length of Service 60 9.07 7.88 1.251 1.085 Supervisor Involvement in National Association 60 1.55 0.85 1.369 0.806 Teacher Perceived Level of STL Implementation 400 4.36 2.61 0.090 -1.512 Teacher Perceived Level of STL Implementation (District Means) 60 3.79 1.80 0.507 0.127 Teacher Length of Service 400 13.34 10.52 0.643 -0.838 Teacher Length of Service (District Means) 60 12.96 7.47 0.663 0.604 Teacher Level of Certification 400 4.29 1.18 -1.256 -0.109 Teacher Level of Certification (Distric Means) 60 4.00 1.10 -1.188 0.525 Several regression models were formed in order to understand the overall R2 attributed to the five variables, the unique contribution of each variable, and the contribution of each variable when controlled for two teacher nuisance variables: length of service and type of certification. The first three were selected to give an overall picture of the effect of the independent variables in combination in predicting the implementation of the technology education standards in district classrooms. The last five models were designed to answer specific research questions posed in the study.
After the district and teacher data were compiled and sorted, several data analysis steps allowed the researcher to analyze the assumptions about the multiple regression analysis. The first assumption, independence, was not violated because district means were used and there appeared to be little contact between teachers within and across districts.
The second assumption was that the predictor variables were fixed. The predictor variable, involvement in the national association, was the only variable based on a categorical scale that is fixed. Regression is robust to violations of this assumption.
The third assumption was that the predictor variables were measured without error or bias. This assumption is directly related to the reliability of the predictor variables. In the study, the predictor variables were explicit and unambiguous to answer and so it appears that the third assumption was not violated.
There are three additional regression assumptions analyzed: normal distribution of residuals, common variance or homoscedasticity of errors, and linearity. None was determined to be interfering with the robustness of the multiple regression analyses.
In addition to the assumptions of the regression analyses, there are three statistical issues addressed in the study: multicollinearity, bias in R 2 , and influence of outliers. Multicollinearity is the overlap between two predictor variables. This did not appear to be a problem in most of the regression analyses. The correlation matrix (Table 5) revealed only one highly linear relationship among the 28 correlations. The Pearson correlation coefficient between district enrollment density and district enrollment (log transformation) was a strong .84 with a p value <.0001.
The second issue of concern, bias in R 2 , could be a problem in the study. R 2 bias is a function of the number of predictor variables and sample size. R 2 bias was minimized through the use of the adjusted R 2 in all regression models. Six indicators of influential observations were examined to evaluate the third issue of concern. All six pointed to particular observations, but the removal of those observations did not change the number of significant variables in the study.
Table 5
Correlation Matrix of Independent, Nuisance, and Dependent Variables Measured at the District LevelNotes : n = 60. * p < .05.
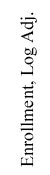
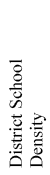
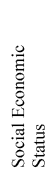
Enrollment, Log. Adjusted .37* District School Density .45* .84* Social Economic Status .01 -.09 -.15 Supervisor Yrs. Experience .07 .08 .14 -.12 Supervisor ITEA Involve. .18 .65* .56* -.07 .09 Teacher Years Experience -.22 -.02 .00 -.06 -.10 .05 Teacher Certification Level .09 .39* .40* -.07 .10 .20 .40
Findings and Implications
The key findings of the study were that higher district enrollment and school enrollment density were linked to higher levels of perceived implementation of technology education standards in Florida schools. Sixteen percent of the adjusted variance was attributed to district school density. The increase in implementation may be related to increased opportunities for teachers to work with colleagues. Schools with many technology education teachers increase the likelihood that some of the teachers have been exposed to the standards.
Eight percent of the adjusted variance was attributed to district enrollment. Larger school districts have larger budgets, greater flexibility to direct funds, more inservice training, and more political flexibility. District socio-economic status and supervisor length of service had no apparent effect on the implementation level of the districts. There were mixed results regarding the involvement of the supervisor in national associations due to a highly skewed frequency distribution. Eighty-three percent of the supervisors have minimal or no involvement in the ITEA. These results are summarized in Table 6.
The major implication of the study is that it will be a challenge to implement content standards and other educational innovations in small districts. There may need to be outside institutional and political pressure through funding, staff development, and state mandates in the areas of statewide student assessments, district accountability, and teacher licensure. National educational associations may need to increase their outreach efforts to low enrollment districts through regional teacher training, local consensus building, and membership increases of key constituents.
Table 6
Multiple Regression SummaryNote : n = 60.
Variables Pearson r p Adj. R 2 School district density .448 <.000 .161 School district enrollment .354 .006 .081 Supervisor involvement in national association (ITEA) .189 .148 .011 Supervisor length of service .083 .530 -.016 School district socio-economic status (free/reduced lunch) .006 .961 -.017
In order to encourage low enrollment districts to increase their use of the content standards, legislators and educational institutions, through incentives, may consider the incorporation of content standards like the Standards for Technological Literacy into statewide student high-stakes assessments and accountability expectations. State curriculum frameworks could be written to the standards. School improvement, school technology, and school accreditation plans could call for demonstration of standards-based curriculum within schools and districts. Professional development of teacher interns and licensure of beginning and professional teachers could include criteria that require the demonstration of content area knowledge and concomitant standards, and show that they can teach using standards-based instructional methods and curriculum. National certification and merit pay guidelines could require competence in the standards. These efforts and the adoption of content standards in state and national student assessment instruments will likely compel curriculum developers and textbook publishers to include the standards in their educational materials.
It is likely that there are small districts that resist top-down mandates and pressure to increase implementation of the Standards for Technological Literacy. During the qualitative discussions with teachers, several high implementing teachers with low district support emphasized their grass roots efforts in adopting the standards. These teachers acknowledged that they received their support from fellow teachers across the state through web sites, email, and work with associations like the Florida Technology Education Association. Commitment from teacher educators can help overcome district indifference, lack of resources, and poor training.
National associations like the International Technology Education Association can develop local consensus on the value of the standards through media dissemination of information about the standards. Contacts with trade industry associations could assist in building awareness in many communities about the need for technological literacy. Research studies on the effectiveness of standards-based curriculum could be supported by the national associations. Standards-based curriculum and assessment models could be developed into training materials from studies on best practices. The associations could then work with state technology supervisors to identify low enrollment districts. Regional standards training could assist these low enrollment districts in providing their technology education teachers with opportunities for professional development that would not otherwise be available to them.
National content organizations can increase memberships of key constituents. District supervisors of technology education should become more involved and active in their content organizations. Attendance at regional standards inservices would be a step in that direction. Increases in involved supervisors would allow researchers to accurately assess whether association involvement is a significant factor in implementation of content standards.
Teacher educators may be having an effect on implementation of innovations by teaching new teachers about the new content standards. Teachers, in the early stages of innovations, are the ones who commit to innovations and sustain the innovation when the development money dries up. Odden (1991) discussed how standards implementation is facilitated by teacher participation in professional activities, leading to strong, informally coupled networks of teacher experts. An infusion of dedicated teachers into the national and state content-related associations should increase the level of standards implementation within states and districts.
The author would be remiss in not addressing the viability of using the Rand Study as the conceptual framework for the study. At the time of the Rand Study, the majority of educational innovations being studied were redistributive in nature. Following the Great Society programs of the late 1960s, many federally funded educational programs were designed to right the wrongs of society. Desegregation, compensatory education, and bilingual education had a contentious implementation process. These were issues in which teacher collegiality worked against implementation. Educational innovations in the 1990s tended to be about curriculum development so that teacher collegiality worked in favor of implementation. Unlike the Rand Study projects that were federally funded demonstrations, the Standards for Technological Literacy are being implemented largely through research, publication, and inservice efforts paid for by states and districts.
While the Rand Study focused on all educational programs, the current study focused on an educational innovation for technology education. The historical ties of technology education to vocational education and industrial arts, contrasted with the newly emerging technologies of today, result in many factors that may have affected the results of this study. Developmental work at the Jackson's Mill Symposium, The Ohio State University, and the Standards for Industrial Arts Program Project all exhibited a continual reevaluation and understanding by leaders in the field prior to the Technology for All Americans Project. Equitable funding through Perkins Grants has helped in the restructuring of classrooms into modern technology education laboratories.
The Rand Study presented five conclusions on how the characteristics of school districts and projects affected project outcomes of the innovations. First, the educational methods used by a project had a limited effect on implementation and continuation. Second, project resources were poor predictors of outcomes. Third, a more ambitious project scope was more likely to stimulate teacher change and involvement. Fourth, active commitment by district and site leaders was essential to project success and continuation. Fifth, implementation strategies developed locally dominated change agent projects. Teacher networks, strong local capacity and will, and enabling teachers to implement change are still critical factors in implementing educational innovations ( Crandall, 1989 ; McLaughlin, 1991 ). None of these Rand Study conclusions were contradicted by the current study.
Summary
Larsen (1985) stated that public organizations find it difficult to introduce new ideas. The use of innovations may require lengthy negotiation, planning, testing, and the establishment of support and consolidation. The Standards for Technological Literacy and other content standards have followed this prescribed path of implementation.
The reported level of implementation of the technology standards in Florida after only three years is notable. This may be a result of the close consultations that the International Technology Education Association had with the National Council of Teachers of Mathematics and the National Science Association. It may be a reflection of the depth of inservice training provided across Florida by the state supervisor of technology education working with the Florida Technology Education Association. The Standards for Technological Literacy were adapted into the Florida Curriculum Frameworks for technology education in 2002. The state has provided standards-based curriculum materials developed by the Center to Advance the Teaching of Technology and Science (CATTS), a project of the ITEA, to teachers and districts. Finally, Florida teachers are involved in many standards-based pilot programs like the Tech-know Project, headquartered at North Carolina State University and directed by Dr. Richard Peterson.
The variability in the levels of implementation across Florida districts is a reminder that more will have to be done to realize the goal of helping students become technologically literate. With a sustained effort, legislative and educational leaders can transform the content standards into an effective instrument for the fundamental change of technology education classrooms and students, as envisioned by the national association.
References
Berman, P., & Pauly, E. (1975). Federal programs supporting educational change, vol. 2: Factors affecting change agent projects (Research Rep. No. R-1589/2-HEW). Santa Monica, CA: Rand. (ERIC Document Reproduction Service No. ED 108 324)
Betances, C. (1999). From professional development to practice: Factors in the implementation of standards-based curriculum and instruction (Doctoral dissertation, The George Washington University, 1999). Dissertation Abstracts International, 60 , 02A.
Cousins, J., & Leithwood, K. (1993). Enhancing knowledge utilization as a strategy for school improvement. Knowledge: Creation, Diffusion, Utilization 14 , 305-33.
Crandall, D. (1989). Implementation aspects of dissemination: Reflections toward an immodest proposal. Knowledge: Creation, Diffusion, Utilization, 11 , 79-106.
Dugger, W., & Naik, N. (2001). Clarifying misconceptions between technology education and educational technology. The Technology Teacher, 61 (1), 31- 35.
Fullan, M. (1991). The new meaning of educational change . New York: Teachers College Press.
Havelock, R. (1976). Planning for innovation through dissemination and utilization of knowledge (6 th ed.). Ann Arbor, MI: Center for Research on Utilization of Scientific Knowledge.
International Technology Education Association. (2000). Standards for technological literacy: Content for the study of technology . Reston, VA: Author.
Larsen, J. (1980). Information utilization in community mental health centers (Doctoral dissertation, University of California, Santa Cruz, 1980). Dissertation Abstracts International .
Larsen. J. (1985). Effect of time on information utilization. Knowledge: Creation, Diffusion, Utilization, 7 (2), 143-159.
McLaughlin, M. (1991). The Rand change agent study: Ten years later. In A. Odden (Ed.), Educational policy implementation . (pp. 143-156). New York: State University of New York Press.
National Research Council. (2002). Investigating the influence of standards: A framework for research in mathematics, science, and technology education . I. Weiss, M. Knapp, K. Hollweg, and G. Burrill (Eds.), Committee on Understanding the Influence of Standards in K-12 Science, Mathematics, and Technology Education, Center for Education, Division of Behavioral Sciences and Education. Washington, DC: National Academy Press.
Newberry, P. (2001). Technology education in the U.S.: A status report. The Technology Teacher, 61 (1), 8-12.
Odden, A. (1991). New patterns of education policy implementation and challenges for the 1990s. In A. Odden (Ed.), Educational policy implementation . (pp. 297-328). New York: State University of New York Press.
Rogers, E. (1995). Diffusion of innovations (4 th ed.). New York: Free Press.
____________________
Thomas Loveland ( Loveland.Thomas@spcollege.edu ) is Professor and charter faculty member of the new undergraduate Technology Education program at St. Petersburg College in Florida.