JTE v26n1 - A Comparative Analysis of Spatial Visualization Ability and Drafting Models for Industrial and Technology Education Students
A Comparative Analysis of Spatial Visualization Ability and Drafting Models for Industrial and Technology Education Students
Howard Gardner explained spatial intelligence as one of the basic human intelligences, "the ability to perceive the visual–spatial world accurately and to perform transformations on those perceptions" (as cited in Lieu & Sorby, 2009 , p. 3–2). More specifically, spatial visualization is the ability "to imagine the rotation of a depicted object, the folding and unfolding of flat patterns, and the relative changes of positions of objects in space" ( Miller & Bertoline, 1991 , p. 9). According to Thurstone (1938) , this spatial ability is a critical component of intellectual ability. Furthermore, Thurstone (1950) identified seven factors related to human intelligence with three specifically referring to visual orientation in space:
- S 1 : "The ability to recognize the identity of an object when it is seen from different angles" (p. 518).
- S 2 : "The ability to imagine the movement or internal displacement among the parts of a configuration" (p. 518).
- S 3 : "The ability to think about those spatial relations in which the body orientation of the observer is an essential part of the problem" (p. 519).
Spatial vision (or developed spatial reasoning) is known "as the most [fundamental and] rewarding part of engineering graphics instruction" ( Contero, Naya, Company, & Saorín, 2006 , p. 472). Improving students' spatial skills is considered to be an important component in technical education, which is typically found in the first–year Technology Education and Industrial Technology curriculum. It is critical that students develop spatial skills early in engineering curriculum in order to ensure success throughout their program and, thus, promote retention ( Sorby, 2009 ).
For this study, the following was the primary research question: Is there a difference in spatial visualization ability, as measured through technical drawings, among the impacts of model types (2D drawing, 3D computer generated drawing, and 3D printed object)?
The following hypotheses will be analyzed in an attempt to find a solution to the research question:
H 0 : There is no difference in spatial visualization ability, as measured through technical drawings, among the impacts of model types (2D drawing, 3D computer generated drawing, and 3D printed object).
H A : There is an identifiable difference in spatial visualization ability, as measured through technical drawings, among the impacts of model types (2D drawing, 3D computer generated drawing, and 3D printed object).
Review of Literature
There has been a great deal of research on what is needed to prepare students for careers in engineering and technology. First and foremost is the basic and critical skill known as spatial ability. Spatial cognition is known as the "underlying mental process that allows an individual to develop spatial abilities" ( Miller & Bertoline, 1991 , p. 8). Lohman and Kyllonen (1983) identified three major spatial factors used to test the spatial abilities of an individual: spatial relations, spatial orientation, and spatial visualization. We use the following definitions for these three factors:
- Spatial Relations: "The ability to imagine rotations of 2D and 3D objects as a whole body" ( Martín–Dorta, Saorín, & Contero, 200 8, p. 506)
- Spatial Orientation: "The ability to orient oneself physically or mentally in space" ( Maier, 1998 , p. 71).
- Spatial Visualization: The "ability to mentally manipulate, rotate, twist, and pictorially invert presented visual stimuli" ( Gorska & Sorby, 2008 , p. 1).
According to Contero, Naya, Company, & Saorín (2006) , visualization skills have a learning outcome "described as the ability to picture three–dimensional shapes in the mind's eye" (p. 472). It is widely known that spatial visualization skills and mental rotation abilities are critical for technical and engineering professions. According to Norman (1994) , a learner's spatial skills are the most important and significant predictor for success in manipulating objects and interacting with computer–aided design. Recognizing the importance of spatial abilities for engineering and technology fields and the instructional tools used, it is important that students with poor spatial skills improve through appropriate instructional techniques. Sorby (2012) , states that "students who have the opportunity to improve their spatial visualization skills demonstrate greater self–efficacy, improved math and science grades and are more likely to persist in engineering" (p. 1).
"Improving the spatial–visualization ability of engineering and technology students is a challenge for educational researchers ( Ferguson, Ball, McDaniel, & Anderson, 2008 , p. 2). Although research has revealed "that spatial visualization ability can be improved through instructional methods," there is no "clear consensus on what combination and duration of instructional methods is most beneficial for improving spatial visualization ability" ( Ferguson et al., 2008 , p. 2). According to Contero et al. (2006 ), in order to shift from a teacher–centered to a student–centered education paradigm model, there must be a critical analysis of the varying engineering courses included in the curriculum. Furthermore, "teachers of 'engineering graphics' should put the emphasis in spatial reasoning, since we do consider it to be a core competence for future engineers" ( Contero et al., 2006 , p. 471).
Some researchers have suggested that spatial ability can be enhanced and taught through certain instructional designs ( Alias, Black, & Gray, 2002 ; Kwon, 2003 ; Lajoie, 2003 ; Potter & van der Merwe, 2001 ; Woolf, Romoser, Bergeron, & Fisher, 2003 ). Other researchers have demonstrated that instructions using computer–based 3D visualizations can provide learners with adequate classroom experiences for developing their spatial ability ( Kwon, 2003 ; Woolf et al., 2003 ). However, few empirical studies have established the causal relationships in greater depth ( Wang, Chang, & Li, 2006 ). Moreover, few studies have explored the effects of two–dimensional versus three–dimensional media representations on the influence of the spatial ability of undergraduate students ( Wang, Chang, & Li, 2006 ). Of the tools applied for improving spatial abilities, "sketching and drawing are . . . the most frequently used" ( Contero et al., 2006 , p. 473). According to Alias Black, and Gray (2002) , spatial visualization can be improved in engineering students through activities predominantly consisting of free–hand sketching and object manipulation.
Assessment of Spatial Abilities. The assessment of spatial abilities is critical to ensure transfer of learning, as is the deployment of appropriate instructional tools for a learner's development. Assessing a learner's spatial skills can be done using several instruments. A few of the most common tests are described in the following paragraphs.
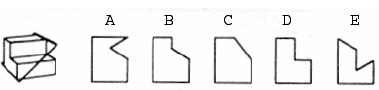
Mental Cutting Test. The Mental Cutting Test (MCT), a part of the Special Aptitude Test in Spatial Relations ( College Entrance Examination Board [CEEB], 1939 ), was first developed as a university entrance exam consisting of 25 items with 20 minutes provided for solving. Each problem consists of a 3D criterion figure on the left side of the stated problem, showing an imaginary cutting plane through the image. The learner must choose the correct one resulting from the cross–section from five alternative images (see Figure 1). The MCT measures both spatial visualization and spatial relations.
Differential Aptitude Test. The Differential Aptitude Test is composed of multiple separate tests assessing verbal and numerical reasoning, mechanical reasoning, perceptual ability, spatial relations, abstract reasoning, spelling, and language use. One of these assessments, the Differential Aptitude Test: Space Relations (DAT:SR), specifically measures a learner's ability to move from 2D to 3D world ( Lieu & Sorby, 2009 ). It consists of 50 items that require the learner to "mentally fold" the 2D pattern and choose the correct 3D object, which would result given the original 2D pattern, from four alternatives (see Figure 2).
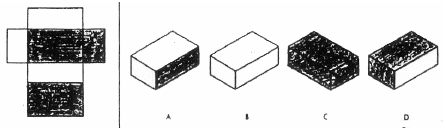
Figure 2. Differential Aptitude Test: Space Relations (DAT:SR) example problem ( Bennett, Seashore, & Wesman, 1973 ).
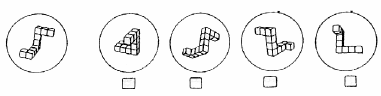
Mental Rotation Test. The Mental Rotation Test (MRT) consists of 20 items that require the learner to compare two–dimensional drawings and three–dimensional geometric figures. Developed by Vandenberg & Kuse (1978) , the MRT assesses spatial visualization and mental rotation components. Each item on the MRT consists of five line drawings, which includes a geometrical target figure (criterion figure) on the left that is then followed by two reproductions of the target rotated and two distractors. The learner is required to indicate which two of the four represented are the actual rotated replicas of the geometrical target figure on the left ( Caissie, Vigneau, & Bors, 2009 ; Gorska & Sorby, 2008 ). The learner has a time constraint of 4 minutes for the first 10 items, and after a short break, 4 minutes are given to solve the remaining ten (see Figure 3).
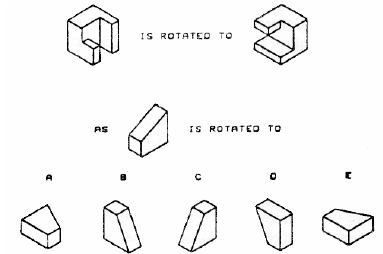
Purdue Spatial Visualization Test: Visualization of Rotations. The Purdue Spatial Visualization Test: Visualization of Rotations (PSVT:R), developed by Guay (1977) , presents the learner with a criterion object and a view of the same object after it is rotated. The PSVT:R is one section of the Purdue Spatial Visualization Test that includes three sections (Developments, Rotations, and Views) and consists of 12 questions per section for a total of 36 questions. The PSVT:R consists of 12 questions, each showing an object in two different positions. The first shape is rotated on the X –, Y –, or Z –axis to second shape, which is shown to demonstrate the rotation pattern. Another object is shown accompanied by five different rotated views. The learner is asked to indicate which of the options is the correct view representing the next rotation in the pattern (see Figure 4). In a study conducted by Sorby (2007) , the PVST:R was shown to be a significant predictor in the success of learners in engineering design courses.
Methodology
A quasi–experimental study was selected as a means to perform the comparative analysis of spatial visualization ability during the spring semester of 2014. The study was conducted in a materials process course, STEM 231, offered at Old Dominion University as part of the STEM program. The population of the study included the course participants. Because STEM 231 contains several hands–on projects in which instruction through demonstration is common, the researchers felt that the group was appropriate. This course introduced the students to basic content and skills needed to process common materials and produce functional products using woods, metals, plastics, and composite materials. This course also included engineering graphics and visualization techniques used to develop technical drawings and prototypes, emphasizing "hands on" practice using 2D and 3D AutoCAD software in the computer lab along with the various methods of editing, manipulation, visualization, and presentation of technical drawings. The participants from the study are shown in Table 1. Of the 35 students, three were female, and five were African American. A convenience sample was used with near equal distribution of participants between the three groups.
Table 1.
Research Design Methodology
| Group | Sample | Test | Model type |
| Group 1 | n 2 = 12 | MRT | Sketch from 3D image |
| Group 3 | n 3 = 12 | MRT | Sketch from 3D object |
| Group 1 | n 1 = 12 | MRT | Sketch from 2D drawing |
The students attending the course during the spring semester of 2014 were divided into three groups according to the section of the course in which they chose to participate in the semester prior to the study. The three groups ( n 1 = 12, n 2 = 12, and n 3 = 11), with an overall population of N = 35, were presented with a visual representation of an object (drafting model) and were asked to rotate the model and create a technical drawing of it (see Figure 5). The first group ( n 1) received a 2D drawing of the block (see Figure 6), the second group ( n 2) received a 3D PC generated image of the block (see Figure 7), and the third group ( n 3) received a 3D printed block using a 3D rapid prototyping machine (see Figure 8). In addition, all groups were asked to complete the MRT instrument 2 days prior to the completion of the rotational view technical drawing to identify each student's level of visual ability and to show that all three groups were close to equal.
The MRT is one of the most commonly used instruments for measuring spatial ability ( Caissie et al., 2009 ). Reliability of the instrument has been found satisfactory; test–retest correlation was reported at .83 following an interval of one year or more ( Vandenberg & Kuse, 1978 ). The MRT has been used to measure spatial abilities in relation to graphics and design curricula ( Contero et al., 2006 ; Gorska & Sorby, 2008 ; Sorby, 2007 ).
Upon completion of the MRT, the instructor of the course placed the 2D drawing, 3D computer generated image, and 3D printed object in a central location in the classroom (the three groups were positioned in three different rooms) and asked the students to rotate the model in a similar view as seen in Figure 5 and create a new technical drawing (see Figure 5). In this study, all groups were given a different representation of the same block (see Figures 6, 7, 8).
The rubric used to evaluate the correctness of the students' technical drawings was the same one used to evaluate previous drawings at the beginning of the course and included: (a) right orientation of axis, (b) use of correct proportion, (c) accurate angle used for isometric perspective, (d) appropriate use of visible lines, and (e) appropriate use of drawing space. Maximum score for the technical drawing was six points.
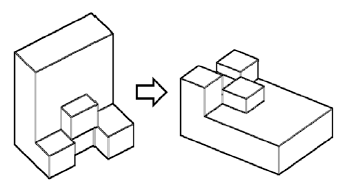
Figure 5. Student example for drawing rotation.

Figure 6. 2D drawing.
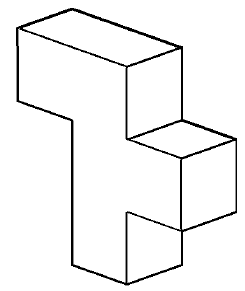
Figure 7. 3D computer generated drawing.
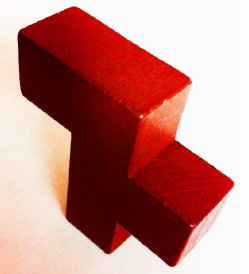
Figure 8. 3D printed object using additive technology.
Data Analysis
Analysis of MRT Scores
The first method of data collection involved the completion of the MRT instrument prior to the treatment to show how close all three groups were to equal. A one–way ANOVA was run to compare the mean scores for significant differences. With a mean score of 0.209, there were no significant differences between the three groups as measured by the MRT instrument (as shown in Table 2).
The researchers graded the MRT instrument as described in the guidelines of the MRT creators. A standard paper–and–pencil MRT was conducted to test ability in which the subjects were instructed to look at a drawing of a given object and find the same object within a set of dissimilar objects. The maximum score that can be received on the MRT is 20. As shown in Table 3, n 1 had a mean of 17.18, n 2 had a mean of 16.10, and n 3 had a mean of 17.31.
Table 2.
MRT Scores ANOVA Table
| Sum of Squares | df | Mean Square | F | Sig. | |
| Between Groups | 101.951 | 2 | 50.976 | 1.647 | .209 |
| Within Groups | 990.459 | 32 | 30.952 | ||
| Total | 1092.411 | 34 |
Analysis of Technical Drawing
The second method of data collection involved the creation of a rotational view drawing. As shown in Table 4, the group that used the 2D drawing as visual aid (referred to as 2D) had a mean observation score of 4.26. The groups that used the 3D computer generated visual (referred to as 3D PC) and the 3D printed solid block (referred to as 3D Solid) had higher scores of 5.13 and 5.68, respectively. A one–way ANOVA was run to compare the mean scores for significant differences among the three groups. The result of the ANOVA test, as shown in Table 5, was significant: F (2, 32) = 5.27, p < 0.01. The data was dissected further through the use of a post hoc Tukey's honest significant difference (HSD) test. As shown in Table 6, the post hoc analysis shows statistically significant differences between 3D Solid vs. 3D PC ( p = 0.446, d = –0.5), 3D Solid vs. 2D ( p = 0.008, d = 1.41), and 3D Solid vs. 2D ( p = 0.1, d = 0.87).
Table 3.
MRT Descriptive Results
| Treatment | Mean | Lower Bound | Upper Bound | ||||
| 2D | 12 | 17.1875 | 6.00958 | 1.73482 | 13.3692 | 21.0058 | |
| 3D PC | 12 | 16.1042 | 5.20758 | 1.50330 | 11.7954 | 18.4129 | |
| 3D Solid | 11 | 17.3182 | 5.43034 | 1.63731 | 15.6700 | 22.9663 | |
| Total | 35 | 17.1429 | 5.66831 | 0.95812 | 15.1957 | 19.0900 |
Table 4.
Rotational View Drawing Descriptive Results
| Treatment | Mean | Lower Bound | Upper Bound | ||||
| 2D | 12 | 4.264 | 1.4363 | 0.4146 | 3.351 | 5.176 | |
| 3D PC | 12 | 5.139 | 0.9740 | 0.2812 | 4.520 | 5.758 | |
| 3D Solid | 11 | 5.682 | 0.5294 | 1.596 | 5.326 | 6.037 | |
| Total | 35 | 5.010 | 1.1854 | 0.2004 | 4.602 | 5.417 |
Table 5.
Rotational View Drawing ANOVA Results
| Quiz | SS | df | MS | F | p. |
| Between Groups | 11.844 | 2 | 5.922 | 5.274* | 0.010 |
| Within Groups | 35.930 | 32 | 1.123 | ||
| Total | 47.775 | 34 |
Table 6.
Rotational View Drawing Tukey HSD Results
| Visual Aids (1 vs. 2) | Mean Diff. (1–2) | ||
| 3D Solid vs. 3D PC | –0.5429 | 0.4423 | 0.446 |
| 3D Solid vs. 2D | 1.4179 | 0.4423 | 0.008 |
| 3D PC vs. 2D | 0.8750 | 0.4326 | 0.123 |
Discussion
The main purpose of the study was to determine significant positive effects among the use of three different types of drafting models and to identify whether any differences exist towards promotion of spatial visualization ability for students in Industrial Technology and Technology Education courses. In particular, the study compared the use of different types of drafting models (a 3D printed solid object, a 3D computer generated drawing, and a 2D drawing) using a technical drawing activity as the main assessment tool. It was found that the 3D printed solid model and 3D computer generated image both provided statistically significant higher scores than the 2D drawing. These findings are in agreement with a related study using engineering technology instead of industrial technology students, in which Katsioloudis and Jovanovic, (2014) found that students who received treatment via the 3D printed solid model outperformed their peers who received treatment from the other two models, although those findings were not statistically significant. This could indicate that, in both cases, students were better able to comprehend visual data given from 3D solid models over 3D computer generated models or 2D drawings. It should also be noted that when drafting models, students are primarily asked to recreate different views using 2D drawings. Using 3D solid models as visualizations aids for Industrial Technology and Technology Education courses has great potential to improve spatial visualization skills. While conducting the literature review to better focus this research, there appeared to be a lack of research related to drafting models and their ability to enhance spatial visualization ability. This research can help in understanding the optimal type of drafting model to be used in technology education and industrial technology courses, allowing for visualization ability to be enhanced.
With the current status of additive technologies, instructors have the ability to design and built almost any model in a very short amount of time. This small quasi–experimental study provides results related to the commonly used method of 2D visual modeling. Instead, it seems a 3D solid model gives the students a better understanding of the tasks being taught. However, based on the small amount of similar studies, it appears that more research is needed.
Future Plans
In order to better understand the ability for 3D solid models to aid student learning, future plans include, but are not limited to:
- Repeating the study to verify the results by using additional types of drafting models.
- Repeating the study using different populations, such as science and mathematics education students.
- Repeating the study by adding additional visual cues during the display of 3D objects, including shadows, lighting, and size.
- Repeating the study by comparing males vs. females because it has been suggested that males tend to do better on spatial ability tasks than females
Petros Katsioloudis (
pkatsiol@odu.edu
) is an Associate Professor in the Department of STEM Education and Professional Studies at Old Dominion University.
Vukica Jovanovic (
v2jovano@odu.edu
) is an Assistant Professor in the Department of Engineering Technology at Old Dominion University.
Mildred Jones (
mjones@odu.edu
) is a graduate student in the Department of STEM Education and Professional Studies at Old Dominion University.
References
Alias, M., Black, T. R., & Gray, D. E. (2002). Effect of instructions on spatial visualization ability in civil engineering students. International Educational Journal, 3 (1), 1–12. Retrieved from http://www.iejcomparative.org/data/volumes/v3n1.pdf
Bennett, G. K., Seashore, H. G., & Wesman, A. G. (1973). Differential aptitude test: Forms S and T . New York, NY: The Psychological Corporation.
Caissie, A. F., Vigneau, F., & Bors, D. A. (2009). What does the Mental Rotations Test measure? An analysis of item difficulty and item characteristics. The Open Psychology Journal, 2 , 94–102. doi:10.2174/1874350100902010094
College Entrance Examination Board. (1939). CEEB special aptitude test in spatial relations . New York, NY: Author.
Contero, M., Naya, D., Company, P., & Saorín, J. L. (2006). Learning support tools for developing spatial abilities in engineering design. International Journal of Engineering Education, 22 (3), 470–477.
Ferguson, C., Ball, A., McDaniel, W., & Anderson, R. (2008, November). A comparison of instructional methods for improving the spatial–visualization ability of freshman technology seminar students . Paper presented at the 2008 IAJC–IJME International Conference, Nashville, TN. Retrieved from http://ijme.us/cd_08/PDF/37_IT305.pdf
Gorska, R., & Sorby, S. (2008, June). Testing instruments for the assessment of 3–D spatial skills . Paper presented at the ASEE Annual Conference, Pittsburgh, PA.
Guay, R. (1977). Purdue Spatial Visualization Test: Visualization of Rotations . W. Lafayett, IN: Purdue Research Foundation.
Katsioloudis, P., & Jovanovic, V. (2014). Spatial visualization ability and impact of drafting models: A quasi–experimental study. Engineering Design Graphics Journal, 78 (2).
Kwon, O. N. (2003). Fostering spatial visualization ability through web–based virtual–reality program and paper–based program. Lecture Notes in Computer Science , 2713, 701–706. doi:10.1007/3-540-45036-X_78
Lajoie, S. P. (2003). Individual differences in spatial ability: Developing technologies to increase strategy awareness and skills. Educational Psychologist, 38 (2), 115–125. doi:10.1207/S15326985EP3802_6
Lieu, D. K., & Sorby, S. A. (2009). Visualization, modeling, and graphics for engineering design. Clifton Park, NY: Delmar, Cengage Learning.
Lohman, D. F., & Kyllonen, P. C. (1983). Individual differences in solution strategy on spatial tasks. In R. F. Dillon & R. R. Schmeck (Eds.), Individual Differences in Cognition (Vol. 1, pp. 105–135). New York, NY: Academic Press.
Maier, P. H. (1998). Spatial geometry and spatial ability: How to make solid geometry solid? In E. Osnabrück, K. Cohors–Fresenborg, G. Reiss, G. Toener, & H. Weigand (Eds.), Selected papers from the annual conference of didactics of mathematics 1996 (pp. 63–75). Munich, Germany: Gessellschaft für Didaktik der Mathematik (GDM),.
Martín–Dorta, N., Saorín, J. L., & Contero, M. (2008). Development of a fast remedial course to improve the spatial abilities of engineering students. Journal of Engineering Education, 97 (4), 505–513. doi:10.1002/j.2168-9830.2008.tb00996.x
Miller, C. L. & Bertoline, G. R. (1991). Spatial visualization research and theories: Their importance in the development of an engineering and technical design graphics curriculum model. Engineering Design Graphics Journal, 55 (3), 5–14.
Norman, K. L. (1994). Spatial visualization—A gateway to computer–based technology. Journal of Special Education Technology, 12 (3), 195–206.
Potter, C. & van der Merwe, E. (2001, August). Spatial ability, visual imagery and academic performance in engineering graphics . Paper presented at the International Conference on Engineering Education, Oslo, Norway. Retrieved from http://www.ineer.org/Events/ICEE2001/Proceedings/papers/498.pdf
Sorby, S. A. (2007). Developing 3D spatial skills for engineering students. Australasian Journal of Engineering Education, 13 (1), 1–11.
Sorby, S. A. (2009). Educational research in developing 3–D spatial skills for engineering students. International Journal of Science Education, 31 (3), 459–480. doi:10.1080/09500690802595839
Sorby, S. A. (2012). ENGAGE strategy research brief: Spatial visualization skills . Retrieved from http://www.wskc.org/documents/281621/307749/ENGAGE+Brief+-+Spatial+Skills.pdf/200fbd8f-41b2-47c3-b9dd-c53eaefdcac0?version=1.0
Thurstone, L. L. (1938). Primary Mental Abilities. Psychometrika Monograph No. 1 . Chicago, IL: University of Chicago Press.
Thurstone, L. L. (1950). Some primary abilities in visual thinking. Proceedings of the American Philosophical Society, 94 (6), 517–521. Retrieved from http://www.jstor.org/stable/3143593
Vandenberg, S. G., & Kuse, A. R. (1978). Mental rotations, a group test of three–dimensional spatial visualization. Perceptual and Motor Skills, 47 (2), 599–604.
Wang, H–C., Chang, C–Y., & Li, T–Y. (2006). The comparative efficacy of 2D– versus 3D–based media design influencing spatial visualization skills. Computers in Human Behavior, 23 (4), 1943–1957. doi:10.1016/j.chb.2006.02.004
Woolf, B., Romoser, M., Bergeron, D., & Fisher, D. (2003, July). Tutoring 3–dimensional visual skills: Dynamic adaptation to cognitive level. In Proceedings of the 11th International Conference on Artificial Intelligence in Education , Sydney, Australia.