JTE v26n1 - Exploring the Proposition of a Joint Conference Between State Science, and Technology and Engineering Education Associations
Exploring the Proposition of a Joint Conference Between State Science, and Technology and Engineering Education Associations
One of the key sessions presented at the co–located 2012 Mississippi Valley Technology Teacher Education Conference (MVTTEC) and Southeast Technology Education Conference (STEC) held in Nashville, Tennessee was Perspectives of the Future of Technology Education Professional Associations (Busby, 2012). Three reasons affecting declining conference attendance were highlighted: demographics, technology, and the economy. Professional teacher association conferences are a yearly gathering of members, whether at the state, national or international level. Joint or collaborative conferences occur when more than one professional association decides to join forces with another association to hold a combined conference. The organizations make these decisions at the board level and in conjunction with other organizations with similar or overlapping content. In 2013, the boards of the Technology and Engineering Educator Association of Maryland (TEEAM) and the Maryland Association of Science Teachers (MAST) decided to hold a joint annual professional development conference after years of declining attendance (Figure 1) and low vendor participation (Figure 2). The overlapping content shared by the two organizations was Science, Technology, Engineering, and Mathematics or STEM, and their intersecting mission was to promote and deliver STEM to Maryland students. The result of this decision was an increase in overall attendance and a 30 percent increase in total vendor participation.
Why do professional associations find themselves in this situation of declining interest in conferences and what should they do about it? What are professional associations doing in other states? What benefits accrue to attendees at joint conferences? The answers to these questions can help provide guidance to professional teacher associations in more than just the fields of science, and technology and engineering (T&E) education.
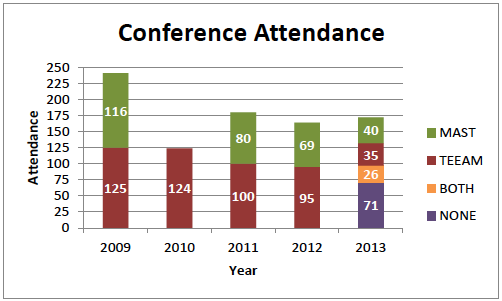
Figure 1. Summary of past Maryland Association of Science Teachers (MAST) and Technology and Engineering Educators Association of Maryland (TEEAM) conference attendance. Note: In 2010 MAST held their annual conference as part of the National Science Teachers Association (NSTA)'s area conference in Baltimore, therefore there was no way to extract a valid MAST attendance number for this year. For the 2013 joint conference, attendees were given the option to purchase an annual membership to MAST, TEEAM, both, or none of the associations during registration.
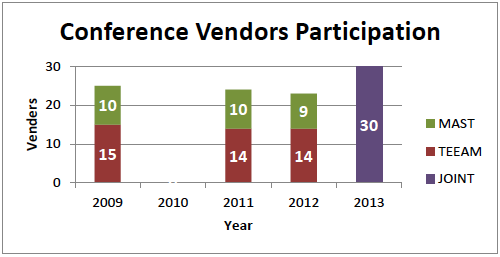
Figure 2. Summary of past MAST and TEEAM conference vendors participating. In 2010, neither MAST nor TEEAM solicited vendors for their conferences.
Background and Purpose
Professional teacher associations at the national and state level were formed to provide a means for teachers to network with other professionals, share resources and knowledge, increase professional development for members, broaden the impact in the field, and increase influence in society ( Arendale et al., 2009 ; Paino & Briskin, 2012 ). The International Technology and Engineering Educators Association (ITEEA), American Association for the Advancement of Science (AAAS), National Science Teachers Association (NSTA), and the National Council for Teachers of Mathematics (NCTM) are national associations linked to STEM education. At the state level, teacher organizations like TEEAM and MAST represent content teachers and promote their fields statewide. Activities by professional associations may include a statewide central office, legislative lobbying, yearly or monthly publications, workshops, and an annual state professional development conference.
Professional development conferences include general business meetings, committee meetings, awards events, workshops, vendor showcase, and opportunities for attendees to network. Conferences provide attendees many benefits including the opportunity to listen to other experts, present research and classroom applications, get involved in the organization, and access resources ( Hickson, 2006 ). Bell (2009) discusses two components of social support from conference attendance: affective and instrumental. Affective support occurs from meeting colleagues and friends while sharing a positive experience. Instrumental support occurs from learning new instructional strategies and processes from attending workshops, visiting vendors, and discussing technological solutions with other attendees in formal and informal settings. Cherrstrom (2012) emphasizes the ability of attendees to advance their content knowledge, skills, and careers. For new attendees, a greater understanding of the depth and breadth in the content field often results. The level of benefit received is tied to whether the participation is that of a spectator, consumer, or constructor. At the highest level, constructor, the attendee identifies conference connections and maximizes their experience.
McAlister (2012) researched members of the Mississippi Valley Technology Teacher Education Conference (MVTTEC) and found that benefits of professional conference attendance were grouped in three areas: ability to gain information while staying up–to–date, making personal and professional connections, and valuing the opportunity for discussion and exchange of new ideas. Hickson (2006) elaborated on these ideas by discussing the concept of a contagion effect. Attendees who present at conference sessions or panels become more excited and enthusiastic about doing research. These experiences in younger attendees can have a positive relationship on their future productivity as publishers of research. With so many documented benefits, professional organization conferences should be overflowing with attendees. Is this the case?
Attendance at national and state professional conferences has been trending down for some time. One of the main reasons is the cost of attendance which may include registration, travel, overnight accommodations, meals, and special conference costs ( McAlister, 2013 ). For many teachers and teacher educators, the source of travel funding at the departmental level is drying up ( Arendale et al., 2009 , Bell, 2009 , Cherrstrom, 2012 , Hickson, 2006 ). In addition, at the state level, professional association conferences may be scheduled on the state in–service date. Many school districts opt to hold their own in–service training in county, thereby blocking teachers from going to their state content conferences.
The authors surveyed state technology and engineering education professional association presidents, who indicated declining enrollments and economic efficiency as a main reason for considering what form of professional development conference to organize. Twenty presidents from an identified list of 40 state technology education associations responded to the survey. Ten of the 20 state association presidents indicated that they are currently holding joint conferences with other content areas of career and technical education, STEM, manufacturing and engineering, agriculture education, or graphics and communications. Reasons for joint professional development conferences included increased attendance, commonality of issues, overlapping content, and mutual dependence for survival. One concern raised was how to equitably distribute conference income.
Joint or collaborative professional conferences between associations have resulted from these points. At the national level, every three years the MVTTEC holds a co–located conference with the STEC. The MVTTEC was traditionally organized around the states touching the Mississippi River and the STEC organization was located in the southeastern United States. Declining attendance and the need for economic efficiencies prompted both organizations to begin co–located conferences.
District supervisors from science and technology and engineering education who attended the combined MAST and TEEAM conference in Maryland indicated that the inclusion of engineering design standards in the Next Generation Science Standards ( NGSS, 2013 ) and national emphasis on the Common Core State Standards ( CCSS, 2012 ) made for increased collaboration and discussion by teachers and supervisors. An anonymous science supervisor in attendance stated:
There's an engineering piece in the NGSS that a lot of science teachers I don't think feel as comfortable with. I think it puts us with people who are much more comfortable with that and allows us to really naturally collaborate the way STEM educators can (personal communication, October 18, 2013).
Statement of the Problem
State teacher associations may consider holding collaborative professional development conferences with other associations. Information about the economic benefits of co–joining conferences is clear. What is not clear is whether there are other benefits of professional development in a collaborative environment among state associations. The following research questions helped guide the study to focus on this issue.
Research Questions
RQ1: How do Maryland Science and Technology and Engineering (T&E) education teachers and administrators/supervisors perceive the value of a joint conference?
RQ2: To what extent do science and T&E education professionals (teachers and administrators/supervisors) attend conference sessions outside of their field?
RQ3: As the result of a joint conference, do science and T&E education professionals report an identifiable difference in understanding and application of content within and outside of their content fields?
RQ4: What perceptions do Maryland science and T&E professionals have regarding the value of joint conferences at the national level?
Study Participants
Participation in the study was open to anyone whom attended the first annual MAST/TEEAM joint conference in October 2013. Specifically, the participants were K–12 teachers, supervisors, and vendors from a variety of STEM disciplines, mostly science and technology and engineering education. Of the 172 individuals that attended the conference, 76 teachers, administrators, and supervisors, as well as 23 vendors voluntarily participated in the surveys. There were also 14 individuals that voluntarily participated in interviews. This conference sample was chosen based on the unique collaborative environment created by holding a joint conference for the first time between the science education and the technology and engineering education professional associations in Maryland. Table 1 and Table 2 provide general demographic information collected about the attendees, vendors, and interviewees. From the 76 survey responses, nine self–identified as "other"or "multiple"content areas were eliminated from the data set to ensure a clean distinction between science and T&E professionals. This resulted in a total of 67 attendee responses to analyze. The majority of science (62%) and T&E attendees (55%) that participated in the study were between the ages of 31–50 (Generation X), while the Baby Boomer generation (51 and above) made up the next largest portion of responses, and Generation Y (21–30) had the least amount of responses. Both the majority of science (55%) and T&E (70%) responses were predominantly professionals working at the high school level, and most were teachers of science (89%) or T&E (67%). Among the entire sample, the mean number of years that attendees reported working in science and technology and engineering education was approximately 14. Within the past 3 years, 23% of the participants had attended a MAST conference and 27% had attended a TEEAM conference.
Table 1
Science Attendee Survey Demographics
| Age Range | n – (%) | Position | n – (%) | Grade Level | n – (%) |
|---|---|---|---|---|---|
| 21–30 | 7 – (16%) | Teacher | 39 – (89%) | Elementary | 11 – (13%) |
| 31–50 | 28 – (62%) | Administrator/Supervisor | 5 – (11%) | Middle School | 27 – (32%) |
| 51+ | 10 – (22%) | High School | 46 – (55%) |
Table 2
Technology and Engineering Attendee Survey Demographics
| Age Range | n – (%) | Position | n – (%) | Grade Level | n – (%) |
|---|---|---|---|---|---|
| 21–30 | 2 – (9%) | Teacher | 18 – (67%) | Elementary | 0 – (0%) |
| 31–50 | 12 – (55%) | Administrator/Supervisor | 4 – (33%) | Middle School | 7 – (30%) |
| 51+ | 8 – (36%) | High School | 16 – (70%) |
Individuals were purposefully selected for face–to–face interviews based on their content area to ensure a good breadth of disciplines represented. The interviews were conducted at the conference with two science teachers, three T&E teachers, three science administrators/supervisors, three T&E administrators/supervisors, two science vendors, and one T&E education vendor.
Methodology
Permission to collect data at the first annual MAST/TEEAM conference was granted by the MAST and TEEAM conference board committees. Approval to use the retrospective pretest instrument (called pre–posttest instrument for this study) was obtained from Jeff Allen, and approval to conduct research using human subjects was obtained from the Institutional Review Board at Virginia Tech. The research design employed a convergent, sequential mixed methods design ( Creswell & Plano–Clark, 2011 ) with mixing occurring only at the analysis phase. This method was used because it allowed the researchers to better understand the perceptions of teachers, administrators, and vendors regarding joint conferences by triangulating quantitative survey data with rich, in–depth detail from qualitative interviews ( Creswell & Plano–Clark, 2011 ; Tillotson & Young, 2013 ).
Items in the retrospective pre–posttest survey instrument developed by Allen and Nimon (2007) were adapted by adding the words "science education"or "technology and engineering education"to address research questions 1 and 3, and examine attendees' perceptions of a joint STEM conference. A panel of state and county supervisors, college faculty, and veteran teachers from MAST and TEEAM reviewed the instrument before it was disseminated to conference attendees. Allen and Nimon (2007) demonstrated that the instrument's scale and subscales for assessing conferences through a retrospective method had strong reliability scores with alphas ranging from 0.788 to 0.970. Also, it is applicable to STEM education conferences, "Because this instrument was designed to be content neutral, its application extends across disciplines"(p. 38). The survey instrument consisted of 25 questions (8 demographic and 17 conference evaluations) and on average took participants 10 minutes to complete. It was comprised mainly of questions in multiple–choice format, along with questions utilizing a five–point Likert scale to measure the perceived learning gains derived from the difference in retrospectively reported pre to post–conference scores. Additionally there were a few questions allowing the opportunity for participants to explain their multiple–choice selection. Of the 17 survey questions, six measured reaction to the conference, six measured post–conference gains, and five measured perceptions about joint conferences. It was administered using Qualtrics, and solicited to attendees with a flyer displaying the survey link as well as a QR code when they registered at the conference site. This yielded 92 responses from the 172 attendees, 16 which were eliminated due to incompletion, and nine identified as multiple or other content areas were also removed from the data set to ensure two distinct groups (science and T&E professionals) could be identified to best examine the research questions relative to the scope of this study (investigating differences in perceived learning gains among science and T&E professionals as a result of a joint conference). This was not deemed to have a substantial impact on the findings due to the small sample (n=9) of professionals who identified as multiple or other content areas. The final result was a 39% response rate (67/172), which was considered to be fairly strong based on Nulty's (2008) analysis of online response rates.
Cronbach's Alpha was used to evaluate the reliability of the adapted instrument as Allen and Nimon (2007) determined the reliability of the original instrument. The alpha for the entire adapted instrument was determined to be 0.919, with alpha values for the conference reaction items resulting in 0.868. The retrospective conference learning questions produced an alpha of 0.773, while the post conference learning questions elicited an alpha of 0.900. These alpha scores determined that the instrument was reliable to use for assessing learning that resulted from this conference.
Research Questions 2 and 4 were evaluated through supplemental questioning of participants. During the conference one of the researchers used purposeful sampling to ensure a good mix of teachers, administrators/supervisors, and vendors from science and T&E education for the interviews. The interviews were recorded and emergent themes from each were discussed among the researchers to build consensus. After the quantitative analysis was completed, the researchers mixed the qualitative interview responses with the quantitative data to provide more detailed explanations that were not elicited from the survey responses alone.
The mixing of data collected from attendee surveys, vendor surveys, attendee and vendor interviews, conference registration, and a survey of presidents from state professional T&E education associations strengthened the findings of the study, and could contribute to future research examining the validity of the instrument. All of these data collection methods were mixed after analyzing them separately, and they all displayed similar results regarding joint conferences and collaboration among science and T&E education professional associations. The individual analysis and mixing of these various data collection methods are described in the following section.
Data Analysis and Findings
Quantitative Data Analysis
It was determined that a Wilcoxon matched pairs test was best suited for the data analysis in this study since the researchers could not guarantee a normally distributed sample was used in relation to the entire population of science and T&E professionals in Maryland. A test examining Cohen's d for a post hoc matched pairs Wilcoxon test was conducted using the G*Power software, and used to analyze the power of the sample size obtained from the retrospective pre–posttest. From this power analysis it was indicated that the test as administered with 67 participants, would have a strong d (0.87) ( Prajapati, Dunne, & Armstrong, 2010 ) and it was acceptable to continue data analysis procedures by conducting Wilcoxon tests. Wilcoxon hypotheses tests were conducted using SPSS to determine if there were statistical differences between teachers' and administrators'/supervisors' perceptions, and science and T&E professionals' perceptions of a joint conference. These tests were also conducted to examine the differences between science and T&E educators' understanding of science and T&E content, ability to demonstrate comprehension of science and T&E content, and ability to apply science and T&E content. The differences between pre and post scores were calculated from participant responses, and then paired with other difference scores either within or outside of the professionals' content fields. For example, reported differences of science professionals' understanding of science content were analyzed for significantly different gains from T&E professionals' reported differences in understanding of T&E content (both within their content fields). In addition, perceived gains in science professionals' understanding of T&E content and T&E professionals' understanding of science content (outside of their content fields) were analyzed. This analysis process was conducted for all questions examining overall conference perceptions and differences in post–conference gains. The critical alpha value was set at 0.05 for these tests.
The first evaluated null hypothesis was: There is no difference in perceptions of a joint conference between teachers and administrators/supervisors. This hypothesis was evaluated in Table 3 using a Wilcoxon matched pairs test. The p–value (0.705) was determined to be greater than 0.05, therefore the null hypothesis failed to be rejected. The analysis of data suggests that there is no statistically significant difference between teachers' and administrators'/supervisors' perceptions of a joint conference; however, they both favorably rated the conference a four on a five point Likert–type scale.
Table 3
Wilcoxon Matched Pairs Test for Difference Over Time on Perception of a Joint Conference Between Positions
| Group | n | Median | IQR | Test Stat. | p |
|---|---|---|---|---|---|
| Teachers | 57 | 4.0 | 1 | –0.378 | 0.705 |
| Administrators/Supervisors | 9 | 4.0 | 0.5 |
The second null hypothesis which investigated the perceptions between science and T&E professionals regarding a joint conference was: There is no difference in perceptions of a joint conference between science and T&E education professionals. Again a Wilcoxon matched pairs test was used to analyze the data (Table 4). Since the analysis of science and T&E professionals' perceptions of a joint conference resulted in a p–value (0.130) above 0.05, the null hypothesis failed to be rejected. Despite both professional groups again reporting high median scores (4), it was determined that there was no statistical difference between science and T&E professionals' perceptions of a joint conference. Once more, professionals from both groups identified a consistent level of perceived benefit from the conference.
Table 4
Wilcoxon Matched Pairs Test for Difference Over Time on Perception of a Joint Conference Between Content Areas
| Group | n | Median | IQR | Test Stat. | p |
|---|---|---|---|---|---|
| Science | 45 | 4.0 | 1 | –1.513 | 0.130 |
| T&E | 22 | 4.0 | 0 |
The second research question was developed by the researchers as a supplemental question and added to the retrospective survey instrument. It identified that overall 40 percent (27/67) of conference attendees attended sessions primarily in their content area, 54 percent (36/67) attended mixed sessions, and six percent (4/67) attended sessions primarily out of their content area. Both science and T&E professionals primarily attended mixed sessions, however T&E professionals were more willing to attend sessions that were mixed or outside of their content area (14/22, 64%) than science professionals (25/44, 57%) as displayed in Figure 3.
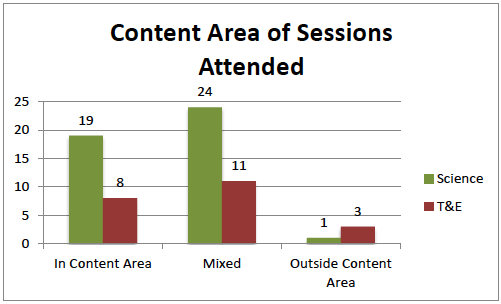
Figure 3. Responses from science and T&E attendees regarding what types of sessions they attended in relation to their content area.
To investigate the third research question of whether science and T&E education professionals reported an identifiable difference in perception of understanding and the application of content within and outside of their fields, three different null hypotheses were tested with Wilcoxon matched pairs tests. The first null hypothesis was: Science and T&E professionals do not report significant differences among increased understanding of the content within and outside of their fields from attending the joint conference. In Table 5 the p–value of differences among science and T&E professionals' understanding of content within their content fields (0.034) signify that there is a statistically significant difference between each groups' perceived gains in understanding of content within of their field, failing to reject the null hypothesis. Further analysis of the professional groups (Table 6) did not report a statistically significant difference in gains (0.257) regarding understanding of content outside of their fields. Therefore, in regards to understanding of content outside of their fields, the null hypothesis was not rejected. While analyses of the professional groups only reported significantly different gains in understanding content within their fields, an identifiable difference was seen between the pre and post median scores for both professional groups outside of their content fields.
Table 5
Wilcoxon Matched Pairs Test for Difference Over Time on Perceived Understanding of Content Within Their Content Fields
| Group | n | Pre Median | Post Median | IQR | Test Stat. | p |
|---|---|---|---|---|---|---|
| Science | 44 | 4.0 | 4.0 | 0 | –2.121 | 0.034 |
| T&E | 21 | 4.0 | 4.0 | 1 |
Table 6
Wilcoxon Matched Pairs Test for Difference Over Time on Perceived Understanding of Content Outside of Their Content Fields
| Group | n | Pre Median | Post Median | IQR | Test Stat. | p |
|---|---|---|---|---|---|---|
| Science | 44 | 3.0 | 4.0 | 0 | –1.134 | 0.257 |
| T&E | 21 | 3.0 | 4.0 | 1 |
Two more hypotheses were generated to explore whether science and T&E education professionals reported an identifiable difference in their perceived ability to demonstrate comprehension and application of content. These are different than the previous hypothesis which analyzed the perceived understanding of pure content. The second null hypothesis was: Science and T&E teachers do not report significant differences in increased ability to demonstrate comprehension of content within and outside of their fields from attending the joint conference. The ability to demonstrate comprehension of content may be exhibited through methods such as verbal questioning or standardized testing. Table 7 displays the analysis of data indicating a statistically significant difference reported by the groups of science and T&E professionals' perceived ability to demonstrate comprehension of content within their fields (0.014), again rejecting the null hypothesis. In addition to the significant difference, T&E professionals' pre and post median scores showed an increase, while the scores of science professionals remained constant. An analysis of the responses of the professional groups in Table 8 indicated no statistically significant (0.796) difference outside of their fields, causing the researchers to fail to the reject the null hypothesis regarding differences in the ability of both groups to demonstrate comprehension of content outside of their fields. Unlike the analysis within their fields, there was no identifiable difference among pre and post median scores outside of the content field for either professional group as a result of the joint conference.
Table 7
Wilcoxon Matched Pairs Test for Difference Over Time on Perceived Ability to Demonstrate Comprehension of Content Within Their Content Fields
| Group | n | Pre Median | Post Median | IQR | Test Stat. | p |
|---|---|---|---|---|---|---|
| Science | 44 | 4.0 | 4.0 | 0 | –2.449 | 0.014 |
| T&E | 21 | 4.0 | 5.0 | 1 |
Table 8
Wilcoxon Matched Pairs Test for Difference Over Time on Perceived Ability to Demonstrate Comprehension of Content Outside Their Content Fields
| Group | n | Pre Median | Post Median | IQR | Test Stat. | p |
|---|---|---|---|---|---|---|
| Science | 44 | 3.0 | 3.0 | 1 | –0.258 | 0.796 |
| T&E | 21 | 3.0 | 3.0 | 1 |
The final hypothesis investigating research question three examined the reported ability of science and T&E professionals to apply science or T&E content. This hypothesis differed from the previous two in its examination of science and T&E professionals' perceptions of how well they could apply content, within and outside of their field, to situations or problems in their classroom such as labs or engineering design activities. It was tested with the following null hypothesis: Science and T&E teachers do not indicate significant differences of increased abilities to apply content within and outside of their field. Analyses of responses (Tables 9 and 10) indicate there were no statistically significant differences between perceived ability of either professional group to apply content within (0.705) and outside of (0.739) their fields to a problem, leading the researchers to fail to reject the null hypothesis. It should be noted that despite the analyses of responses from both professional groups not reporting significant differences among their perceived ability to apply content within and outside of their fields, both analyses revealed identifiable differences in pre and post median gains for both groups. The analyses reported an increase in T&E professionals' perceived ability to apply content within their field, and an increase in science professionals' perceived ability to apply content outside of their field.
Table 9
Wilcoxon Matched Pairs Test for Difference Over Time on Perceived Ability to Apply Content Within Their Content Fields to a Problem
| Group | n | Pre Median | Post Median | IQR | Test Stat. | p |
|---|---|---|---|---|---|---|
| Science | 42 | 4.0 | 4.0 | 1 | –0.378 | 0.705 |
| T&E | 21 | 4.0 | 4.5 | 1 |
Table 10
Wilcoxon Matched Pairs Test for Difference Over Time on Perceived Ability to Apply Content Outside of Their Content Fields to a Problem
| Group | n | Pre Median | Post Median | IQR | Test Stat. | p |
|---|---|---|---|---|---|---|
| Science | 42 | 3.0 | 4.0 | 1 | –0.333 | 0.739 |
| T&E | 21 | 4.0 | 4.0 | 1 |
The analyses of this data for the third research question suggests that science and T&E professionals indicated statistically significant differences in their gains regarding understanding of content and ability to demonstrate comprehension of content within their fields. Despite the analyses of professional groups not showing a statistically significant difference in all areas, the analyses did reveal gains between the pre and post conference median scores in many categories. This supports the finding of a collective benefit from the various topics attended within and outside of their fields (Figure 3) between both groups of participants who attended the conference. Additionally, the reported gains in understanding and application of T&E knowledge by science professionals suggests that they may have been more focused on new directives to implement engineering content and practices mandated by the NGSS.
The fourth research question was included at the end of retrospective survey by the researchers as a supplemental question. It identified that overall 86 percent (56/65) of conference attendees would like to see a joint conference held between NSTA and ITEEA. This support for a joint conference was exhibited by both science and T&E professionals (Figure 4). Participants were asked to suggest other professional associations to hold a joint conference with using an open text field, of which attendees suggested the National Council of Teachers of Mathematics (NCTM) most frequently (7), followed by the American Association of Physics Teachers (AAPT) (3), NASA (2), the American Chemical Society (ACS) (2), and Technology Student Association (TSA) (1).
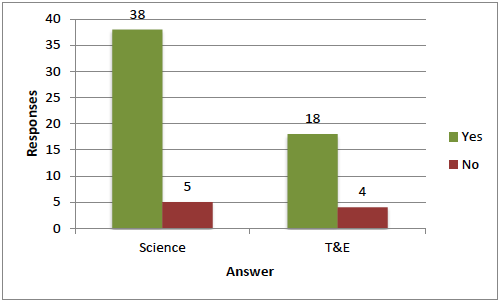
Figure 4. Responses from science and T&E attendees of whether or not they would like to see a joint conference held on a national level between NSTA and ITEEA.
Limitations
There are certain limitations to consider in regards to the instrumentation and statistical analysis of this study. Although Allen and Nimon (2007)'s retrospective pretest was not validated, they did find it to be a reliable method to obtain quantitative data regarding professional development conferences. This instrument provided a viable method for efficiently collecting data on a professional development conference. Despite the researchers efforts to stay as true as possible to the content of Allen and Nimon's (2007) original instrument, they used it to evaluate attendees' perceptions of the overall conference as opposed to each individual conference session as Allen and Nimon applied it. The questions were adapted to reflect this focus on the overall conference perceptions of science and T&E content. A limitation of using this methodology is that one session (especially the final session attended) may have had undue influence on an attendee's overall conference perception, skewing the reported median scores.
Another limitation of the adapted instrument was that participants were asked to self–report their perceptions as opposed to measuring them through observation or performance evaluations. Participants may have felt inclined to report gains in their perceptions for various reasons (e.g., bias to show personal growth at a conference through reporting gains), which the researchers attempted to remove by reminding participants that there were no consequences for responding. The retrospective pretest has been described as a useful but imperfect tool (Lamb, 2005) as seen in this study. Allen and Nimon (2007) caution that it can be successful in measuring learning and improvement gains when time and resources are limited.
While the results of this study are not generalizable to the entire nation, they do represent a reasonable sample of teachers from Maryland that implement STEM content and practices within their curricula like many other STEM education teachers across the United States. The results of this population can still be helpful for other state and national STEM education associations discussing the idea of a joint conference.
Qualitative Data Analysis
As mentioned previously, face–to–face interviews were conducted with an evenly distributed mix of professionals at the conference. These interview responses were transcribed and coded by the researchers. The codes were analyzed and collapsed into the following corresponding themes (Figure 5) that emerged across the interviews: Support, Size Concerns, and Retaining Identity. These themes are described in detail below.
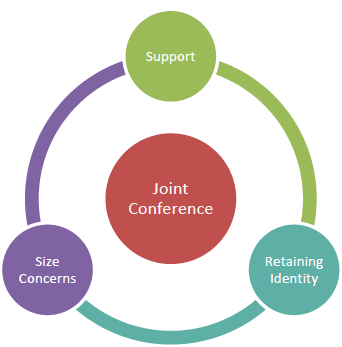
Figure 5. Themes and concerns that emerged from the attendee and vendor interviews regarding a joint conference.
- Support – The majority of the interviewees supported the concept of a joint conference. The supervisors, administrators, and vendors expressed overwhelming support for a joint conference for numerous reasons. One of the most prominent reasons given was to provide a well–rounded professional development experience to integrate multiple STEM concepts across content areas, or as one supervisor explained, "This was a much richer conference. I believe that science, technology, and engineering went together long before the NGSS went into place. Now it's even more important with the NGSS that we work together."Another supervisor discussed the collaboration that they saw occurring just in one of the sessions, "Half of the participants were science, half were some type of tech ed or engineering teachers and it was really great to just hear how through their lens they would incorporate certain engineering concepts and in our lens we would incorporate certain science concepts so I really liked that."
- Size Concerns – Various types of professionals voiced their caution about having a joint conference that is too large in size. They felt that the current conference was small enough to interact with professionals outside of their content area, and still be able to attend an ample amount of sessions from both disciplines. One interviewee expressed concerns with not being able to attend all of the sessions they want at a larger national joint conference, and losing the personal connection associated with smaller state conferences, "ITEEA is such a big conference that I think it would be beneficial for science and technology education to have their own conference because I would want to go to almost every science session and want to go to every ITEEA session and miss out on the ones that I really want to see."This also shows the amount of interest that this T&E professional has for attending both science and T&E presentations.
- Retaining Identity – Science professionals had no objections to a joint conference with other T&E associations, and welcomed it to address the engineering content in the NGSS. However, T&E professionals expressed concerns that there was too much focus on engineering and NGSS at the conference, "It's very science based which is fine because of the new standards but again I think there needs to be some higher level technical engineering career courses or sessions."Another T&E teacher interviewed also expressed their concern that there was too much emphasis being placed on science and engineering, and not enough sessions geared toward technology education like past conferences. They believed that this was threatening T&E education's identity and could potentially lead to science subsuming T&E education, "It seems to be extremely focused on science as far as what I've seen for technology education has been miniscule. It seems to be that we're kind of riding on coattails is my impression."The goal of collaboration yet still retaining our identity is a difficult balance and must be carefully considered when planning a joint conference.
In addition to attendees being surveyed, the attendee survey instrument was adapted to develop a survey tool for the vendors. The vendor survey was administered via paper and consisted of six multiple–choice questions with room for explanation on two of them. This method yielded a 77% response rate (23/30) which is considered high for paper surveys ( Nulty, 2008 ). Six interview questions were also created by the researchers to elicit more detailed responses and aid in the analysis of the survey findings. Vendors' responses were overwhelmingly positive, citing the increased number and variety of visitors to their booths as one advantage. An advantage for the associations running the conference as a result of the increased number of vendors was additional table rental fees. Even participants commented on the benefit of having a variety of science, technology, and engineering vendor booths to expose them to teaching aids outside of their content area of which they were not previously aware. These positive responses from the vendor surveys and interviews contributed to the data analysis from the attendee surveys and interviews, helping to examine the reasons that a joint conference was favored.
Discussion and Implications
In this article the authors collected numerous forms of data to better understand the perceptions of a joint conference from the various stakeholders. From the detailed survey and interview responses, the researchers found that administrators/supervisors had fewer reservations in regards to holding a joint conference. One reason for this may due to the multiple STEM related content areas that the administrators and supervisors represented. Administrators expressed in the interviews that a joint conference allows professionals to attend a richer conference where they can gather resources on a greater variety of topics to share at their school. Also from these data collection methods, the analyses of science and T&E participants at this conference indicated differences in perceived understanding of content and ability to demonstrate comprehension of content within their fields. Analyses further indicated pre and post median score gains in perceived understanding of content outside of their fields for both groups of professionals. These analyses also revealed T&E professionals' identifiable gains in pre and post median scores for their ability to demonstrate comprehension of and apply content within their field; whereas science professionals' median scores for ability to apply content outside of their field increased as a result of the joint conference. This may suggest that science professionals benefited most from the hands–on T&E presentations at the conference that helped inform teachers how to teach STEM concepts through engineering design.
Using the interviews to examine these phenomena more closely, it can be concluded that one reason for science professionals' focus on T&E topics was the recent release of the Next Generation Science Standards (NGSS), which called for engineering content and practices to be taught within science curricula. Almost all science professionals interviewed mentioned the NGSS and a focus on learning more about teaching engineering, however T&E educators had a broader view. They were not as concerned with the NGSS, and were more interested in learning how to better integrate numerous STEM concepts in their curricula as supported with their increased median scores in various areas both within and outside of their field. This impetus to learn solely about one topic may be more profound among science professionals due to state testing requirements which T&E professionals' jobs are not directly impacted by.
The National Academy of Engineering (NAE) and National Research Council (NRC) (2014) reports that in order to increase the academic integration of STEM content, effective implementation will occur through professional development, professional learning communities, and partnering between STEM educators working in and outside of schools. There is a misconception that joint conferences are only advantageous for economic reasons. The findings from the surveys and interviews indicate that science and T&E professionals value a joint conference for the increased quality and diversity of presentations, along with the increased attendance and breadth of professionals with whom they can collaborate with during and outside of the conference. These results indicate that teachers and administrators are taking advantage of the reasons for professional association conferences: networking, sharing resources and knowledge, increased professional development, and broadened impact in their field ( Arendale et al., 2009 ; Paino & Briskin, 2012 ).
State technology and engineering education association presidents indicated that half of state associations are currently holding joint conferences with 60% planning joint conferences in the near future. The value that professionals saw in melding of content and interests was also representative of the memberships purchased at the time of registration. When given the option of purchasing a membership for one association (MAST or TEAAM) or both associations, 26 percent (26/101) of the conference attendees who purchased a membership, purchased one for both associations. From an economic standpoint this would cost more money, but attendees found it professionally valuable to become a member of both associations. This indicates that attendees value a joint conference for its professional benefits.
The findings from this study should be considered when state and national STEM education associations are investigating ways to provide richer professional development for its members. When asked if they would be in favor of a joint conference between ITEEA and NSTA, 81 percent (18/22) of T&E professionals and of 88 percent (38/43) of science professionals said they would like to see it happen. This overwhelming response from both parties signifies that each association offers professional development expertise from areas which T&E (e.g., engineering) and science (e.g., biology, medical technologies, physics) each benefit to deliver more integrative curricula and enhance student learning. To maintain a reasonably sized conference, ITEEA and NSTA or ASEE may consider holding a joint regional or area conference. Providing adequate professional development for STEM professionals to work collaboratively is critical for preparing STEM literate students for the 21st century.
Conclusion
Many state, regional, and national science and T&E professional associations have considered holding joint conferences but until now did not have the data to make an informed decision. This research suggests that with the convergent paths of science and T&E education and the release of the NGSS, a change to joint professional development conferences is warranted. Teachers, administrators, and supervisors value the professional development received from a science and T&E education joint conference, and analyses indicated collective gains within and outside of their content area in numerous criterion.
If T&E educators are expected to be integrators of STEM and collaborate with other content areas ( ITEA/ITEEA, 2000/2002/2007 , p. 8), then the profession needs to provide its members with collaborative opportunities such as joint professional development conferences. Conducting a joint conference does not come without cautions though as expressed by some of the participants. For a successful joint professional development conference, T&E must be careful to provide a conference that is of reasonable size while still maintaining its identity. T&E education faces a critical crossroad – does it continue to operate its conferences in isolation or does it collaborate them with other professional associations? Science professionals from this study indicated that they are in need of professional development to deliver engineering content and practices. The findings from this study also suggest that they benefited from the collaboration with T&E educators sharing their expertise to deliver engineering content. If T&E education does not take the initiative to provide its engineering professional development expertise to other content areas, than it may miss out on a key opportunity on which other content areas and professional associations may capitalize.
Tyler S. Love ( tslove@vt.edu ) is a Doctoral Candidate in the Integrative STEM Education Program at Virginia Tech. Thomas Loveland ( tloveland@umes.edu ) is Coordinator of Graduate Studies in the Department of Technology at the University of Maryland Eastern Shore.
References
Allen, J. M., & Nimon, K. (2007). Retrospective pretest: A practical technique for professional development evaluation. Journal of Industrial Teacher Education, 44 (3), 27-42.
Arendale, D., Barrow, H., Carpenter, K., Hodges, R., McGrath, J., Newell, P., & Norton, J. (2009). Position paper: Creating a new professional association. Journal of Developmental Education, 33 (1), 28-35.
Bell, B. J. (2009). Conference attendance patterns of outdoor orientation program staff at four-year colleges in the United States. Journal of Experiential Education, 31 (3), 405-409.
Busby, J. R. (2012, November). Perspectives of the future of technology education professional associations . Symposium conducted at the 99th Mississippi Valley Technology Teacher Education Conference, Nashville, TN.
Cherrstrom, C. A. (2012). Making Connections: Attending Professional Conferences. Adult Learning, 23 (3), 148.
Common Core State Standards Initiative (CCSS). (2012). Common core state standards initiative: Preparing America’s students for college & career. Retrieved from http://www.corestandards.org/
Creswell, J. W., & Plano Clark, V. L. (2011). Designing and conducting mixed methods research . 2nd Edition. Thousand Oaks, CA: Sage.
Hickson, I. (2006). Raising the Question #4 Why Bother Attending Conferences? Communication Education, 55 (4), 464-468.
International Technology Education Association (ITEA/ITEEA). (2000/2002/2007). Standards for technological literacy: Content for the study of technology . Reston, VA: Author.
Lamb, T. (2005). The retrospective pretest: An imperfect but useful tool. The Evaluation Exchange, 11 (2), 18. Retrieved from http://www.hfrp.org/var/hfrp/storage/original/application/d6517d4c8da2c9f1fb3dffe3e8b68ce4.pdf
McAlister, B. (2013, November). The history, legacy, and future of the Mississippi valley conference . Paper presented at the 100th Mississippi Valley Technology Teacher Education Conference, Chicago, IL.
McAlister, B. (2012, November). The future of the Mississippi Valley Technology Teacher Education Conference: A survey of the membership . Paper presented at the 99th Mississippi Valley Technology Teacher Education Conference, Nashville, TN.
NGSS Lead States (2013). Next generation science standards: For states, by states . Washington, DC: National Academies Press.
National Academy of Engineering (NAE) and National Research Council (NRC). (2014). STEM integration in K-12 education: Status, prospects, and an agenda for research . Washington, DC: The National Academies Press.
Nulty, D. D. (2008). The adequacy of response rates to online and paper surveys: What can be done? Assessment & Evaluation in Higher Education, 33 (3), 301-314. doi:10.1080/02602930701293231
Paino, M., & Briskin, J. (2012). Emerging professionals committee: A commitment to the future-The development of the NSPI/ISPI historical timeline. Performance Improvement, 51 (6), 32-37.
Prajapati, B., Dunne, M., & Armstrong, R. (2010). Sample size estimation and statistical power analyses online article peer reviewed: The latest clinical article to appear online. Optometry Today, 50 (14), 41-50.
Tillotson, J. W., & Young, M. J. (2013). The IMPPACT project: A model for studying how preservice program experiences influence science teachers’ beliefs and practices. International Journal of Education in Mathematics, Science and Technology, 1 (3), 148-161.