JTE v28n1 - Use of Dynamic Visualizations for Engineering Technology, Industrial Technology, and Science Education Students: Implications on Ability to Correctly Create a Sectional View Sketch
Use of Dynamic Visualizations for Engineering Technology, Industrial Technology, and Science Education Students: Implications on Ability to Correctly Create a Sectional View Sketch
Petros Katsioloudis, Daniel Dickerson, Vukica Jovanovic, & Mildred V. Jones
Abstract
Spatial abilities, specifically visualization, play a significant role in the achievement in a wide array of professions including, but not limited to, engineering, technical, mathematical, and scientific professions. However, there is little correlation between the advantages of spatial ability as measured through the creation of a sectional-view sketch between engineering technology, industrial technology, and science education students.
A causal-comparative study was selected as a means to perform the comparative analysis of spatial visualization ability. This study was done to determine the existence of statistically significant difference between engineering technology, industrial technology, and science education students' ability to correctly create a sectional-view sketch of the presented object. No difference was found among the sketching abilities of students who had an engineering technology, industrial technology, or science education background. The results of the study have revealed some interesting results.
Keywords: dynamic visualizations; engineering technology; science education; spatial ability; spatial visualization; technology education.
A substantial amount of research has already been published on visualizations and the implications on spatial abilities. Spatial reasoning allows people to use the concepts of shape, features, and relationships in both concrete and abstract ways to make and use things in the world, to navigate, and to communicate ( Cohen, Hegarty, Keehner & Montello, 2003 ; Newcombe & Huttenlocher, 2000; Turos & Ervin, 2000 ). Over the last decade, lengthy debates have occurred regarding the opportunities for using animation in learning and instruction. One of the main reasons for this emphasis is recognizing the importance of these abilities in fields such as the natural sciences, geometry, engineering, and architecture ( McGee, 1979 ). Multiple scientific works reference the demand for good spatial abilities in engineering, architecture, and almost every science career ( Martín-Gutiérrez, Gil, Contero, & Saorín, 2013 ). Research suggests that spatial abilities are fundamental, not only in engineering and technical fields but in an estimated 80% of jobs overall. This includes but is not limited to those in medical professions, pilots, mechanics, builders, and trades people ( Bannatyne, 2003 ). Educators dispute whether spatial abilities can improve performance in science and math even though science and other subjects depend on spatial thinking as a fundamental skill for achievement ( LeClair, 2003; Schultz, Huebner, Main, & Porhownik, 2003 ).
Improving spatial abilities has been shown to also improve academic achievements in mathematics and science ( Keller, Washburn-Moses, & Hart, 2002 ; Mohler, 2001 ; Olkun, 2003 ; Robichaux, 2003 ; Shea, Lubinski, & Benbow, 1992 ). Research has shown that spatial ability is significantly correlated with achievement or retention in chemistry ( Coleman & Gotch, 1998 ), physics, ( Pallrand & Seeber, 1984 ), and the life sciences ( Lord, 1990 ). In addition to the sciences, a strong correlation has also been observed between spatial and mathematical ability, and some indicators suggest that spatial ability is important for achievement in science and problem solving ( Grandin, Peterson, & Shaw, 1998 ; Keller, Wasburn-Moses, & Hart, 2002 ).
However, there is little correlation between advantages of spatial ability as measured through the creation of a sectional-view sketch between engineering technology, industrial technology, and science education students.
For this study, the following was the primary research question:
- Is there a difference between engineering technology, industrial technology, and science education students' ability to correctly create a sectional-view sketch of the presented object?
The following hypotheses will be analyzed in an attempt to find a solution to the research question:
- H 0 : There is no difference between engineering technology, industrial technology, and science education students' ability to correctly create a sectional-view sketch of the presented object.
- H A : There is an identifiable difference between engineering technology, industrial technology, and science education students' ability to correctly create a sectional-view sketch of the presented object.
Review of Literature
Spatial Ability
Spatial ability is the ability to form and retain mental representations of a given stimulus ( Carroll, 1993; Höffler, 2010 ). "Spatial vision, or acquisition of a developed sense of spatial reasoning, is clearly seen as the most [fundamental and] rewarding part of engineering graphics instruction" ( Contero, Naya, Company, & Saorín, 2006, p. 472 ). Spatial abilities and rotation abilities are essential components for success in technical and engineering professions, as well as science, mathematics, and medical professions. Spatial ability is known as the act of "searching the visual field, apprehending the forms, shapes, and positions of objects as visually perceived, forming mental representations of those forms, shapes, and positions, and manipulating such representations 'mentally'" ( Carroll, 1993, p. 304 ). A learner's spatial skills are a significant predictor for success in manipulating objects and interacting with computer-aided design ( Norman, 1994 ). In recognizing the importance of spatial abilities for engineering and technology fields and the instructional tools used, it is also important that students with poor spatial skills improve through appropriate instructional techniques ( Rafaelli, Sorby, & Hungwe, 2006 ). Research by Sorby (2012) suggests that "students who have the opportunity to improve their spatial visualization skills demonstrate greater self-efficacy, improved math and science grades and are more likely to persist in engineering" (p. 1).
Spatial Ability Used in Engineering and Technology Education
Spatial abilities, specifically visualization, play a significant role in the achievement in a wide array of professions including but not limited to engineering, technical, mathematical, and scientific professions. In engineering education, spatial ability has been recognized as having a positive correlation with learning achievements and with retention ( Mayer & Sims, 1994 ; Mayer, Mautone, & Prothero, 2002 ). The use of physical object manipulations, freehand sketching on paper, and computer-aided sketching can improve the spatial ability of freshmen engineering students ( Martín-Gutiérrez et al., 2010 ). Spatial ability in engineering courses has also engaged the use of descriptive geometry, orthographic views, and three-dimensional modeling as a means to improve learners' spatial abilities ( Martín-Gutiérrez et al., 2013 ). The lack of a learner's spatial abilities has prompted some educators to create coursework in the engineering curriculum to aid learners who have demonstrated a weakness in spatial ability ( Rafaelli et al., 2006 ). Research by Rafaelli et al. (2006) evaluated the content of a course with middle and high school students. The target audience for this study was K-12 educators, specifically focusing on eight grade students. Rafaelli et al. (2006) found that in the Michigan Educational Assessment Program (MEAP), students in math showed results a 100% pass rate and science students with an 88% pass rate. Pre- and post-testing was performed using a modification of the Purdue Spatial Visualization Test: Rotations (PSVT:R) to measure improvements in spatial skills. Results from this study revealed that materials used for Michigan Tech's first-year engineering students are effective with a younger population.
A study by Basham and Kotrlik (2008) focused on a randomly selected ninth grade Technology Discovery population in Mississippi to investigate if instructional methods in 3-dimensional CADD software had an impact on spatial ability development. Using the Purdue Visualization of Rotations Test (PVRT; Bodner & Guay, 1997 ), Basham and Kotrlik collected student characteristics in gender, ethnicity, co-registration in art, and co-registration in geometry. Treatments consisted of various instructional methods where pretest scores, gender, ethnicity, co-registration in art, and co-registration in geometry were controlled. A quasi-experimental design was used where teachers used Pro/Desktop®2 3-D CADD software . Experimental treatments included Teacher and Module, Module Only, Existing Material , and No CADD Instruction (Control). An ANCOVA was used initially to test for interaction effects where the variable posttest and pretest were not significant. An ANCOVA was conducted for differences between student achievements among the instructional methods. Using a Levene's Test ( F (3, 460) = .71; p = .548) revealed equal variance across treatment groups. A lack of fit test revealed that effects were most likely linear ( F (88, 368) = 1.25; p = .086). There was a significant difference identified between posttest scores and teaching methods ( F (3, 459) = 6.6, p < .001, partial eta 2 = .04), revealing a "moderate relationship" (p. 39).
The results of Basham and Kotrlik's (2008) study indicated that there is a difference in spatial ability based on the instructional method using 3-D CADD modeling software. The Teacher and Module group showed a statistically significant difference from the Existing Material and Module Only groups. There was no difference in the Module Only group, the Existing Materials group, and the control group, No CADD Instruction . Results indicated that the method of instruction as a teacher-centered approach might have been the reason for those showing little to no gain. Basham and Kotrlik suggested a connection between this and constructivist theory, which suggests that a learner-centered approach is more effective in mathematics and other similar subjects.
Basham and Kotrlik (2008) argued that based on the findings, continued research is vital to the area of spatial ability achievement. They proposed replicating the study in other states as well as continuing the research of examining spatial ability through 3-D modeling software. This area of research could be the most "important contribution" that technology education can offer students (p. 44).
Spatial Ability Used in Science Education
Spatial ability and reasoning are highly valued in the teaching, learning, and practicing of science. Throughout the history of science, there are enough examples of scientists generating and using both physical and mental models to consider the practice a hallmark of the domain ( Kuhn, 1996 ; McComas, 1998 ). Even entire fields of science are dedicated to collecting, analyzing, and explaining spatial data, as can be seen with the example of geoinformatics and many fields within the geosciences. Generating, rotating, and transforming mental images have historically been done by practicing scientists in order to better understand and explain natural phenomena ( Lerner & Overton, 2010 ). This applies not only to the macro world but also the micro. For example, to date, no one has ever literally seen an atom, but pictures (i.e., models) abound. These mental models shape the questions asked and the assertions made. Given this, the science education community recognizes the importance of spatial ability in the practice of science ( NGSS Lead States, 2013 ). Because best practice science education involves actively engaging students in developing and conducting authentic scientific inquiries ( Cothron, Giese, & Rezba, 2006 ; Settlage & Southerland, 2007 ), it stands to reason that such authentic work would include the application of spatial abilities. Furthermore, the science education community recognizes that these abilities, like any other, need attention and support in order to reach their full potential ( Wesson, 2011 ). Understanding which spatial abilities are most important to develop for particular content, and how to best support that development, continues to be an area in need of further research within science education ( Ainsworth, 1999 ; Zhou, 2010 ; Duffy, 2012 ).
Visualization
Although research suggests "that spatial visualization ability can be improved through instructional methods . . . there has been no clear consensus on what combination and duration of instructional methods is most beneficial for improving spatial visualization ability" ( Ferguson, Ball, McDaniel & Anderson, 2008, p. 2 ). To shift from a teacher-centered to a student-centered education paradigm model, there must be a critical analysis of the varying engineering courses and their inclusion in the curriculum ( Contero et al., 2006 ). In particular, Contero, Naya, Company, and Saorín (2006) argue that "teachers of 'engineering graphics' should put the emphasis in spatial reasoning, since we do consider it to be a core competence for future engineers [as well as other technical fields]" (p. 471).
In a study conducted by Branoff and Dobelis (2012) , the topic of whether or not students could still read and interpret engineering drawings was researched. They looked at whether the ability to read these drawings related to spatial visualization ability. Branoff and Dobelis discovered that a relationship does exist between reading engineering drawings and spatial visualization aptitude. Researchers in engineering education, the U.S. Department of Labor, and other major industry agents have called for the enhancement of spatial visualization ability in engineering and technology students ( Ferguson et al., 2008 ). Research has also suggested positive correlations between visualization ability and the retention and achievement of a degree in engineering and technology students ( Brus, Zhoa, & Jessop, 2004 ; Sorby, 2001 ). However, few research studies have explored the effectiveness of dynamic representations and its correlation to a learner's spatial ability (Froese, Tory, Evans & Shirkhande, 2013, Höffler & Leutner, 2011 ).
Dynamic Visualizations for Different Disciplines
Wu and Shah (2004) suggested that dynamic visualizations and 3-D animations offer an environment that supports a learner's inadequate mental model. While, some studies have not confirmed that dynamic visualizations enhance a learner's spatial ability, some research suggests that dynamic visualizations do enhance the learning process for learners with high spatial ability ( Huk, 2006 ; Lewalter, 2003 ). In addition, some research proposes that dynamic visualizations may improve spatial ability in learners with low spatial ability, and may in fact have a "compensating effect" for the low spatial ability learners ( Hegarty & Kriz, 2008 ; Höffler, 2010 ; Huk, 2006 ; Mayer & Sims, 1994 ). In short, research has failed to provide definitive findings reinforcing spatial ability as an enhancer for learners with low spatial ability ( Hegarty & Kriz, 2008 ; Höffler, 2010 ; Huk, 2006 ; Mayer & Sims, 1994 ). Hegarty and Kriz (2008) contended that dynamic visualizations act as a "cognitive prosthetic" for learners possessing low spatial ability.
Methodology
A causal-comparative study was selected as a means to perform the comparative analysis of spatial visualization ability during the fall of 2014. The study was conducted in an engineering graphics course, Computer Aided Drafting was required for engineering technology and industrial technology students. Three independent groups participated in this study: group one consisted of engineering technology students, group two consisted of industrial technology students, and group three consisted of science education students. The participants from the study are shown in Figure 1. Students from each discipline were placed into 3 individual groups. Using a convenience sample, there was a near equal distribution of the participants between the three groups.
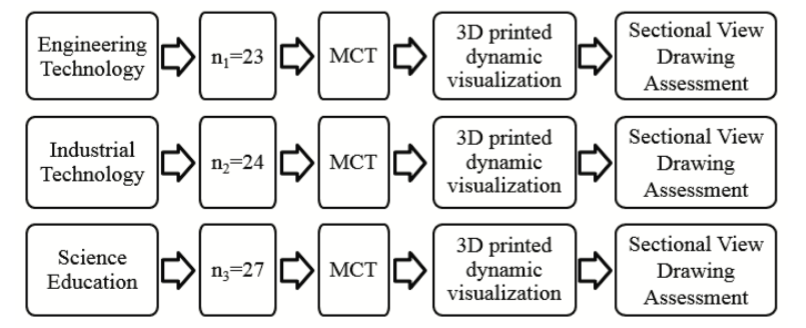 Figure 1.
Research design methodology.
Figure 1.
Research design methodology.
The engineering graphics course emphasized hands-on practice using 3D AutoCAD software in the computer lab along with the various methods of editing, manipulation, visualization, and presentation of technical drawings. In addition, the course included the basic principles of engineering drawing or hand sketching, dimensions, and tolerance principles. The science course emphasized problem-based learning and hands-on practice using scientific modeling and simulation software along with the various methods of editing, manipulation, visualization, and presentation of scientific drawings.
The students attending the courses during the fall semester of 2014 were divided into three groups. The three groups ( n 1 = 23, n 2 = 24, and n 3 = 27, with an overall population of N = 74) were presented with the same visual representation of an object (visualization) and were asked to create a sectional-view drawing. All groups received the same type of visualization (Dynamic 3D printed octahedron). This visualization was suggested as one that supports additional enhancement of spatial skills (between 3D Static, 3D PC Dynamic, and 3D Printed Dynamic) for individuals with higher spatial ability, such as engineering students ( Katsioloudis, Jovanovic, & Jones, 2014 ).
All groups were asked to complete the Mental Cutting Test (MCT; College Entrance Examination Board [CEEB], 1939) 2 days prior to the completion of the sectional-view drawing in order to identify the level of visual ability and show equality between the three groups. According to Németh and Hoffman (2006) , the MCT has been widely used in all age groups, making it a good choice for a well-rounded visual ability test. The Standard MCT consists of 25 problems. The Mental Cutting Test is a subset of the CEEB Special Aptitude Test in Spatial Relations, and "has also been used by Suzuki et al. [Suzuki, Wakita, & Nagano (1990)] to measure spatial abilities in relation to graphics curricula" ( Tsutsumi, 2004 ). As part of the MCT, subjects were given a perspective drawing of a test solid that was to be cut with a hypothetical cutting plane. Subjects were then asked to choose one correct cross section from among five alternatives. There were two categories of problems in the test ( Tsutsumi, 2004 ). Those of the first category are called pattern recognition problems , in which the correct answer is determined by identifying only the pattern of the section. The others are called quantity problems , or dimension specification problems , in which the correct answer is determined by identifying not only the correct pattern but also the quantity in the section (e.g., the length of the edges or the angles between the edges; Tsutsumi, 2004 ).
Upon completion of the MCT, the instructor of the course, who was the same for all three groups, placed the Dynamic 3D printed visualization in a central location in the classroom and then asked the students to create a sectional-view drawing of the octahedron (see Figure 2). This process took into consideration the fact that a learner's visualization ability and level of proficiency can easily be determined through sketching and drawing techniques ( Contero et al., 2006 ; Mohler, 1997 ). All three groups had the privilege of close observation in addition to the ability of changing the view through the rotation of the visualization by using motor attached to the gamble.
The engineering drawing used in this research was a sectional view of the octahedron (see Figure 3). Sectional views are very useful engineering graphics tools, especially for parts that have complex interior geometry, because the sections are used to clarify the interior construction of a part that cannot be clearly described by hidden lines in exterior views ( Plantenberg, 2013 ). By taking an imaginary cut through the object and removing a portion, the inside features could be seen more clearly. Students had to mentally discard the unwanted portion of the part and draw the remaining part. The rubric used included the following parts: (1) use of section view labels, (2) use of correct hatching style for cut materials, (3) accurate indication of cutting plane, (4) appropriate use of cutting plane lines, and (5) appropriate drawing of omitted hidden features. The maximum score for the drawing was 6 points.
Limitations
It is important to note that several factors might threaten the internal and external validity of this study. Results could be affected by the convenience sample, the potential bias of the instructor (who was also the researcher), the reliability of the MCT, the lack of controlled conditions that define the comparison groups, and the preexisting knowledge and skills of groups related to sketching skills, cross-sectional drawings, and 2D drawing principles.
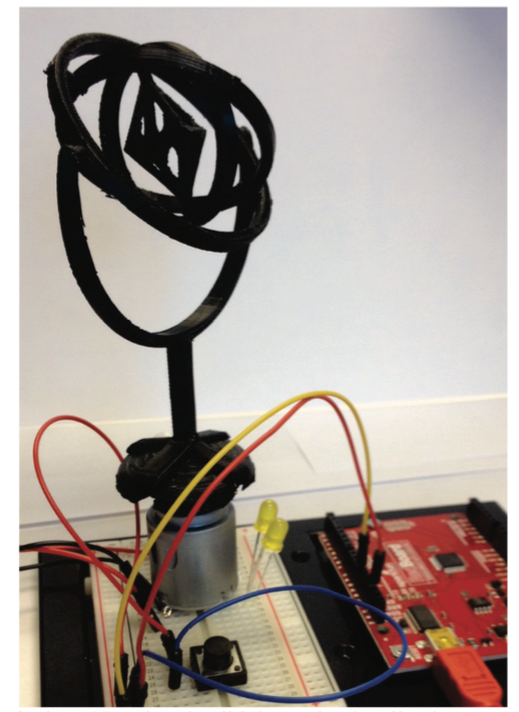 Figure 2.
Octahedron 3D printed solid dynamic visualization.
Figure 2.
Octahedron 3D printed solid dynamic visualization.
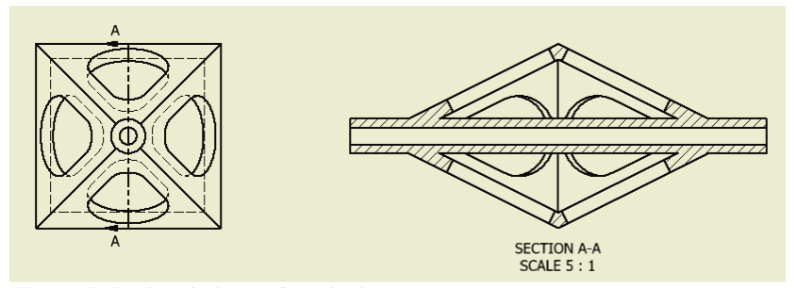 Figure 3.
Sectional views of octahedron.
Figure 3.
Sectional views of octahedron.
Data Analysis
Analysis of MCT Scores
The first phase of data collection involved the completion of the MCT instrument prior to the treatment to show equality of spatial ability between the three different groups. The researchers graded the MCT instrument, as described in the guidelines of the MCT creators ( CEEB, 1939 ). A standard paper-and-pencil MCT was conducted in which the subjects were instructed to draw intersecting lines on the surface of a test solid with a green pencil before selecting alternatives. The maximum score that could be received on the MCT was 25. As shown in Table 1, n 1 had a mean of 12.26, n 2 had a mean of 13.54, and n 3 had a mean of 12.78. There were no significant differences between the spatial abilities of the three groups, as measured by the MCT instrument.
| 95% Confidence Interval for Mean | ||||||
|---|---|---|---|---|---|---|
| Discipline | N | Mean | SD | Std. Error | Lower Bound | Upper Bounds |
| Engineering Technology | 23 | 12.26 | 4.014 | 0.837 | 10.53 | 14.00 |
| Industrial Technology | 24 | 13.54 | 4.472 | 0.913 | 11.65 | 15.43 |
| Science Education | 27 | 12.78 | 4.200 | 0.808 | 11.12 | 14.44 |
| Total | 74 | 12.86 | 4.208 | 0.489 | 11.89 | 13.84 |
Analysis of Drawing
The second phase of data collection involved the creation of a sectional-view drawing. As shown in Table 2, the science student group ( n = 27) had a mean observation score of 4.52. The engineering technology group ( n = 23) and the industrial technology group ( n = 24) had higher scores of 4.63 and 4.70, respectively. The data was entered into a statistical software package, SPSS, and was coded to reflect the three groups. This data was then evaluated for normality of distribution and determined to be in violation.
Due to the relatively low numbers of the participants and the fact that we did not have random samples, a non-parametric Kruskal-Wallis test was run to compare the mean scores for significant differences, as it relates to special skills among the three groups. A Kruskal-Wallis test was run to compare the mean scores for significant differences among the three groups. The result of the Kruskal-Wallis test, as shown in Table 3, was not significant ( X 2 = 1.698, p < 0.428).
| 95% Confidence Interval for | ||||||
|---|---|---|---|---|---|---|
| Disciplines | N | Mean | SD | Std. Error | Lower Bound | Upper Bounds |
| Engineering Technology | 23 | 4.63 | 1.452 | 0.303 | 4.00 | 23 |
| Industrial Technology | 24 | 4.70 | .704 | .144 | 4.41 | 24 |
| Science Education | 27 | 4.52 | .815 | .157 | 4.20 | 27 |
| Total | 74 | 4.61 | 1.017 | .118 | 4.38 | 74 |
| Discipline | N | DF | Mean Rank | X 2 | P -value |
|---|---|---|---|---|---|
| Engineering Technology | 23 | 2 | 41.80 | 1.698 | .428 |
| Industrial Technology | 24 | 37.33 | |||
| Science Education | 27 | 33.98 | |||
| Total | 74 | ||||
Discussion
This study was done to determine the existence of statistically significant differences between engineering technology, industrial technology, and science education students' ability to correctly create a sectional-view sketch of the presented object. No differences were found between the sketching abilities of students who had engineering technology, industrial technology, or science education backgrounds. The results of the study have revealed some interesting results. Some of these results were consistent with previous studies and others were not, as can be seen below.
Research by Sorby (1999) placed an emphasis on sketching or hand drawing for the coursework. Two of the courses focused on computer-aided design (CAD), and the other two courses focused on sketching or had drawing. The findings indicated that sketching is the best way to develop 3-D spatial visualization skills. Pre- and post-testing in the courses that focused on sketching revealed that the gain scores on the Mental Rotation Test (MRT), the Mental Cutting Test (MCT), and the Purdue Spatial Visualization Test: Rotation (PSVT:R) were higher for all three tests than those of the CAD courses. In addition to sketching and physical models, Sorby also recommended courses be sequenced by having students work with physical models that allow them to move from concrete to semiconcrete (pictorial sketching). This sequence allows for a natural progression from concrete to abstract. Sketching and hand-held models, which students can see and touch, are especially significant in the development of 3-D spatial visualization skills in first-year engineering design courses.
In a qualitative research study by Mohler and Miller (2008) , a teaching technique called mentored sketching was found to be a significant factor in teaching spatial visualization skills in first-year engineering courses. Student feedback regarding the use of lecture and homework sketching was favorable. Summative results indicated that this mentoring activity had a significant positive impact on student visualization and sketching skills. The study consisted of a population of approximately 950 students (annual enrollment) in a computer graphics technology course. One hour included theory lecture accompanied by a 1-hour laboratory preparation lecture and a 2-hour laboratory (CAD). Students felt that it was beneficial to see the professor doing the problem in order for them to follow along. Students also felt that it was important to have the professor's guidance through the "mental steps" of a problem (p. 24). In addition, students felt that mentored sketching allowed them to learn terminology as well as get an authentic experience in how to accomplish tasks.
In a study conducted by Sanger and Greenbowe (1997) , the use of dynamic animations in a college chemistry class was investigated. The researchers first assessed students' conceptual understanding of salt bridges and electrochemical cells and found that many students held alternative conceptions of these topics. Computer-generated dynamic visualizations were then used as a part of the lecture to provide college general chemistry students with dynamic views of the chemical processes occurring in the salt bridge and electrolytes of an electro-chemical cell system. The dynamic computer-generated visualizations depicted current flow in the electro-chemical cell. According to Sanger and Greenbowe (1997) , the percentage of students who held alternative conceptions after receiving the lecture using the dynamic computer-generated visualizations versus those who received a no animation lecture were compared. It was observed that a significantly lower percentage of students who received the visualization-enhanced lecture showed alternative conceptions than did students who had not viewed the animations. In addition, Sanger and Greenbowe (1997) supported the theory that a detailed dynamic visualization presentation provided by computer animations helped most students overcome their alternative conceptions. The researchers indicated that the dynamic visualizations helped students visualize complicated chemical reaction processes and led them to change their alternative conceptions to scientifically more acceptable conceptions ( Sanger & Greenbowe, 1997 ).
Conclusion and Future Plans
There is strong evidence that sketching, in particular, is a strong factor in the development of spatial visualization skills. Sorby's (1999) findings indicated that "sketching, sketching, sketching" should be favored over 3-D computer modeling as a method to build strong spatial visualization skills (p. 29). Coupled with physical models and sequencing topics, Sorby found these to be significant factors in the development of spatial visualization skills. These findings are significant to ensure students with low spatial skills can build their skills to increase retention in engineering programs, especially among women, who are typically identified as having low spatial abilities. It is, however, important to identify if specific groups, such as science, engineering, and industrial technology students, benefit from sketching at the same rate. Continued research in this area can be used to suggest changes to the curriculum.
In order to have a more thorough understanding of sketching ability and its implications for different disciplines and student learning, it is imperative to consider further research. Future plans include but are not limited to:
- Repeating the study to verify the results by using additional types of visualizations;
- Repeating the study using a different population such as mathematics and engineering education; and
- Repeating the study by adding visual cues during the display of 3D objects, including shadows, lighting, and size.
Petros Katsioloudis ( pkatsiol@odu.edu ) is Associate Professor and Chair in the Department of STEM Education and Professional Studies at Old Dominion University; Daniel Dickerson ( disckersond15@ecu.edu ) is Associate Professor in the Department of Science Education at Eastern Carolina University; Vukica Jovanovic ( v2jovano@odu.edu ) is Assistant Professor in the Department of Engineering Technology at Old Dominion University; Mildred V. Jones ( mjones@odu.edu ) is a Graduate Student in the Department of STEM Education and Professional Studies at Old Dominion University.
References
Ainsworth, S. (1999). The functions of multiple representations. Computers & Education, 33 (2–3), 131–152. doi:10.1016/S0360-1315(99)00029-9
Bannatyne, A. (2003). Multiple intelligences . Bannatyne Reading Program. Retrieved from www.bannatynereadingprogram.com/BP12MULT.htm
Basham, K. L., & Kotrlik, J. W. (2008). The effects of 3-dimensional CADD modeling on the development of the spatial ability of technology education students. Journal of Technology Education, 20 (1), 32–47. doi:10.21061/jte.v20i1.a.3
Bodner, G. M., & Guay, R. B. (1997). The Purdue Visualization of Rotations Test. The Chemical Educator, 2(4), 1–17. doi:10.1007/s00897970138a
Branoff, T. J., & Dobelis, M. (2012). The relationship between spatial visualization ability and students' ability to model 3D objects from engineering assembly drawings. Engineering Design Graphics Journal, 76 (3), 37–43.
Brus, C., Zhoa, L. & Jessop. J (2004, June). Visual-spatial ability in first-year engineering students: A useful retention variable? Paper presented at the American Society for Engineering Education Annual Conference and Exposition, Salt Lake City, UT. Retrieved from https://peer.asee.org/13248
Carroll, J. B. (1993). Human cognitive abilities: A survey of factor-analytic studies . New York, NY: Cambridge University Press. doi:10.1017/CBO9780511571312
Cohen, C. A., Hegarty, M., Keehner, M., & Montello, D. R. (2003, July). Spatial ability in the representation of cross sections . Poster presented at the Annual Conference of the Cognitive Science Society Conference, Boston, MA.
College Entrance Examination Board. (1939). Special aptitude test in spatial relations . New York, NY: Author.
Coleman, S. L., & Gotch, A. J. (1998). Spatial perception skills of chemistry students. Journal of Chemical Research, 75 (2), 206–209. doi:10.1021/ed075p206
Contero, M., Naya, F., Company, P., & Saorín, J. L. (2006). Learning support tools for developing spatial abilities in engineering design. International Journal of Engineering Education, 22 (3), 470–477. Retrieved from http://www.ijee.ie/articles/Vol22-3/06_ijee1769.pdf
Cothron, J. H., Giese, R. N., & Rezba, R. J. (2006). Students and research: Practical strategies for science classrooms and competitions (4th ed.). Dubuque, Iowa: Kendall/Hunt.
Duffy, D. L. F. (2012). The nature and role of physical models in enhancing sixth grade students' mental models of groundwater and groundwater processes (Doctoral dissertation). Available from ProQuest Dissertations and Theses database. (UMI No. 3529175)
Ferguson, C., Ball, A., McDaniel, W., & Anderson, R. (2008, November). A comparison of instructional methods for improving the spatial-visualization ability of freshman technology seminar students. Paper presented at the 2008 IAJC-IJME International Conference, Nashville, TN. Retrieved from http://ijme.us/cd_08/PDF/37_IT305.pdf
Grandin, T., Peterson, M., & Shaw, G. L. (1998). Spatial-temporal versus language-analytic reasoning : The role of music training. Arts Education Policy Review, 99 (6), 11–14. doi:10.1080/10632919809599481
Hegarty, M., & Kriz, S. (2008). Effects of knowledge and spatial ability on learning from animation. In R. Lowe & W. Schnotz (Eds.), Learning with animation: Research implications for design (pp. 3–29). Cambridge, England: Cambridge University Press.
Höffler, T. N. (2010). Spatial ability: Its influence on learning with visualizations—A meta-analytic review. Educational Psychology Review 22 (3), 245–269. doi:10.1007/s10648-010-9126-7
Höffler, T. N., & Leutner, D. (2011). The role of spatial ability in learning from instructional animations—Evidence for an ability-as-compensator hypothesis. Computers in Human Behavior, 27 (1), 209–216. doi:10.1016/j.chb.2010.07.042
Huk, T. (2006). Who benefits from learning with 3D models? The case of spatial ability. Journal of Computer Assisted Learning, 22 (6), 392–404. doi:10.1111/j.1365-2729.2006.00180.x
Katsioloudis, P., Jovanovic, V., & Jones, M. (2014). A comparative analysis of spatial visualization ability and drafting models for industrial and technology education students. Journal of Technology Education, 26 (1), 88–101. doi:10.21061/jte.v26i1.a.6
Keller, B., Wasburn-Moses, J., & Hart, E. (2002). Improving students' spatial visualization skills and teachers' pedagogical content knowledge by using on-line curriculum-embedded applets: Overview of a research and development project. Retrieved from National Council of Teachers of Mathematics Illuminations Project website: http://illuminations.nctm.org/downloads/IsoPaperV4.pdf
Kuhn, T. S. (1996). The structure of scientific revolutions (3rd ed.). Chicago, IL: University of Chicago Press. doi:10.7208/chicago/9780226458106.001.0001
Lerner, R. M., & Overton, W. F. (2010). The handbook of life-span development: Cognition, biology, and methods (Vol. 1). Hoboken, NJ: Wiley. doi:10.1002/9780470880166
Lewalter, D. (2003). Cognitive strategies for learning from static and dynamic visuals. Learning and Instruction, 13 (2), 177–189. doi:10.1016/S0959-4752(02)00019-1
LeClair, E. E. (2003). Alphatome—Enhancing spatial reasoning. Journal of College Science Teaching, 33 (1), 26–31.
Lord, T. R. (1990). Enhancing learning in the life sciences through spatial perception. Innovative Higher Education, 15 (1), 5–16. doi:10.1007/BF00889733
Martín-Gutiérrez, J., Gil, F. A., Contero, M., & Saorín, J. L. (2013). Dynamic three-dimensional illustrator for teaching descriptive geometry and training visualisation skills. Computer Applications in Engineering Education, 21 (1), 8–25. doi:10.1002/cae.20447
Martín-Gutiérrez, J., Saorín, J. L., Contero, M., Alcañiz, M., Pérez-López, D. C., & Ortega, M. (2010). Design and validation of an augmented book for spatial abilities development in engineering students. Computers & Graphics, 34 (1), 77–91. doi:10.1016/j.cag.2009.11.003
Mayer, R. E., Mautone, P., & Proterho, W. (2002). Pictorial aids for learning by doing in a multimedia geology simulation game. Journal of Educational Psychology, 94 (1), 171–185. doi:10.1037//0022-0663.94.1.171
Mayer, R. E., & Sims, V. K. (1994). For whom is a picture worth a thousand words? Extensions of a dual-coding theory of multimedia learning. Journal of Educational Psychology, 86 (3), 389–401. doi:10.1037/0022-0663.86.3.389
McComas, W. F. (Ed.). (1998). The nature of science in science education: Rationales and strategies . Dordrecht, the Netherlands: Kluwer. doi:10.1007/0-306-47215-5
McGee, M. G. (1979). Human spatial abilities: Psychometric studies and environmental, genetic, hormonal, and neurological influences. Psychological Bulletin, 86 (5), 889–918. doi:10.1037/0033-2909.86.5.889
Mohler, J. L., & Miller, C. L. (2008). Improving spatial ability with mentored sketching. Engineering Design Graphics Journal, 72 (1), 19–27. Retrieved from http://www.edgj.org/index.php/EDGJ/article/viewFile/11/10
Mohler, J. L. (2001). Using interactive multimedia technologies to improve student understanding of spatially-dependent engineering concepts . In GraphiCon'2001 (pp. 292–300). Nizhny Novgorod, Russia: GraphiCon Scientific Society. Retrieved from http://www.graphicon.ru/html/2001/pdf/09_graphicon01_jlm.pdf
Mohler, J. L. (1997). An instructional method for the AutoCAD™ modeling environment. Engineering Design Graphics Journal, 61 (1), 5–16.
Németh, B., & Hoffman, M. (2006). Gender differences in spatial visualization among engineering students. Annales Mathematicae et Informaticae, 33 , 169–174. Retrieved from http://ami.ektf.hu/uploads/papers/finalpdf/AMI_33_from169to174.pdf
NGSS Lead States. (2013). Next generation science standards: For states, by states. Washington, DC: National Academies Press. doi:10.17226/18290
Norman, K. L. (1994). Spatial visualization—A gateway to computer-based technology. Journal of Special Education Technology, XII (3), 195–206. doi:10.1177/016264349401200303
Olkun, S. (2003, April 17). Making connections: Improving spatial abilities with engineering drawing activities. International Journal of Mathematics Teaching and Learning . Retrieved from http://www.cimt.plymouth.ac.uk/journal/sinanolkun.pdf
Pallrand, G. J., & Seeber, F. (1984). Spatial ability and achievement in introductory physics. Journal of Research in Science Teaching, 21 (5), 507–516. doi:10.1002/tea.3660210508
Plantenberg, K. (2013). Engineering graphics essentials with AutoCAD 2014 instruction . Mission, KS: SDC Publications.
Rafaelli, L., Sorby, S. A., & Hungwe, K. (2006). Developing 3D spatial skills for K-12 students. Engineering Design Graphics Journal, 70 (3), 1–11. Retrieved from http://www.edgj.org/index.php/EDGJ/article/viewFile/393/282
Robichaux, R. R. (2003). The improvement of spatial visualization: A case study. Journal of Integrative Psychology, 4 (2). Retrieved May 23, 2005, from http://www.integrativepsychology.org/articles/vol2_article3.htm
Sanger, M. J., & Greenbowe, T. J. (1997). Common student misconceptions in electrochemistry: Galvanic, electrolytic, and concentration cells. Journal of Research in Science Teaching, 34 (4), 377–398. doi:10.1002/(SICI)1098-2736(199704)34:4<377::AID-TEA7>3.3.CO;2-E
Settlage, J., & Southerland, S. A. (2007). Teaching science to every child: Using culture as a starting point . New York, NY: Routledge.
Schultz, K., Huebner, J., Main, K., v Porhownik, N. (2003, July). Spatial performance and women's persistence and success in science . Paper presented at the Canadian Coalition of Womenin Engineering, Science, and Technology Conference, St. John's, Newfoundland, Canada. Retrieved from http://www.mun.ca/cwse/Schultz,Katherine.pdf
Shea, D. L., Lubinski, D., & Benbow, C. P. (2001). Importance of assessing spatial ability in intellectually talented young adolescents: A 20-year longitudinal study. Journal of Educational Psychology, 93 (3), 604–614. doi:10.1037/0022-0663.93.3.604
Sorby, S. A. (1999). Developing 3-D spatial visualization skills. Engineering Design Graphics Journal, 63 (2), 21–32. Retrieved from http://www.edgj.org/index.php/EDGJ/article/viewFile/126/122
Sorby, S. A. (2001). A course in spatial visualization and its impact on the retention of female engineering students. Journal of Women and Minorities in Science and Engineering, 7 (2), 153–172. doi:10.1615/JWomenMinorScienEng.v7.i2.50
Sorby, S. (2012, August). Spatial visualization skills (ENGAGE Strategy Research Brief). Retrieved from http://www.wskc.org/documents/281621/307749/ENGAGE+Brief+-+Spatial+Skills.pdf/200fbd8f-41b2-47c3-b9dd-c53eaefdcac0?version=1.0
Tsutsumi, E. (2004). A mental cutting test using drawings of intersections. Journal for Geometry and Graphics, 8 (1), 117–126. Retrieved from http://www.heldermann-verlag.de/jgg/jgg08/j8h1tsut.pdf
Turos, J. M., & Ervin, A. I. (2000). Training and gender differences on a web-based mental rotation task. The Penn State Behrend Psychology Journal, 4 (2), 3–12. Retrieved from http://viz.bd.psu.edu/viz/conferences/Training-and-Gender.pdf
Wesson, K. (2011). Guest editorial: Minds, models, and maps. Science and Children, 49 (1), 14–15.
Wu, H.-K., & Shah, P. (2004). Exploring visuospatial thinking in chemistry learning. Science Education, 88 (3), 465–492. doi:10.1002/sce.10126
Zhou, G. (2010). Conceptual change in science: A process of argumentation. Eurasia Journal of Mathematics, Science & Technology Education, 6 (2), 101–110. Retrieved from http://www.ejmste.com/v6n2/EURASIA_v6n2_Zhou.pdf