CTER v31n1 - The Learning Organization Model across Vocational and Academic Teacher Groups
The Learning Organization Model across Vocational and Academic Teacher Groups
Joo Ho Park
South Korean Ministry of EducationJay W. Rojewski
University of GeorgiaAbstract
Multiple-group confirmatory factor analysis was used to investigate factorial invariance between vocational and academic teacher groups on a measure of the learning organization concept. Participants were 488 full-time teachers of public trade industry-technical and business schools located within Seoul, South Korea. Statistically significant differences in factor structure, factor loadings, and factor correlations were not detected across the two teacher groups. Findings provide strong evidence that the learning organization model can be operationalized and equally applied to different teacher groups in Korean vocational high schools.
Today, all organizations need to deal with the challenges stemming from environmental changes and major problems that confront structures, systems, and cultures. School organizations are also undergoing “a period of intense transition and transformation as we enter the global market, with global information systems and an awareness of ecological interconnectedness of all natural systems” ( Diggins, 1997 , p. 418). The adoption of the learning organization approach represents a positive management strategy which schools can use to successfully navigate myriad change they confront ( Duffy, 1997 ; Fullan, 1995 ; Weller & Weller, 1997 ).
In school organizations, the decision to become a learning organization encompasses system changes including both “restructuring and reculturing” ( Seller, 2001 , p. 256). Weller and Weller (1997) argued that the school restructuring and reform movement, which originally started in the 1990s, has begun to reflect research findings from human resources and organizational theory, and that implementing the learning organization approach supports school efforts at achieving continuous improvement. Seller criticized existing educational research and practices because of the tendency to compartmentalize components of reform in order to control the scope. Duffy (1997) criticized major recommendations for school improvement (e.g., schools of choice, block scheduling, and teaching of ethics) because they did not consider the complexities of school systems represented by interwoven internal and external organizational environments. Fullan (1993) also argued that past school reform efforts have failed because they did not consider the complex and intractable attributes of educational problems, as well as not addressing “fundamental instructional reform and associated development of a new collaborative culture among educators” (p. 57). This indicates that for successful school change and meaningful reform, all parts of the educational enterprise must be linked together according to a systems thinking or systemic concept.
A systemic change to schooling is understood as fundamental change in the whole educational system. It begins at the deepest level of purpose, values, beliefs about learning, and all corollary components that support student learning in schools such as curriculum, instruction, assessment, and policy ( Jenlink, 1995 ). Major shifts in commonly held mindsets about school, schooling, and education, as well as how we approach educational change, are required. “Today piecemeal change efforts often characterized as fragmented or tinkering at the edges, have proven less than satisfactory” (p. 6). Therefore, schools need to make radical change in pedagogy (e.g., substantive changes in teaching strategies, assessment, and the teaching-learning process) to improve student achievement and meet the diverse learning needs of students.
In all advanced, as well as most developing countries, the rapid pace of change based on globalization and continuously innovating information technology is forcing educators, educational administrators, and policymakers to pay more attention to new ways of re-culturing and restructuring schools. As one approach to addressing change, research and practice on schools as learning organizations (e.g., Dalin, 1996 ; DuFour, 1997 ; Fullan, 1993, 1995 ; Keefe & Howard, 1997 ; Leithwood, Leonard, & Sharrat, 1998 ; O’Sullivan, 1997 ; Redding & Kamm, 1999 ; Senge, Cambron-McCabe, Lucas, Smith, Dutton, & Kleiner, 2000 ; Silins, Mulford, & Zarins, 2002 ; Zederayko & Ward, 1999 ) have increased over the last 15 years. In fact, with school reform movements focusing on reculturing and restructuring schools, many educational stakeholders advocate the concept of learning organization as a new school reform or change strategy ( Fullan, 1993, 1995 ; Zederayko, 2000 ).
Senge (1990) described a learning organization as consisting of five disciplines, including personal mastery, mental models, shared vision, team learning, and systems thinking. These five disciplines are divided into two categories according to a primary focus on individuals or groups. The first category includes personal mastery, mental models, and systems thinking which focus on individual behaviors and practices in an organization. Personal mastery is a discipline of “continually clarifying and deepening our personal vision, of focusing our energies, of developing patience, and of seeing reality objectively” (p. 7). Mental models are “deeply ingrained assumptions, generations, or even pictures and images that influence how we understand the world and how we take action” (p. 8). When establishing mental models, Senge highlights that people need to maintain a balance between inquiry and advocacy, “where people expose their own thinking effectively and make that thinking open to the influence of others” (p. 9). Systems thinking is a discipline to integrate all other disciplines and focuses on interconnectedness.
The second category includes the disciplines of shared vision and team learning, which “differ from the other three in that they are inherently collective in nature” ( Senge, 1990 , p. 375). Shared vision means that individual visions or goals are integrated into a shared organizational vision. Finally, team learning needs to be developed to create a learning organization. According to Senge’s argument, “unless teams can learn, the organization cannot learn” (p. 10). In spite of increased attention on the necessity and advantages of applying the learning organization concept to schools, empirical investigations to assess this phenomenon have been relatively rare ( Griego & Gerory, 1999 ; Silins, Zarins, & Mulford, 1998 ; Zederayko, 2000 ).
As adult learners, the two teacher groups enter the educational process and teaching context with their own educational and life experiences. Therefore, each group may function differently when learning new material, creating new concepts, and implementing new practices. Jacobs (1989) observed that some academic and vocational teachers feel highly territorial about their subjects and are threatened as new views of their subject content are promoted. Burrell (1993) found that academic teachers were more empathetic than vocational teachers toward students. In the process of developing and enacting actual reform policy to establish a comprehensive high school in Norway, Njerve and Sandvik (1997) concluded that “the lack of a parity of esteem between academic and vocational education stem from the teachers’ own attitudes towards each other as groups and towards the educational pathways that they represent” (p. 1). Little (1992) also identified differences between academic and vocational teachers’ professional identities and relationships within comprehensive high schools. Vocational teachers are often held in lower esteem by their peers and administrators. High school vocational and academic teachers often have little contact and little in common unless they serve on faculty committees or coach sports together. In addition, vocational teachers suffer from a lack of prestige and support from administrators, other teachers, students, and parents.
Further, given differences between academic and vocational teacher groups analysis provides a means of examining the validity of measurements of the learning organization concept in school organizations. Regarding application of the learning organization model, more specifically, the presence of two distinct teacher groups in vocational high school settings invokes a theoretical and practical question, Does equivalency exist between vocational and academic teacher groups in their perceptions of the learning organization concept?
Method
Participants and Procedures
Participants were 488 Korean vocational high school teachers employed by city and provincial Offices of Education during the 2005-2006 academic year. They were selected from both full-time vocational and non-vocational (academic) teachers working in 65 public trade industry-technical and business schools located in Seoul, South Korea including the Seoul metropolitan city, Gyeonggi province, and Incheon metropolitan city. This geographic region functions as a hub in politics, the economy, social-culture matters, and education in South Korea. More than half of the total South Korean population (about 20 million people) lives within this defined area.
Lists of vocational high schools were obtained from each city and provincial Office of Education. After numbering each school, 17 (24.6%) of the 69 public vocational high schools located in Seoul were randomly selected using a random numbers table. All full-time teachers working in the selected 17 schools were included.
There were several specific activities completed to collect data. Necessary contacts with Seoul and Incheon Metropolitan Offices of Education and Gyeonggi provincial Office of Education in Korea were made to obtain permission to collect data and to assign school staff members as data collectors. One administrative staff member in each vocational high school served as a data collector. Designated staff members served in receiving, disseminating, and returning packages of survey questionnaires.
The sampling procedure resulted in a total of 976 teacher respondents, which yielded a final response rate of 71.29%. The corrected full sample ( N =976) was divided into two portions. Respondents with odd ( n =488) and even ( n =488) case numbers compassed the two groups. To avoid bias, individual cases were each coded in school sequence by using the Statistical Package for the Social Science (SPSS 12.0). Data from the group containing even case numbers ( n =488) composed the two groups. Data of odd case numbers were used for exploratory factor analysis to develop the instrument we used. The sample portion of even case numbers was used for analyses.
Instrumentation
The Learning Organization Questionnaire for Schools ( Park, 2006 ), which was developed to measure and evaluate the degree of the learning organization’s five disciplines through teachers’ attitudes or perceptions about educational practices and organizational behaviors, was used in the study. The Questionnaire consisted of three parts, including an introduction and instructions, demographic questions, and 35 item statements measuring beliefs or attitudes. The introduction gave participants a brief presentation of the purpose of the questionnaire and how to provide responses to its items. The demographic portion included items that would categorize respondents and school types (teaching subject, gender, age, year of teaching experience, and program of school). The final portion of the instrument included statements designed to elicit respondents’ attitudes and perceptions with respect to schools as learning organizations. Items developed to reflect each construct were not randomly ordered, but sequenced to aid us in evaluating Senge’s (1990) learning organization model by identifying a theoretical index. Each item of the Questionnaire consisted of a 5-point Likert-type scale format which consisted of 1=Almost never true, 2=Usually not true, 3=Sometimes true or sometimes not true, 4=Usually true, 5=Almost always true.
Content validity of the Learning Organization Questionnaire for Schools was obtained in the English version. After creating operational definitions for each construct domain and the item pool, two procedures to determine content validity were used. First, the initial pool was reviewed and refined by a panel consisting of a professor and four doctoral students who were high school teachers or had teaching experience in American high schools. In the item refinement process, all initial items were reviewed for ease of understanding in the context of a school setting, consistency in wording and academic colloquialisms, and proper classification of each item into subscales. Second, the items refined by the first panel were reviewed by three scholars and expertise in learning organizations, human resource development, and social and contextual learning, respectively. These three experts separately reviewed items to ensure that (a) the meaning of each item was clearly stated and comprehensible, (b) all items appropriately reflected the intended domains, and (c) a broad perspective of the construct domain was covered. Specifically, based on the judgmental ratings of construct categories by the experts on a “content validity rating form” ( Gable & Wolf, 1993 , p. 99), a criterion level of unanimous agreement was employed for returning an item to a construct category. Through experts’ rating procedure, final items were selected for the five constructs.
Validity for the Korean version was established through a panel review of a Korean professor and three Korean graduate students at the University of Georgia. The Korean panel indicated any words or phrases of the Korean translated items that were inappropriate or unclear compared with those of the English version. Based on their responses, the Korean version of the questionnaire was refined. The revised Korean version was then back-translated into English and compared to the English version. Most items showed similar meanings in their content between both versions.
To establish the Questionnaire’s construct validity in the context of Korean vocational high schools, exploratory factor analysis (EFA) using data from 488 Korean vocational high school teachers was performed. The EFA was conducted using the methods of principal axis factoring for factor extraction and Promax of Kappa=5 for factor rotation. The EFA resulted in five distinct factors being derived from a total of 35 items. The names of the five factors coincide with the five disciplines (i.e., personal mastery, mental models, shared vision, team learning, and systems thinking) coined by Senge (1990) . Table 1 shows the five sub-scales and item statements that were established from results of the EFA.
Reliability (alpha) coefficients for the five factors derived by EFA ranged from .856 to .897, with an overall internal consistency value for all 35 items equal to .954. The internal consistency of all subscales was considerably higher than the minimum level of .70 recommended by Nunnally (1978) . This result showed that questionnaire items could be responded to by a large sample of respondents without incurring problems.
Table 1.
The Five Learning Organization Subscales and Items
Subscale Item Item statement Personal mastery P1 Our teachers at the school engage in continuous learning and reflection activities to achieve personal growth P2 Our teachers continually work to clarify their professional goals. P3 Our teachers view the current reality more clearly in terms of targeting their career goals. P4 Our teachers have learning opportunities in their teaching or other professional work P5 At the school, our teachers continually learn to bridge the gap between their current reality and the desired future P6 Our teachers strive to supplement their lack of skills and knowledge in their teaching and subject area. Mental
modelsM7 Our teachers often reflect on assumptions of school activities with each other to ensure they are in line with educational principles. M8 Our teachers inquire about the appropriateness of their own course or program with respect to the goals of schooling. M9 Our teachers learn and change as a result of students’ reactions during teaching. M10 Our teachers change their own pattern or unique teaching style to implement new approaches. M11 Our teachers and colleagues actively explore their assumptions and ideas with each other about educational practices. M12 Our teachers often use the significant events of classrooms to think about their beliefs of education and educational practices. M13 Our teachers are very aware of how their beliefs and assumptions affect their educational practices. M14 Our teachers can effectively explain their assumptions underlying their reasoning. Shared
visionV15 Our teachers and staff together build the school’s vision and goals. V16 Our teachers develop their personal goals to align with the whole school vision or goals. V17 Our teachers align personal class or teaching goals with the school vision and goals. V18 Our teachers feel comfortable in sharing ideas with other teachers about the school vision. V19 Our teachers are committed to a shared vision for the future of our school. V20 Our teachers agree on principles necessary to achieve school vision. V21 When changing educational practices, our teachers consider the impact on the school vision and goals. Team
LearningT22 Our teachers feel free to ask questions of other teachers or staff regardless of gender, age, and professional status at the school. T23 In our school, group or team activities are used in teacher professional development activities. T24 Our teachers are treated equally in team or committee activities. T25 Our teachers share information across course subjects and grade levels with other colleagues. T26 Our teachers believe that sharing information or knowledge through team activities is useful for solving complex schooling problems. T27 Our teachers respect other colleague’s ideas and opinions by viewing them from their colleague’s perspective. T28 Our teachers participate in open and honest conversations to share their educational best practices. Systems
thinkingS29 When developing lesson plans, our teachers consider the different needs and abilities of students. S30 When changing educational practices, our teachers consider the impact on their results to the inside and outside of the school. S31 When dealing with a student discipline problem, our teachers consider the impact on other teachers. S32 At the school, our teachers regard educational issues as a continual process rather than with a snapshot or event. S33 Our teachers attentively link the current schooling with students’ career pathways. S34 When changing and creating school rules, consistency with the policy of the governments and educational Acts is considered. S35 Our teachers consider the effect on students when dealing with school challenges. Note . P=Personal mastery; M=Mental models; V=Shared vision; T=Team learning; S=Systems thinking.Analysis and Results
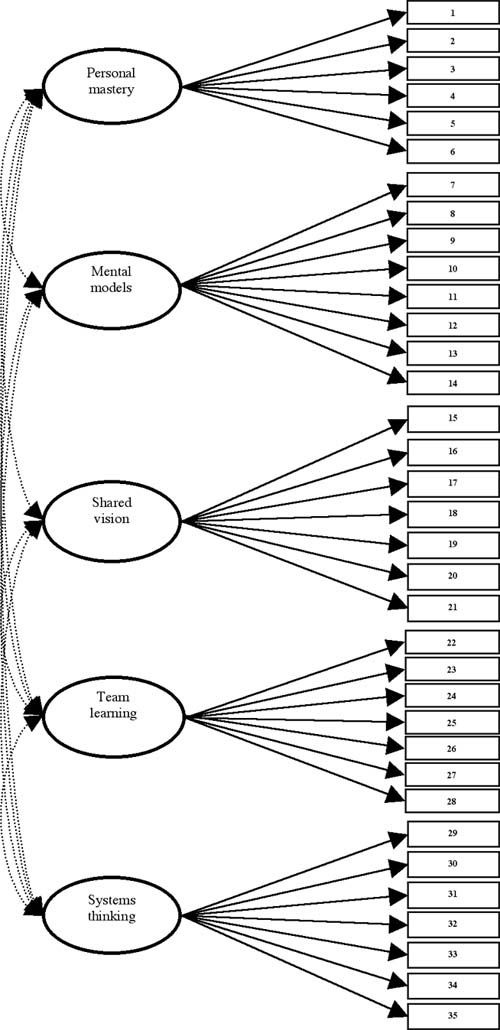
Using techniques of multi-group CFA with LISREL 8.3 ( Jöreskog & Sörbom, 1996 ), we estimated the hypothesized model to examine the equivalency of the factor structure and loadings across two different teacher groups (vocational and academic) in Korean vocational high schools. The hypothesized test model in the multigroup CFAs comprised five latent factors and 35 observed variables (see Figure 1).
Figure 1.
The hypothesized model for multi-group CFAs
In multi-group CFAs, factorial invariance tests across multiple groups are often conducted in a hierarchical fashion that consists of subsequent procedures ( Vandenberg & Lance, 2000 ). Factor structure and factor loadings invariance tests were required. However, in this study, the multi-group CFAs included the four factorial invariant model tests to explore the overall factorial invariance for the two teacher groups. Invariance of factor structure implies that the same items load on the same factors, the same factors are correlated, and the same structure holds for the measurement error variance across groups. The test to examine invariance of factor structure is called a test of configural invariance . Invariance of factor loadings means that the value of factor loadings must be the same for all groups in terms of statistical meaning. An invariant test of factor covariance determines whether factor covariances are the same for all groups, in addition to invariance of the factor structure and factor loadings. The common procedure for invariant tests involves conducting an initial run of multi-group CFAs in which the only invariance constraint imposed is that the same parameters must exist for all groups. Subsequent runs add more and more invariance constraints. Consequently, a series of nested models can be tested against each other, using the chi-square difference test.
Demographic Variables and Descriptive Statistics
Table 2 presents characteristics of the 488 participants used in the multi-group CFAs. The two teacher groups differed overall on some demographic measures. In the vocational teacher group, 66.1% were male, whereas 63.3% of academic teachers were female. In the academic group, 61.2% of teachers were less than 40 years old, compared to only 36.6% of vocational teachers. The vocational teacher group had a mean age of 41.62 (SD=8.475), whereas the academic teacher group had a mean age of 37.47 (SD=8.709). Teachers with 16 years or more of experience exceeded 50.7% in the vocational group, but only 37.3% of the academic group. Vocational teachers reported a mean of 15.19 years (SD=8.583) in teaching experience. Academic teachers had a mean of 11.94 (SD=9.329 years). A total of 55.5% of vocational teachers and 39.3% of academic teachers worked for trade-industry and technical schools. About 43% of the academic teacher group worked for business high schools.
Table 2.
Demographic Variables for Two Teacher Groups
Type of teacher Variable Category Vocational a Academic b n % n % Gender Male 193 66.1 72 36.7 Female 99 33.9 124 63.3 Age Less than 29 years 33 11.3 40 20.8 30-39 years 74 25.3 78 40.7 40-49 years 155 53.1 55 28.6 More than 50 years 30 9.9 21 10.3 Missing – – 2 – Teaching experience Less than 5 years 55 19.0 68 35.2 6-15 years 88 30.3 53 27.5 16-25 years 117 40.4 54 28.0 More than 26 years 30 10.3 18 9.3 Missing 2 — 3 — School/program type Trade-industry / technical 162 55.5 77 39.3 Business 103 35.5 84 42.9 Comprehensive vocational 27 9.2 35 17.9 Note . a n=292. b n=196.Table 3 shows the means and standard deviations of the 35 items for the two teacher groups. Korean vocational school teachers held relatively high mean scores on the five subscales. Considering each item was measured using a 5-point Likert-type scale, Korean vocational teachers’ responses were positive.
Table 3.
Items for Vocational and Academic Teacher Groups
Item Vocational teachers Academic teachers Mean SD Mean SD 1p 3.95 .725 3.93 .691 2p 3.93 .697 3.90 .713 3p 3.68 .755 3.63 .757 4p 3.86 .749 3.79 .725 5p 3.93 .736 3.76 .678 6p 4.09 .700 4.01 .698 7m 3.55 .813 3.62 .829 8m 3.64 .780 3.66 .758 9m 3.78 .776 3.89 .733 10m 3.54 .761 3.55 .725 11m 3.66 .781 3.54 .819 12m 3.53 .788 3.62 .798 13m 3.77 .716 3.80 .810 14m 3.54 .724 3.47 .754 15v 3.30 .848 3.11 .943 16v 3.44 .791 3.22 .877 17v 3.36 .768 3.27 .817 18v 3.40 .825 3.32 .896 19v 3.32 .784 3.20 .898 20v 3.50 .744 3.40 .863 21v 3.53 .724 3.49 .807 22t 3.47 .879 3.53 .984 23t 3.35 .796 3.19 .935 24t 3.41 .806 3.20 .981 25t 3.50 .748 3.46 .896 26t 3.60 .723 3.63 .810 27t 3.67 .704 3.63 .750 28t 3.47 .775 3.52 .826 29s 3.65 .751 3.67 .768 30s 3.66 .708 3.56 .824 31s 3.68 .767 3.68 .813 32s 3.79 .728 3.80 .691 33s 3.80 .813 3.77 .825 34s 3.71 .728 3.62 .889 35s 3.99 .760 3.96 .803 Note . Items 1p-6p measure personal mastery. Items 7m-14m measure mental models. Items 15v-21v measure shared vision. Items 22t-28t measure team learning. Items 29s-35s measure systems thinking.Preliminary Analysis
Before conducting the multi-group CFAs to test the measurement model, some preliminary analyses were conducted. Values for skewness and kurtosis were examined as part of a data screen process to check the distribution of scores, and were all less than |2.0|. As a general rule of thumb, unless the skewness value for any item is greater than |2.0| or kurtosis is greater than |7.0|, the item is not seriously nonnormally distributed ( Fabrigar, Wegener, MacCallum, & Strahan, 1999 ). Considering this rule, there were no items found to be nonnormally distributed. The multivariate normality test was conducted using PRELIS 2.53, with a relative multivariate kurtosis value of 1.112. This result indicated there were no serious deviations from multivariate normality. It also verified the appropriateness of maximum-likehood estimation used in this study ( Bandalos, Finney, & Geske, 2003 ).
To check for outliers, the dataset was screened using normtest macro developed by DeCarlo (1997) via SPSS 12.0. DeCarlo’s normtest identified five outliers (Cases 261, 405, 156, 292, 464) with F values bigger than critical F values (critical F (05/ n ) ( df =41, 446) =79.77; critical F (.01/ n ) ( df =41, 446 =84.73). The five cases had considerably large F values of 140.13, 134.71, 127.15, 118.55, and 116.37, respectively. These five outliers were significant at both .05 and .01 levels. These five outliers were not included in our analyses because a few model fit indexes (e.g., Comparative Fit Index, Incremental Fit Index) are slightly different when outliers are included. A final screening procedure to check for missing data did not detect any missing values for variables.
CFA, including multi-group CFA, generally requires an assumption of the non-existence of collinearity among variables. Collinearity exists when “absolute values of one or more of the zero-order correlation coefficients between independent variables are relatively high, say .70 or larger” ( Mueller, 1996 , p. 21). Inspection of the correlation matrix showed no correlation coefficients larger than .70. Therefore, the problem of collinearity did not exist.
Factorial Invariant Tests of Hypothesized Model
To test factorial invariance, the initial step involved examining separate covariance matrices for the two teacher groups, using PRELIS 2.53. Then, four multi-group CFAs were conducted in a hierarchical procedure. In each multi-group CFA, the metric of the factors was established by setting the loading of one variable from each factor to a value of 1. Setting the factor variance to a value of 1 was avoided because factor variances were not assumed to be identical across groups. The variables set to a value of 1 were Items 2p, 11m, 15v, 25t, and 32s. These items were selected because they each had the highest loading values in the five factors identified by the exploratory factor analysis to develop the Questionnaire (see Park, 2006 ) used in the study.
The initial multi-group CFA was run on the invariant tests of factor structure across the two different teacher groups. Then, three subsequent invariant tests from invariance of factor loadings to invariance of factor variances were computed. Subsequent runs imposed increasingly restrictive constraints across the two teacher groups, and incorporated into the LISREL syntaxes (see Appendix A). As an initial step, the invariant test of factor structure , referred to as tests of configural invariance ( Vandenberg & Lance, 2000 ), included the following specifications: (a) the same numbers and patterns of both factors and their loadings were freely estimated factor loadings for each teacher group, (b) factor variances and correlations were freely estimated and allowed to be heterogeneous across the two teacher groups, and (c) the error variances of all items were freely estimated and allowed to be heterogeneous across the two teacher groups. The second step in the analysis tested the invariance of factor loadings . The factor loadings of all items were constrained to be equal across the two teacher groups, whereas the error variances for all items, factor variances, and factor correlations were freely estimated and allowed to be heterogeneous across the two teacher groups. The third step, the invariant test of measurement errors , tested the invariance of factor loadings and measurement error variances. In this step, as additional constraints, the factor loadings and error variances for all items were held to the same values across the two teacher groups, whereas factor variances and factor correlations were freely estimated and allowed to be heterogeneous across the two teacher groups. The fourth step, the invariant test of factor variances , tested invariance of factor loadings, measurement error variances, and factor variances. In this test design, the factor loadings and error variances for all items, as well as factor variances were additional invariance constraints. Thus, they were held equal across the teacher groups. Only the parameter of factor correlations in the fourth test design was freely estimated and allowed to be heterogeneous across the two teacher groups. Table 4 shows results of these four invariant tests which were all designed to examine factorial invariance across academic and vocational teacher groups.
Table 4.
Results of Factorial Invariant Tests across the Vocational and Academic Teacher Groups
Tested model χ 2
( df )χ 2 / df Δ χ 2
( Δdf )SRMR RMSEA NNFI CFI Invariant test of factor structure 2127.23*
(1111)1.92 .070 .061 .97 .97 Invariant test of factor loadings 2152.36*
(1141)1.89 25.13
(30).086 .060 .97 .97 Invariant test of measurement errors 2201.90*
(1176)1.87 49.54
(35).090 .061 .97 .97 Invariant test of factor variances 2201.90*
(1176)1.87 0.0
(0.0).090 .061 .97 .97 Note . χ 2 difference tests were conducted between each subsequent test and the previous test. * p< .01
No index of model fit is generally accepted as superior to the others, so several fit indexes are needed to ensure that multiple aspects of model fit can be captured ( Hu & Bentler, 1995 ). Accordingly, indices for evaluating the overall model fit included the chi-square ( χ 2 ), SRMR, RMSEA, NNFI, and CFI based on the related literature (e.g, Gable & Wolf, 1993 ; Hoyle & Panter, 1995 ; Hu & Bentler, 1998 ; Vandenberg & Lance, 2000 ; see Table 4).
Although all values of SRMR were moderately high, they did not exceed the cut-off value of .10 or less recommended by Kline (1998) . The values of RMSEA in the five invariant tests were less than .061. Compared to a cutoff value close to .06 cited by Hu and Bentler (1998) , or a cutoff value of less than .08 recommended by Vandenberg and Lance (2000) , these values are acceptable and indicate well-fitting models. The values of NNFI and CFI were .97 in all test models and indicate reasonable model fit. Consequently, results of the good fit indices indicated that the hypothesized learning organization models to test factorial invariance should not be rejected. Thus, the four parameters (factor structure, factor loadings, measurement error variances, and factor variances) were equivalent across the vocational and academic teacher groups in Korean vocational public high schools.
In addition to evaluating overall model fit, differences in chi-square values were examined to determine the invariance of related parameters across the two teacher groups from the four subsequent invariance tests ( Cheung & Rensvold, 1999, 2000 ; Vandenberg & Lance, 2000 ). As an assessment of invariance constraints in factorial invariant tests, the most frequently used approach for testing the difference between any two adjacent test models is the chi-square difference test ( Vandenberg & Lance ). In this study, the invariance in the model of each subsequent test was determined by examining whether adding invariance constraints to the model resulted in a statistically significant increase in the chi-square statistic between any two adjacent test steps. For example, a statistically significant difference in the chi-square statistic between the invariant test of factor structure and the invariant test of factor loadings indicates that at least one of the factor loadings has significantly different values for the two teacher groups. Similarly, a significant increase of the chi-square statistic from the invariant test of factor loadings to the invariant test of measurement error may lead to a conclusion that at least one of the error variances for each item is significantly different across the two teacher groups. Tests of _ 2 differences between adjacent models were not all statistically significant at the .01 level (see Table 4).
These results strongly support a finding of no statistical differences between the invariance test models. Conversely, adding the invariance constraints imposed by each subsequent test model did not produce a significantly poorer model fit compared to the test models with fewer constraints. This indicated that the factor structure, factor loadings, error variances, and factor variances are not significantly different across the two teacher groups.
Additionally, the change of CFI statistics between the invariance test models was examined as a criterion of factorial invariance. Regarding the factorial invariance tests, Cheung and Rensvold (1999) argued that changes in CFI of -.01 or less indicate that the invariance hypothesis should not be rejected, but when differences lie between -.01 and -.02, the existence of differences between groups should be suspected. Distinct differences between invariant test models exist when the change of CFI values are greater than -.02. Data in Table 4 reveals that CFI values between the four invariant test models are consistently at .97. The consistency of CFI values between the models supported the factorial invariance of the hypothesized models across teacher groups. Specifically, the consistency of CFI values offers additional evidence that the factor structure, factor loadings, measurement error variances, and factor variances were not significantly different across the two teacher groups.
It should be noted that the factorial invariance that resulted from these tests was determined on an entire set of parameters such as all factor loadings or measurement errors of all items. For example, in this study, the invariance test of factor loadings revealed the equivalency of factor loading values across the two teacher groups. However, the loading values on each item and some parameters, which were produced from the invariance test of factor loadings, were not the same between the two groups, although they were very similar (see Table 5).
Table 5
Item Loadings, t-values, and R2 of Vocational and Academic Teachers
Item Vocational teacher group Academic teacher group Loading ( t ) value R 2 Loading ( t ) value R 2 1p 0.73 (15.98) 0.53 0.76 (15.98) 0.57 2p 0.75 0.56 0.77 0.59 3p 0.66 (14.00) 0.43 0.65 (14.00) 0.42 4p 0.65 (14.01) 0.42 0.66 (14.01) 0.44 5p 0.72 (15.86) 0.51 0.76 (15.86) 0.57 6p 0.77 (16.49) 0.59 0.75 (16.49) 0.56 7m 0.64 (12.30) 0.41 0.61 (12.30) 0.38 8m 0.73 (13.96) 0.53 0.73 (13.96) 0.53 9m 0.57 (11.40) 0.33 0.58 (11.40) 0.34 10m 0.55 (11.06) 0.31 0.57 (11.06) 0.32 11m 0.68 0.46 0.64 0.41 12m 0.71 (13.71) 0.51 0.71 (13.71) 0.51 13m 0.63 (12.06) 0.40 0.59 (12.06) 0.35 14m 0.66 (12.50) 0.43 0.61 (12.50) 0.37 15v 0.71 0.50 0.70 0.49 16v 0.75 (15.19) 0.56 0.71 (15.19) 0.51 17v 0.75 (15.85) 0.56 0.80 (15.85) 0.63 18v 0.75 (15.45) 0.57 0.74 (15.45) 0.55 19v 0.75 (15.61) 0.56 0.76 (15.61) 0.58 20v 0.75 (15.30) 0.56 0.72 (15.30) 0.52 21v 0.76 (15.30) 0.57 0.71 (15.30) 0.50 22t 0.56 (11.20) 0.32 0.55 (11.20) 0.30 23t 0.65 (12.69) 0.42 0.61 (12.69) 0.38 24t 0.69 (13.60) 0.48 0.67 (13.60) 0.45 25t 0.70 0.48 0.68 0.47 26t 0.74 (14.45) 0.55 0.72 (14.45) 0.51 27t 0.73 (14.14) 0.53 0.69 (14.14) 0.48 28t 0.71 (14.05) 0.50 0.71 (14.05) 0.50 29s 0.67 (13.58) 0.45 0.67 (13.58) 0.45 30s 0.76 (14.85) 0.58 0.69 (14.85) 0.48 31s 0.64 (12.61) 0.40 0.60 (12.61) 0.36 32s 0.70 0.48 0.71 0.50 33s 0.72 (14.57) 0.52 0.73 (14.57) 0.53 34s 0.69 (13.48) 0.48 0.62 (13.48) 0.38 35s 0.72 (14.45) 0.52 0.71 (14.45) 0.51 Note . Standardized loading values were used. * p < .05. An absolute t-value of greater than or equal to 2.0 was the cut-off value used to determine statistical significance.The overall goodness-of-fit indexes, the nonsignificant statistical difference of χ 2 between adjacent invariant models, and a consistent value of CFI, supported inferences of factorial invariance in the learning organization measures across the two teacher groups. Vocational and academic teacher groups in Korean vocational high schools were invariant or equivalent with respect to the parameters (factor structure, factor loadings measurement error, and factor variance) on which constraints were imposed. Therefore, in measuring the learning organization model suggested by Senge (1990) , we conclude that there were no statistically significant differences in factor structure, factor loadings, and factor correlations between academic and vocational teachers in Korean vocational high school contexts.
Discussion and Implications
In this study, the multi-group CFA referred to the factorial invariance tests that examined how generalizable the hypothesized learning organization model was for the two Korean teacher groups. Results of the four invariant tests produced reasonable fit between the model and data. Further, the overall model fit of each invariant test reflected the significant role of each factor in appraising the test for invariance across groups ( Vandenberg & Lance, 2000 ). The four factorial invariant tests indicate that the factor structure, loadings, and all other parameters underlying the set of questions used to measure learning organization were equivalent between Korean vocational and academic high school teachers. Thus, a measurement model for learning organization is plausible across the two groups. In terms of a practical implication, using a measurement model for these two groups can be less intricate, and it is not problematic regarding validity of measuring the learning organization.
Results provide evidence that the five disciplines of Senge’s (1990) learning organization theory can be operationalized and equally applied in the two distinct Korean teacher groups. More specifically, results provide evidence that Senge’s five disciplines of the learning organization model provide the same understanding and meaning for both Korean teacher groups. In terms of learning organization theory, the presence of factorial invariance means that the same items loaded on the same factors, and that the same factor structure held across groups. Importantly, results of the four invariance tests verify the generalizability of Senge’s theory of learning organization as a manifestation of five factors in Korean vocational high schools.
Use of the multi-group CFA and examination of invariance tests of the factor structure and loadings for the two teacher groups clearly demonstrated the validity of the instrument for measuring the learning organization model. If non-factorial invariance was detected, we would have concluded that the instrument was measuring the construct differently for different groups in the same population, or that the construct did not exist in the same form for all groups. This, however, was not the case. Differences in the factor structure or factor loadings might have resulted if indices (i.e., questionnaire items) for the learning organization model had different relevance or meaning to the different teacher groups. This is an issue of validity in that constructs underlying the learning organization model are, to some degree, not the same for everyone in the population. Ultimately, in this study, evidence of factorial invariance across the two groups, each with some common and some critically different characteristics and professional experiences, provides empirical support for the construct validity of the measurement model to adequately describe (and of the instrument to measure) the theory of learning organization.
The effort to improve educational quality or reform schooling has been a key agenda to many educators and school administrators in both the U.S. and Korea as the education authority of these and other counties continue to push for improvement in school performance. Application of the learning organization concept to schools has been considered as a strategy to address the failure of education and school reforms to improve school performance, often measured by student academic achievement ( Duffy, 1997 ; Fullan, 1995 ; Hannay, Erb, & Ross, 2001 ; Seller, 2001 ). Also, theoretically, the need for empirical research on the theory of learning organization as a measurement issue has been established ( Griego & Gerory, 1999 ; Moilanen, 2001 ; Silins et al., 1998 ; Yang, Watkins, & Marsick, 1998 ; Zederayko, 2000 ). This study was a first step toward an empirical test of the learning organization model promoted by Senge’s (1990) five disciplines in vocational public high schools by analyzing the perceptions of two different teacher groups. Ultimately, this study may provide substantial clues in both practice and theory for developing a school change policy and for building learning organizations in educational settings.
Actually, many schools of the United States have followed the disciplines and guides offered by the learning organization model in developing their organizations ( Wyckoff, 1998 ). It also seems that applying the learning organization concept to Korean schools, specifically vocational high schools, is essential to comprehensively deal with current organizational problems such as the explosive increase in vocational student advancement to higher education, the existence of severe stigma on the education received from vocational high schools, and dramatic decreases in student enrollment to vocational high schools. In a similar vein, the Korea Research Institute for Vocational Education and Training (2000) reported that systemic changes to secondary vocational education in South Korea are needed in the areas of program types, curriculum, and career opportunities in accordance with changes in the nature of work, continuing education, and a decline of the school-age population. In this situation, we tested the learning organization model across the two different teacher groups in Korean vocational high schools. Results demonstrate that the concept of learning organizations is applicable to both groups of Korean vocational high school teachers.
References
Bandalos, D. L., Finney, S. J., & Geske, J. A. (2003). A model of statistics performance based on achievement goal theory. Journal of Educational Psychology, 95 , 604-616.
Burrell, L. P. (1993, December). A paradigm on student empathy: Vocational versus academic . Paper presented at the Trade and Industrial Educational Research Forum of the American Vocational Association Convention, Nashville, TN. (ERIC Document Reproduction Service No. ED369972)
Cheung, G. W., & Rensvold, R. B. (1999). What constitutes significant differences in evaluating measurement invariance? Paper presented at the 1999 conference of the Academy of Management, Chicago.
Cheung, G. W., & Rensvold, R. B. (2000). Assessing extreme and acquiescence response sets in cross-cultural research using structural equations modeling. Journal of Cross-Cultural Psychology, 31 , 187-212.
Dalin, P. (1996). Can schools learn? Preparing for the 21st century. NASSP Bulletin, 80 , 9-15.
DeCarlo, L. T. (1997). On the meaning and use of kurtosis. Psychological Methods, 2 , 292-307.
Diggins, P. B. (1997). Reflections on leadership characteristics necessary to develop and sustain learning school communities. School Leadership & Management, 17 , 413-425.
DuFour, R. P. (1997). The school as a learning organization: Recommendations for school improvement. NASSP Bulletin, 81 , 81-87.
Duffy, F. M. (1997). Knowledge work supervision: Transforming school systems into high performing learning organization. International Journal of Educational Management, 11 , 26-31.
Fabrigar, L. R.,Wegener, D. T., MacCallum, R. C., & Strahan, E. J. (1999). Evaluating the use of exploratory factor analysis in psychological research. Psychological Method, 3 , 272-299.
Fullan, M. (1993). Change forces: Probing the depths of educational reform (School Development and the Management of Change Series 10). London: Falmer.
Fullan, M. (1995). The school as learning organization: Distant dreams. Theory into Practice, 34 , 230-235.
Gable, R. K., & Wolf, M. B. (1993). Instrument development in the affective domain: Measuring attitudes and values in corporate and school settings (2nd ed.). Boston: Kluwer Academic.
Griego, O. V., & Gerory, G. D. (1999). Predictors of learning organizations: A human resources development practitioner’s perspective. Proceedings of the Academy of Human Resource Development 1999 Conference, Arlington, VA. (ERIC Document Reproduction Service No. ED431973)
Hannay, L. M., Erb, C. S., & Ross, J. A. (2001). Building change capacity within secondary schools through goal-driven and living organizations. School Leadership & Management, 21 , 271-287.
Hoyle, R. H., & Panter, A. T. (1995). Writing about structural equation models in structural equation modeling. In R. H. Hoyle (Ed.), Structural equation modeling: Concepts, issues, and application (pp. 158-176). Thousand Oaks, CA: Sage.
Hu, L., & Bentler, P. M. (1995). Evaluating model fit. In R. H. Hoyle (Ed.), Structural equation modeling: Concepts, issues, and applications (pp. 76-99). Thousand Oaks, CA: Sage.
Hu, L., & Bentler, P. M. (1998). Fit indices in covariance structure analysis: Sensitivity to underparameterized model misspecification. Psychological Methods, 3 , 424-453.
Jacobs, H. (1989). The growing need for interdisciplinary curriculum content. In H. H. Jacobs (Ed.), Interdisciplinary curriculum: Design and implementation (pp. 1-11). Alexandria, VA: Association for Supervision and Curriculum and Implementation.
Jenlink, P. (1995). Preparing for our future: Transcending existing mindsets of schools and change. In P. Jenlink (Ed.), System change: Touchstones for the future school (pp. 1-7). Palatine, IL: Skylight Training and Publishing.
Jöreskog, K. G., & Sörborm, D. (1996). LISREL 8: User’s reference guide. Chicago: Scientific Software.
Keefe, J. W., & Howard, E. R. (1997). The school as a learning organization. NASSP Bulletin, 81 , 35-44.
Kline, R. B. (1998). Principles and practice of structural equation modeling . New York: Guilford.
Korea Research Institute for Vocational Education and Training. (2000). Future policy measures to improve vocational high school education in Korea. Seoul: Author.
Leithwood, K., Leonard, L., & Sharrat, L. (1998). Conditions fostering organizational learning in schools. Educational Administration Quarterly, 34 , 243-276.
Little, J. W. (1992). Two worlds: Vocational and academic teachers in comprehensive high schools. Berkeley: University of California, National Center for Research in Vocational Education. (ERIC Document Reproduction Service No. ED350404)
Moilanen, R. (2001). Diagnostic tools for learning organizations. The Learning Organization, 8 , 6-20.
Mueller, D. J. (1986). Measuring social attitudes: A handbook for researchers and practitioners. New York: Teachers College Press.
Njerve, I., & Sandvik, O. (1997, December). Bridging the gap between vocational and academic teachers: The combined initial teacher education experiment of Agder College, Norway. Paper presented at the annual meeting of the International Vocational Education and Training Association, Las Vegas, NV. (ERIC Document Reproduction Service No. ED416405)
Nunnally, J. C. (1978). Psychometric theory (2nd ed.). New York: McGraw-Hill.
O’Sullivan, F. (1997). Learning organizations: Reengineering schools for life long learning. School Leadership & Management, 17 , 217-230.
Park, J. H. (2006). Measurement and validation of Senge’s learning organization model in Korean vocational high schools. Unpublished doctoral dissertation, The University of Georgia.
Redding, J. C., & Kamm, R. M. (1999). Just-in-time staff development: One step to the learning organization. NASSP Bulletin, 83 , 28-31.
Seller, W. (2001). Reforming school: Building the capacity for change. School Leadership & Management, 21 , 255-259.
Senge, P. M. (1990). The fifth discipline: The art and practice of the learning organization. New York: Doubleday-Currency.
Senge, P. M., Cambron-McCabe, N., Lucas, T., Smith, B., Dutton, J., & Kleiner, A. (2000). Schools that learn: A fifth discipline fieldbook for educators, parents, and everyone who cares about education. New York: Doubleday-Currency.
Silins, H. C., Mulford, W. R., & Zarins, S. (2002). Organizational learning and school change. Educational Administration Quarterly, 38 , 613-642.
Silins, H., Zarins, S., & Mulford, B. (1998). What characteristics and processes a school as a learning organization? Is this a useful concept to apply to schools? Paper presented at the annual meeting of the Australian Association for Research in Education, Adelaide, Australia. (ERIC Document Reproduction Service No. ED452588)
Vandenberg, R. J., & Lance, C. E. (2000). A review and synthesis of the measurement invariance literature: Suggestions, practices, and recommendations for organizational research. Organizational Research Methods, 1 , 4-70.
Weller, S. J., & Weller, L. D. (1997). Quality learning organization and continuous improvement: Implementing the concept. NASSP Bulletin, 81 , 62-70.
Wyckoff, S. L. (1998). Schools as learning organizations: A study of instrument development. Unpublished doctoral dissertation, Wichita State University.
Yang, B., Watkins, K. E., & Marsick, V. J. (1998). Examining construct validity of dimension of the learning organization questionnaire. Proceedings of the 1998 conference of the Academy of Human Resource Development, Oak Brook, IL. (ERIC Document Reproduction Service No. ED428227)
Zederayko, G. E. (2000). Variables in schools becoming learning organizations. Unpublished doctoral dissertation, The University of Montana.
Zederayko, G. E., & Ward, K. (1999). Schools as learning organization: How can the work of the teachers be both teaching and learning. NASSP Bulletin, 83 , 35-45.
Appendix A
LISREL syntax for factorial invariance tests
1. Invariant test of factor structure
observed variables
p1 p2 p3 p4 p5 p6 m7 m8 m9 m10 m11 m12 m13 m14 v15 v16 v17 v18 v19 v20
v21 t22 t23 t24 t25 t26 t27 t28 s29 s30 s31 s32 s33 s34 s35
covariance matrix from file: voc.cov
sample size 290
latent variables: PM MM SV TL ST LO
relationships:
v15 = 1* SV
v16 v17 v18 v19 v20 v21 = SV
p2 = 1*PM
p1 p3 p4 p5 p6 = PM
t25 = 1*TL
t22 t23 t24 t26 t27 t28 = TL
m11 = 1*MM
m7 m8 m9 m10 m12 m13 m14 = MM
s32 = 1*ST
s29 s30 s31 s33 s34 s35 = ST
options migroup 2: Academic
covariance matrix from file: aca.cov
sample size 193
latent variables: PM MM SV TL ST LO
relationships:
v15 = 1* SV
v16 v17 v18 v19 v20 v21 = SV
p2 = 1*PM
p1 p3 p4 p5 p6 = PM
t25 = 1*TL
t22 t23 t24 t26 t27 t28 = TL
m11 = 1*MM
m7 m8 m9 m10 m12 m13 m14 = MM
s32 = 1*ST
s29 s30 s31 s33 s34 s35 = STset the error variances of p1 – s35 free
set the correlations of PM MM SV TL ST free
set the variances of PM MM SV TL ST free
options mi sc2. Invariant test of factor loadings
observed variables
p1 p2 p3 p4 p5 p6 m7 m8 m9 m10 m11 m12 m13 m14 v15 v16 v17 v18 v19 v20
v21 t22 t23 t24 t25 t26 t27 t28 s29 s30 s31 s32 s33 s34 s35
covariance matrix from file: voc.cov
sample size 290
latent variables: PM MM SV TL ST LO
relationships:
v15 = 1* SV
v16 v17 v18 v19 v20 v21 = SV
p2 = 1*PM
p1 p3 p4 p5 p6 = PM
t25 = 1*TL
t22 t23 t24 t26 t27 t28 = TL
m11 = 1*MM
m7 m8 m9 m10 m12 m13 m14 = MM
s32 = 1*ST
s29 s30 s31 s33 s34 s35 = ST
options migroup 2: Academic
covariance matrix from file: aca.cov
sample size 193
latent variables: PM MM SV TL ST LO
relationships:
!v15 = 1* SV
!v16 v17 v18 v19 v20 v21 = SV
!p2 = 1*PM
!p1 p3 p4 p5 p6 = PM
!t25 = 1*TL
!t22 t23 t24 t26 t27 t28 = TL
!m11 = 1*MM
!m7 m8 m9 m10 m12 m13 m14 = MM
!s32 = 1*ST
!s29 s30 s31 s33 s34 s35 = STset the error variances of p1 – s35 free
set the correlations of PM MM SV TL ST free
set the variances of PM MM SV TL ST free
options mi sc3. Invariant test of measurement error
observed variables
p1 p2 p3 p4 p5 p6 m7 m8 m9 m10 m11 m12 m13 m14 v15 v16 v17 v18 v19 v20
v21
t22 t23 t24 t25 t26 t27 t28 s29 s30 s31 s32 s33 s34 s35
covariance matrix from file: voc.cov
sample size 290
latent variables: PM MM SV TL ST LO
relationships:
v15 = 1* SV
v16 v17 v18 v19 v20 v21 = SV
p2 = 1*PM
p1 p3 p4 p5 p6 = PM
t25 = 1*TL
t22 t23 t24 t26 t27 t28 = TL
m11 = 1*MM
m7 m8 m9 m10 m12 m13 m14 = MM
s32 = 1*ST
s29 s30 s31 s33 s34 s35 = ST
options migroup 2: Academic
covariance matrix from file: aca.cov
sample size 193
latent variables: PM MM SV TL ST LO
relationships:
!v15 = 1* SV
!v16 v17 v18 v19 v20 v21 = SV
!p2 = 1*PM
!p1 p3 p4 p5 p6 = PM
!t25 = 1*TL
!t22 t23 t24 t26 t27 t28 = TL
!m11 = 1*MM
!m7 m8 m9 m10 m12 m13 m14 = MM
!s32 = 1*ST
!s29 s30 s31 s33 s34 s35 = ST!set the error variances of p1 – s35 free
set the correlations of PM MM SV TL ST free
set the variances of PM MM SV TL ST free
options mi sc4. Invariant test of factor variance
observed variables
p1 p2 p3 p4 p5 p6 m7 m8 m9 m10 m11 m12 m13 m14 v15 v16 v17 v18 v19 v20
v21
t22 t23 t24 t25 t26 t27 t28 s29 s30 s31 s32 s33 s34 s35
covariance matrix from file: voc.cov
sample size 290
latent variables: PM MM SV TL ST LO
relationships:
v15 = 1* SV
v16 v17 v18 v19 v20 v21 = SV
p2 = 1*PM
p1 p3 p4 p5 p6 = PM
t25 = 1*TL
t22 t23 t24 t26 t27 t28 = TL
m11 = 1*MM
m7 m8 m9 m10 m12 m13 m14 = MM
s32 = 1*ST
s29 s30 s31 s33 s34 s35 = ST
options migroup 2: Academic
covariance matrix from file: aca.cov
sample size 193
latent variables: PM MM SV TL ST LO
relationships:
!v15 = 1* SV
!v16 v17 v18 v19 v20 v21 = SV
!p2 = 1*PM
!p1 p3 p4 p5 p6 = PM
!t25 = 1*TL
!t22 t23 t24 t26 t27 t28 = TL
!m11 = 1*MM
!m7 m8 m9 m10 m12 m13 m14 = MM
!s32 = 1*ST
!s29 s30 s31 s33 s34 s35 = ST!set the error variances of p1 – s35 free
set the correlations of PM MM SV TL ST free
!set the variances of PM MM SV TL ST free
options mi sc