JARS v52n3 - Genetic Study of Freezing Tolerance in Rhododendron Populations: Implications for Cold Hardiness Breeding
Genetic Study of Freezing
Tolerance in Rhododendron Populations: Implications for Cold Hardiness Breeding
Chon C. Lim and Rajeev Arora
Division of Plant and Soil Sciences
West Virginia
University
Stephen L. Krebs
The David G. Leach Research Station of the Holden
Arboretum
Synopsis
Few genetic studies have been conducted on the inheritance of cold hardiness (CH) in woody plants. We initiated the research presented here to develop a reliable and non-destructive method of determining CH in rhododendrons by using controlled laboratory freeze-thaw tests, and to apply this methodology to progeny populations segregating for this trait. The distributions of leaf-freezing tolerances (a measure of CH) in F 2 and backcross populations derived from a R. catawbiense x R. fortunei cross - suggested that as few as three genes with strong additive effects were controlling variation in hardiness. Differences in mid winter freezing tolerance were primarily due to differences in acclimating ability among the segregants. Laboratory-based cold hardiness screens of rhododendron seedlings may help predict mature plant performance in the field, thus providing a powerful tool for breeders and researchers investigating plant response to freezing stress.
Introduction
A unique feature of many temperate-zone rhododendrons is their ability to withstand severe low temperatures as broad-leaved evergreens. Within the genus, this ability varies widely. Sakai etal. (1986) found that many species in the Ponticum subsection ( R. brachycarpum and R. maximum ) are leaf-hardy to -60°C and bud-hardy to -30°C, whereas cold-tender species such as R. barbatum and R. griersonianum show both leaf and bud damage at temperatures approaching -18°C. These researchers found that hardiness correlates with provenance (altitude and latitude), suggesting that the trait has evolved through natural selection acting on existing genetic variability.
The primary goal of most Rhododendron breeders working in cold climates has been to combine the ornamental diversity found in less hardy Asian taxa with the superior cold hardiness (CH) characteristic of several North American and Asian species. This goal has been achieved in many instances, but the process has often been slow and inefficient. Part of the reason for this has been methodological. The conventional approach of pedigree breeding and single-site evaluation is likely not optimal for breeding a multigenic and physiologically complex trait. Breeding efficiency has been improved in programs in which mass selection and multiple site testing are used to increase CH (Uosukainen and Tigerstedt, 1988).
A limited understanding of the genetic control of freezing tolerance has also hampered efforts in cold hardiness breeding. It would be very useful, for example, to be able to predict the outcome of cold-hardy x cold-tender crosses and have a sense of how much variability in hardiness occurs among progeny. Prediction is important because it influences population size, number of generations, and breeding strategy needed to arrive at a desired trait. We know, anecdotally, that segregation for CH exists among selected advanced-generation progeny (e.g., sibling cultivars which differ in their bud hardiness by as much as a hardiness zone), but the full variation in discarded populations is generally not described or quantified.
The efficiency of breeding programs is further restricted by the difficulty in obtaining early and reliable estimates of a plant's cold hardiness. Currently, breeders generally grow seedlings to maturity in order to assess winter damage to floral buds. This is a slow (5+ years) and sometimes unreliable process - bud damage on a single plant can often range from 0 to 100% in one season (Gilkey, 1996; Krebs, unpublished data). Annual variation in field estimates of CH can also occur due to uncontrollable factors; such as snow cover, wind, fluctuating temperatures, and desiccation (Fowler and Gusta, 1979).
The research presented here was undertaken to improve methods of measuring CH in rhododendrons and increase our understanding of the genes controlling this trait. Much of this paper describes a laboratory assay developed to simulate natural freeze-thaw stresses on rhododendron tissues. Although field trials provide the ultimate test of winter survival, controlled laboratory measurements of freezing tolerance offer significant advantages. Severe cold conditions can be generated in the laboratory under controlled conditions without the vagaries of weather. Furthermore, this test is non-destructive because detached tissues (e.g., leaves or buds) are used instead of the whole plant.
Our laboratory assay was used to characterize segregation for CH among progeny of control led crosses. We chose to evaluate juvenile plant material (seedlings) with the thought that estimates of freezing tolerance at this stage might predict mature plant performance and thus provide greater efficiency in breeding programs. Measurements were made on seedlings in both cold-acclimated and non-acclimated conditions, because variation in CH among woody plants usually reflects differences in cold acclimation ability - ability of a frost hardy plant to increase its freezing tolerance during fall and winter. The extent of acclimation depends upon a myriad of factors, such as plant species, its provenance, seasonal timing and speed of acclimation, etc. (Raulston and Tripp, 1995).
Based on the distribution of hardiness phenotypes in these segregating populations, we could draw conclusions about the number of genes that control freezing tolerance and the type of gene action involved. The implications of our methodology and gene model for CH are discussed in the context of rhododendron breeding and cold hardiness research in general.

|
Materials and Methods
PLANT POPULATIONS.
When a primary (F
1
) cross is made between a cold-hardy and
a cold-tender species, the expectation is for uniform, intermediate hardiness among the
progeny. Subsequent generations, such as the F
2
(derived from sib mating or
selfing the F
1
) and the backcross (BC, created by crossing the F
1
back to either parent) are expected to display more variability and segregation for CH.
We selfed a single F
1
plant, 'Ceylon' (
R. catawbiense
x
R. fortunei
),
to create an F
2
population. We also made reciprocal backcrosses:
R. fortunei
x 'Ceylon' and 'Ceylon' x
R. fortunei
; unfortunately, backcrosses involving
R.
catawbiense
as the recurrent parent were not available for this study. The reciprocal
cross was used to estimate any maternal component to CH.
Our preliminary data showed significant differences in parental LFTs: R. catawbiense had a T max of -52°C and R. fortunei -31°C. The hybrid 'Ceylon' was intermediate, leaf hardy to about -43°C. The uniformity in CH within F 1 population could not be tested due to unavailability of F 1 'Ceylon' siblings. However, a related study in our laboratory revealed little variation in cold hardiness values among 15 F 1 plants derived from R. catawbiense x R. dichroanthum cross (Arora and Lim, unpublished results). In the present study, measurements of the parents were taken from clones 30-40 years old. The F 2 and BC populations were evaluated as 3-year-old seedlings maintained in outdoor ground frames at the Leach Research Station in Madison, Ohio.
NON-ACCLIMATED AND ACCLIMATED LFTs.
Leaves from naturally cold-acclimated (CA) parents, F 1 , BC and F 2 populations were collected on the premises of the Leach Research Station in December 1996, moistened, and shipped in a cold box overnight to West Virginia University for analysis of CH. Our data from earlier studies suggest that rhododendrons are maximally acclimated to midwinter temperatures by December (Lim etal., 1998). Estimates of LFT for the non-acclimated (NA) condition were obtained from leaves collected from the same plants in July and August 1997, moistened, and shipped overnight at ambient temperatures. The difference in T max between NA and CA states is termed cold-acclimation ability, and is a measure of how strongly plants respond to environmental cues, such as decreasing photoperiod and temperature, during the acclimation period.
DETERMINATION OF LEAF-FREEZING TOLERANCE.
Leaf-freezing tolerance (LFT) in rhododendrons was determined according to a method developed by Lim etal. (1998). Basically, the method involves relatively slow freezing followed by gradual thawing of plant tissues to simulate what plants generally experience under natural conditions (Steffen etal., 1989), and then conducting a physiological assay to evaluate the induced injury.
Leaves were cut into 1 cm 2 discs and placed into test tubes containing 25-50 µl water. Following ice nucleation at -1°C (by dropping small ice crystals in the test tubes), the non-acclimated leaf discs were slowly cooled at approximately 0.5°C/30 min. to -4°C and 1°C / 30 min. to -10°C thereafter to obtain treatment temperatures ranging from -2 to -10°C (at 2°C increments). Cold-acclimated leaf discs were ice nucleated and cooled similarly to -10°C but continued at about 3.5°C/ 30 min. thereafter to obtain treatment temperatures ranging from -10 to -52°C (at 7°C increments). The sample tubes were initially cooled in a glycol bath (to -24°C) then transferred to a -80°C freezer to subject them to temperatures as low as -52°C. Tubes were removed at various temperature intervals, placed in ice for overnight thawing, and then allowed to reach room temperature gradually. A separate set of leaf discs from each plant was ice nucleated and placed directly in -80°C freezer for 4-5 h to obtain 100% freeze-killed samples.
Thawed leaf discs were placed in 6mL of dd H
2
O, vacuum infiltrated for 5-8 min.
(at about -0.15 MPa) and placed on a gyratory shaker for 3 h at 275 rpm. Cell membranes
injured by freeze-thaw leak their contents (cell sap) into the water. Because cell sap
contains ions (electrolytes), an increase in conductivity of the solution is a quantitative
measure of increased freezing injury in the leaf tissue (Dexter, 1930). After measuring
freeze-induced electrolyte leakage (C
1
) with a conductivity probe, samples
were autoclaved to disrupt all remaining intact cells and determine the total electrolyte
leakage (C
2
). Percent ion leakage due to freezing was calculated as
[(C
1
/C
2
)x 100].
Percent freeze-injury was calculated by the equation:
% Injury (t) = [{% leakage (t) - % leakage (c)} / {100 - % leakage (c)}] X 100 (Flint etal., 1967)
where % leakage(t) and % leakage (c) are the measurements of % ion leakage for a respective freeze-treatment temperature and an unfrozen control (some slight leakage is caused by cutting the leaf disc). Percent-adjusted injury was calculated by the equation:
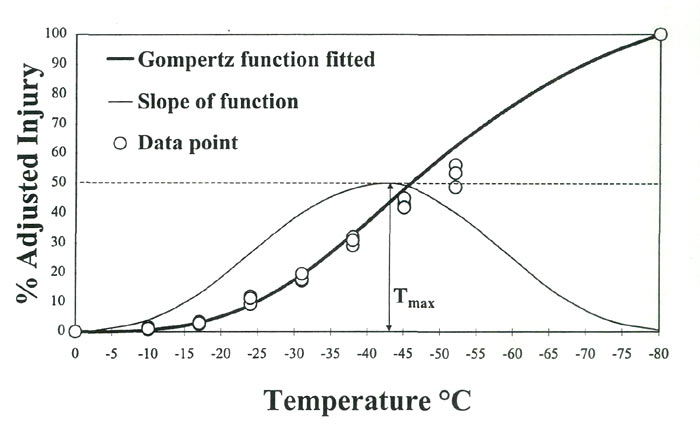
%-Adjusted injury = [% injury (t)/% injury (-80°C)] X 100Ion leakage over a range of freezing temperatures typically displays a sigmoidal response in rhododendron leaves, i.e., a slow increase in leakage during the initial cooling phase, followed by a sharp increase in freezing injury and leakage at some critical temperature, which eventually levels off. A number of statistical procedures have been used to fit this response curve to known arithmetic functions to help determine the rates of freezing injury (Lim etal., 1998). For this study, we fitted percent-injury data to a Gompertz function and used the parameter T max , defined as the temperature causing the maximum rate of injury, as an estimator of CH (Fig. 1).
|
|
Fig. 1. Percent-injury as a function of freezing temperatures in
R. 'Ceylon' leaf tissues. Data are fitted to a Gompertz function where the slope of the curve is the rate of injury. Tmax, inflection point of the slope, is the temperature causing maximum injury rate. |
Results and Discussion
THE LEAF-FREEZING TOLERANCE ASSAY.
Ion leakage assays have been widely used by researchers to evaluate CH in both herbaceous and woody plants (Lim etal., 1998; Steffen etal., 1989; Stone etal., 1993). Our adaptation of this method to rhododendrons - the determination of a diagnostic range of treatment temperatures and the statistical curve fitting of percent-injury data in order to estimate T max - is evidently reliable, correlating well (r=0.79) with visual estimates of freezing injury based on water soaking and browning (Lim etal., 1998).
Although our treatment samples (leaf discs) were comprised of pooled leaves from single plants, this protocol produced consistent T max estimates and small standard errors. Moreover, utilization of leaf discs instead of whole leaves or flower buds minimized the degree of plant damage. Much of the experimental variability commonly associated with field trials is significantly reduced by our protocols and the somewhat subjective method of estimating CH by visual assessment of leaf injury is replaced by a more quantitative measure (ion leakage). By using simple statistics (multiple t tests comparison), we are able to compare and rank individual genotypes by their Tmax values and standard errors (Lim etal., 1998).
In order to make inferences about the type of gene action involved (dominant, recessive, or additive), geneticists often measure parent-offspring resemblance. If the average progeny resembles one parent more strongly than the other, then dominant or recessive gene action is implied, depending on which parent has the greater effect on offspring. If most offspring are intermediate in character to both parents, then the type of gene action is termed "additive," referring to genes with incremental positive or negative effects on a metric trait such as CH.
| Table 1. Leaf-freezing tolerance (T max ) of 3 Rhododendron populations. | ||||||||||
| Parents | N z | T max (°C) ± SE y | ||||||||
| R. catawbiense | 1 | -51.2 ± 0.2 a | ||||||||
| R. fortunei | 1 | -32.4 ± 0.9 c | ||||||||
| R. 'Ceylon', F 1 | 1 | -43.2 ± 1.3 b | ||||||||
| Populations | ||||||||||
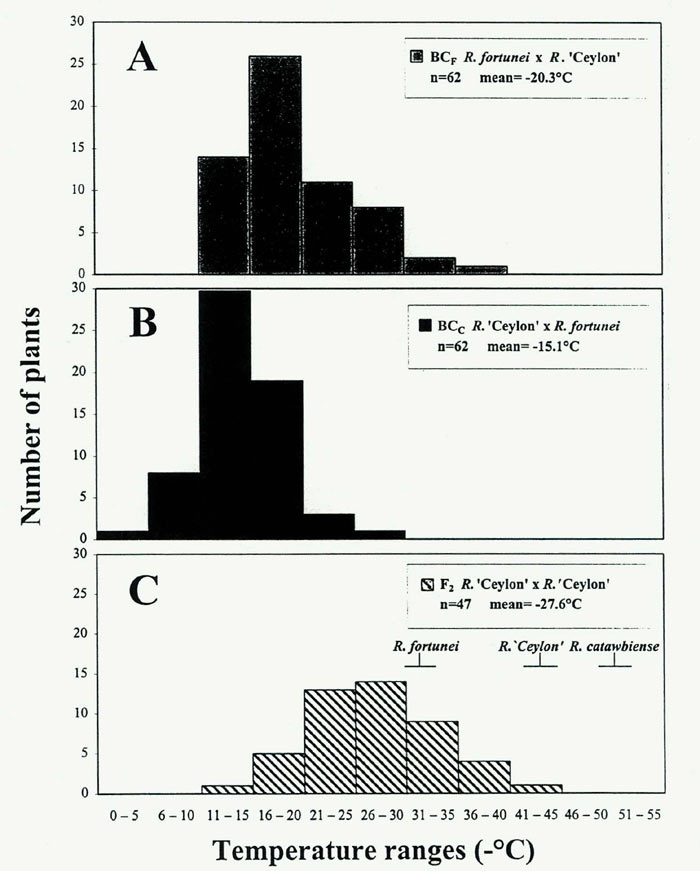
| BC F progeny, R. fortunei x R. 'Ceylon' | 62 | -20.3 ± 0.6 e | ||||||||
| BC C progeny, R. 'Ceylon' x R. fortunei | 62 | -15.1 ± 0.4 f | ||||||||
| F 2 progeny, R. 'Ceylon' selfed | 47 | -27.6 ± 0.7 d | ||||||||
|
z
N = number of plants evaluated. Three replicate discs were measured at
each treatment temperature. Parents and F
1
were included as standards in all
population screenings.
</p> y Mean separation in column by multiple t test, P = 0.05. </td> </tr> </table> A major difficulty in our work results from the determination that parent-offspring comparisons are confounded by age-dependent freezing tolerances. For example, the freeze-tolerance values for the BC and F 2 three-year-old seedling populations were substantially lower than those of their 30 to 40-year-old parents (Table 1), indicating that the majority of the progeny from a cold-hardy by cold-tender cross were more sensitive (or less hardy) than the tender parent. This is an unexpected result, and we sought to explain it by looking at the effect of physiological age on CH. To this end, we conducted a two-year study of different-aged seedlings from a wild R. maximum population and found that rhododendrons can gain about 10°C or more in freezing tolerance as they age physiologically from the pre-flowering juvenile stage (1 to ~4 years) to maturity (Lim, unpublished data). Therefore, inferences on gene action in our study are best made by comparing averages of CH values from BC and F 2 populations consisting of similar-aged juvenile plants. The average freeze-tolerance of reciprocal backcrosses ('Ceylon' crossed with R. fortunei ) were 26 and 45% lower than the F 2 values (Table 1). The percent nuclear genetic background of the F 2 is 50:50 ( fortunei: catawbiense ) whereas in both BCs it is approximately 75:25 ( fortunei: catawbiense ). A significant additive component to CH genes in these populations is inferred from the reasonably close correspondence between the 25-45% reduction in BC mean freezing tolerance and the 50% reduction in genetic contribution from the hardier R. catawbiense parent. Other types of gene action may be involved in rhododendron CH. From reports in other plant genera, it appears that additive gene effects on CH are modified by partially recessive (Arora etal., 1998; Stone etal., 1993) or dominant gene action (Teutonico etal., 1995). Maternal effects may also determine plant phenotype. A difference between the reciprocal BC populations in our study (Table 1) indicated a partial maternal effect in which the R. fortunei cytoplasm conferred greater freezing tolerance than did the R. catawbiense cytoplasm. This unexpected result may be due to complex nuclear-cytoplasmic interactions in the interspecific hybrids, or it may represent an experimental artifact (we are planning to reassess these populations for CH at least one more time while still in the juvenile condition). Conflicting reports exist in literature regarding maternal effect on CH. For example, Dorsey and Bushnell (1925) first reported a positive maternal effect on cold hardiness in Prunus , in that, using P. americana (a hardier species than P. salicina ) as a pistillate parent resulted in 80% of interspecific seedlings as hardy compared to only 45% when P. salicina was the female parent. On the other hand, Quamme (1978) detected no reciprocal differences in CH of progenies of apple cultivars with different CH levels. Similar results were obtained by Hummel etal. (1982) in the study of inheritance of photoperiodically induced cold acclimation in Cornus sericea . Another method of comparing parent-offspring performance in these populations is to predict the "mature" F 2 or BC hardiness distributions by adding an approximate "correction factor" of ~10°C (the gain in freezing tolerance from juvenility to maturity in different-aged R. maximum populations). For example, the predicted mature F 2 CH distribution would range from -25°C to -52°C, well within the temperature interval defined by the parent species. By this method, there could be at least one segregant in this population of 47 plants that recovers the hardiness level of the R. catawbiense parent (Fig 2C). Given the probability that (1/4) n F2 segregants will resemble either parent value (where n = number of gene pairs) and assuming additive gene effects, it is possible that as few as 3 genes are responsible for the phenotypic variation observed in these populations [(1/47) ~ (1/4) 3 ]. Research in other genera has suggested a similar oligogenic (few gene) control of freezing tolerance (Arora etal., 1998; Stone etal., 1993; Teutonico etal., 1995).
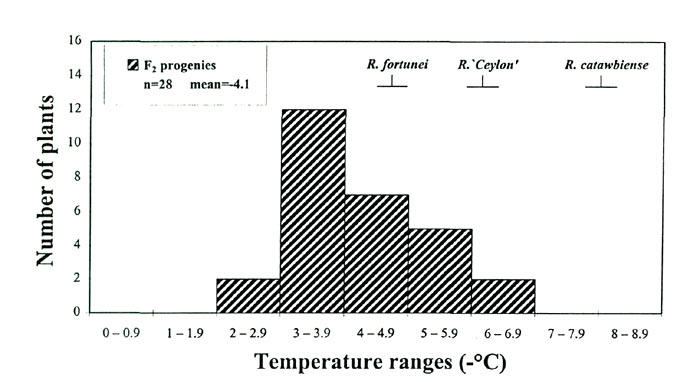
COLD-ACCLIMATION ABILITY. Midwinter cold hardiness is really the outcome of two conditions in an individual plant - its freezing tolerance in the non-acclimated state and its ability to increase that tolerance (cold-acclimation ability). The cold-acclimation process is triggered by environmental cues, such as shorter photoperiods and cooler temperatures beginning in late summer and extending into late fall (Fuchigami etal., 1971), and acclimating plants undergo physiological and structural changes that condition them to survive low temperatures during winter. The acclimating ability of a plant in our research was defined as the leaf-freezing tolerance (LFT) in the cold-acclimated (CA) condition minus the LFT in the non-acclimated (NA) condition. As expected, non-acclimated leaf-freezing tolerance (NA-LFTs) from summer-collected progenies in BC (data not shown) and F 2 populations were much lower than cold-acclimated leaf-freezing tolerance (CA-LFTs) determined for the same individuals during the previous winter (compare Fig. 2C with Fig. 3). There was, however, significant variation in NA-LFTs (-2 to -7°C in the F 2 ; Fig. 3), and we wanted to determine whether these freezing tolerance differences observed in the NA state had an impact on a plant's midwinter hardiness level.
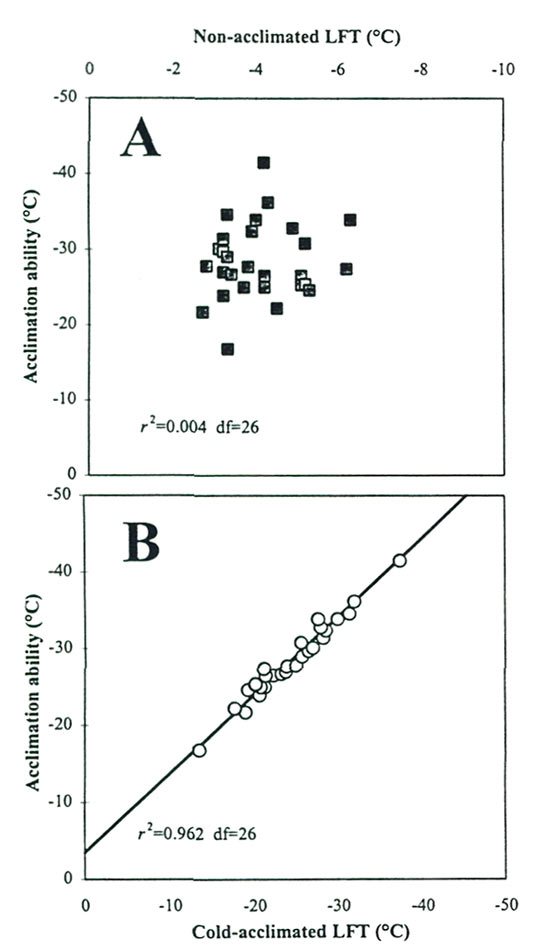
Scatterplots of these CH components indicate that NA-LFT is not correlated with cold acclimation ability (Fig 4A), whereas CA-LFT was highly correlated with acclimation ability (Fig. 4B). These results suggest that the physiological processes involved in NA hardiness and acclimation ability in rhododendrons are independent of each other, a conclusion also drawn from research on potatoes (Stone etal., 1993). The relationships also indicate that, of the two components, it is the variation in acclimating ability (-13.6 to -37.3 °C in the F 2 generation) rather than NA hardiness that accounts for the bulk of observed differences in T max in rhododendrons. This is a meaningful variation from a CH breeding perspective, and more broadly, it suggests that the oligogenic model for CH inheritance in Rhododendron involves genes with major effects on cold acclimation ability.
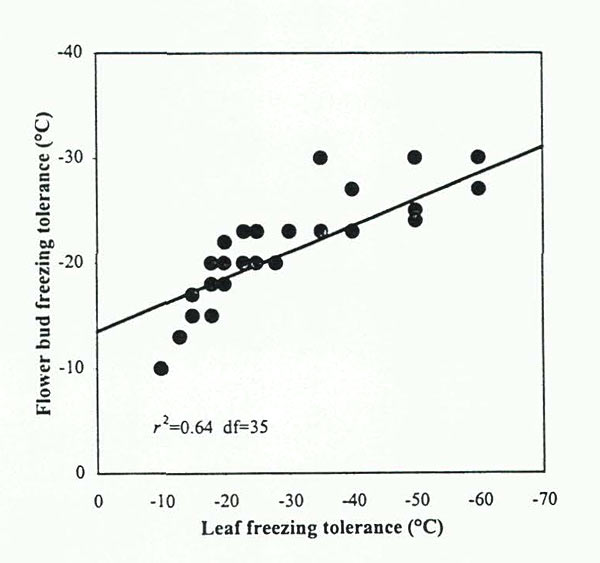
SEEDLINGS LFTs AS PREDICTORS OF FIELD PERFORMANCE. Although floral bud survival is conventionally used to describe CH in rhododendrons and certain other ornamental plants, the use of leaves for the same purpose is more desirable in research and breeding programs, because one can assess juvenile populations for CH without waiting 5+ years for flowering to occur. The applicability of this method to "real life" conditions involves two factors - 1) how well leaf CH assays predict floral bud hardiness and 2) the degree to which freezing tolerance of juvenile seedlings predicts mature plant performance. Vegetative buds and leaves of Rhododendron are generally able to withstand colder temperatures than can floral buds (Sakai eral., 1986). However, evidence suggests that estimates of CH based on leaf performance can be used as a general measure of flower bud hardiness in rhododendrons. A statistical analysis of data presented by Sakai etal. (1986), indicated that leaf and floral bud hardiness in Rhododendron species were significantly correlated (r 2 =0.64) (Fig 5). In addition, we recently reported that LFT rankings of five Rhododendron cultivars corresponded to their USDA hardiness zone rankings based on flower bud hardiness. (Lim etal., 1998).
Data from other research support the notion that the measurement of freeze-injured leaf discs in the laboratory is a valid method to estimate field performance of whole plants. For example, Teutonico etal. (1993) reported a strong correlation (r=0.82-0.85) between laboratory(ion leakage)- and field-generated estimates of CH among nine rape-seed cultivars. Similarly, controlled freeze-thaw stress of leaf discs from 35 broadleaf evergreen species ( Lagerstroemia, Malus, Pyracantha, Syringa, Viburnum, Prunus , etc.) resulted in visual laboratory estimates of cold hardiness that corresponded well with field measurements (Johnson and Hirsh, 1995). Surveys at the juvenile seedling stage will probably underestimate CH levels determined at physiological maturity (flowering). As we indicated above, juvenile plants in our experiments have displayed significantly lower T max than did mature plants. It is unknown at the present time whether relative CH rankings per se among genotypes will change with physiological and/ or chronological age. In order to test whether seedling CH accurately predicts mature plant CH, we are planning to grow our populations to maturity by establishing them in field rows, and observing how well their leaves and floral buds tolerate midwinter freezes. If cold hardiness rankings are consistent over time, then seedling hardiness screenings would be useful for breeding and selection purposes as well as for more basic investigations in which early determination of cold-hardy phenotypes is important. Conclusions We developed a reliable in vitro laboratory protocol for assessing CH in rhododendrons based on leaf-freezing tolerance (LFT). This method is relatively nondestructive, repeatable and statistically sound. Patterns of variation for CH in F 2 and BC populations suggested that a few genes with strong additive effects are controlling this trait. A major breeding application of this work was the demonstration that progeny from a relatively small F 2 population (<50) could differ by as much as 30°C in CH. The early identification of hardy phenotypes by laboratory freeze tests could allow most of the breeding population to be culled early on. However, this efficient method for selecting cold hardy segregants will work only if it could be shown (in future research) that seedling LFTs correlate with adult values. From the perspective of basic research, the prospect of a few major genes controlling CH makes genetic mapping and "tagging" of cold hardiness genes a feasible objective. Placing cold hardiness genes on a linkage map of rhododendrons could allow for "marker-assisted" selection (e.g., initially identifying hardy types by DNA profile rather than by actual freeze tests) and would facilitate the search for genes and gene products associated with tolerance to maximal low-temperature stress in this genus. Acknowledgements This research was supported, in part, by a grant from the Research Foundation of the American Rhododendron Society, West Virginia Nurserymen's Association and "in house" funds from West Virginia Agricultural & Forestry Experiment Station and Holden Arboretum. Published as West Virginia Agricultural and Forestry Experiment Station Scientific article No. 2675.
Literature Cited
Chon-Chong Lim is a doctoral student and Dr. Rajeev Arora (corresponding author) is
an Assistant Professor of Horticulture in the Division of Plant and Soil Sciences at West
Virginia University, Morgantown, WV.
| ||||||||||