JOTS v37n2 - Impact of Climate and Geographic Location on Moisture Transport in Wood Construction Walls and Implications for Selecting Vapor Retarders
Impact of Climate and Geographic Location on Moisture Transport in Wood Construction Walls and Implications for Selecting Vapor Retarders
Kennard G. Larson
Abstract
This research effort studied two similarly built homes in two different geographic locations in an attempt to demonstrate the affect that climatic conditions have on the selection and installation of appropriate vapor diffusion retarders to control moisture transport in wood-framed structures. Much misinformation and suppositions exist regarding which vapor diffusion retarder to use, where to place it within the structure, and whether it is even necessary. As a result, uncontrolled moisture transport is often a significant factor in the premature degradation of a structure; this also adds to poor indoor air quality resulting from the growth of mold and mildew. Nine climatic values of temperature, humidity, and air pressure were recorded at 20-30 minute intervals at various locations within the wall cavities and the outside of both test structures, for a 12-week period from January to March. These data allowed the researchers to perform calculations to predict the potential for growth of mold or mildew within the structure. Ultimately, these data were further compared for moisture transport behavior with the simulation software WUFI (“Wärme und Feuchtigkeit Instationären), a PC program developed by the Institute for Building Physics in Germany and the Oak Ridge National Laboratories in Tennessee for calculating coupled heat and moisture transfer in building components.
Keywords:
wood-framed house, sheathing, fiberglass insulation, moisture barriers, vapor barriers, intelligent vapor diffusion retarders, vapor diffusion retarders, moisture-thermal properties
Introduction
Moisture in buildings in the United States is considered one of the single, largest factors limiting the service life of a building ( Lstiburek, 1991 ). In addition to the obvious liquid water, or rain, that can permeate the building envelope, the infusion of water vapor is of equal or greater concern because it is not visible or readily recognized. Water vapor can be controlled by placing the proper vapor diffusion retarder at proper locations within the wall components. A vapor diffusion retarder is typically, and less accurately, referenced in most literature as a “vapor barrier.” However, a vapor retarder does not prevent all moisture from passing through as does a barrier ( U.S. DOE, 2011 ).
Problem Statement
Incorrect use of vapor diffusion retarders ranks high on the list or controversial techniques and incorrect applications in construction ( Laliberte, 2008 ). Much misinformation exists about which kind of vapor diffusion retarder to use, where it should be located, and if it is necessary. Illustrating this point, an Internet search at a do-it-yourself construction website revealed the following post: “Everything I've read says to put up a vapor barrier between the insulation and the drywall. They mention plastic sheeting, but nothing tells what (thickness) to use.” The answers varied from: “Any plastic sheeting will provide a substantial barrier. The cheaper the better,” to more accurate, scientific solutions ( Tribe, 2007 ). Not only must vapor diffusion retarders limit moisture from getting into the construction, they also must let moisture out if indeed it does permeate the construction ( Lstiburek, 2011 ). As such, the “plastic sheeting” mentioned in the blog as a solution, is not suitable in many climates. The goals of this research effort were to determine (a) the moisture transport activity in exterior walls of wood-framed construction, (b) the extent that geographical elevation above sea level affects the climatic and moisture transport behavior in similarly designed and constructed buildings, (c) if there is a preferred position/location for various types of vapor retarders (i.e., on the interior or exterior surface of the wood frame), and (d) which of the tested vapor retarder materials, if any, provides an adequate level of moisture control to inhibit the development of mold or fungus.
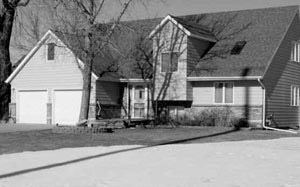
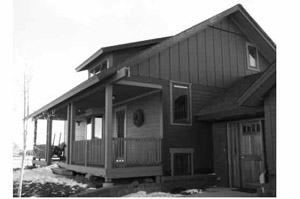
The test structures for this research were residential, single-family homes typical to the Midwest region in the United States. The Energy Efficient Building Association (EEBA) classifies this region as a “Heating Climate” region ( Lstiburek, 2011 ) and recommends different moisture control methods for specific regions. Figure 1 shows Test Structure 1, later referenced as the Kearney Project, located in Kearney, Nebraska, with latitude 40° 44' N, elevation 652 meters above sea level. Figure 2 shows Test Structure 2, later referenced as the Laramie Project, located in Laramie, Wyoming, with a latitude 41° 3' N, elevation 2193 meters above sea level. Because the EEBA does not differentiate for elevation values above sea level, it was of interest to see if elevation and the impact of atmospheric air pressure may be a factor in potential for mold growth.
Wall Construction and Material Combinations
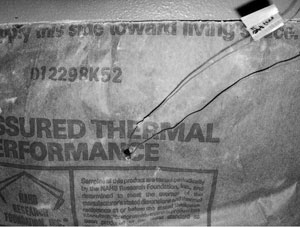
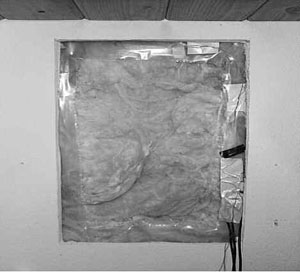
As is typical in most North American wood-frame construction ( ICC 2006 ), the material assemblies of the exterior wall frames of both structures were constructed according to Table 1. The types of construction materials that comprise the wall assemblies are listed from exterior to interior, and the thicknesses (t) of various building components is listed in millimeters. In both test structures, the walls that were tested faced north. All measurements referenced in this paper are listed in metric equivalent values. The materials used in the construction of the walls of both test structures were identical with the exception of a kraftpaper vapor retarder and hardboard siding in the Kearney project versus a nonpermeable polyethylene vapor barrier and fiber cement siding in the Laramie project. Because the influence that climate had on mold development was the variable in question, these material differences were insignificant. Figure 3 and Figure 4 illustrate the different vapor retarders at the location of the measurements.
| Layer | Kearney | Laramie | ||
|---|---|---|---|---|
| material | t [mm] | material | t [mm] | |
| Exterior paint | prepainted |
1 coat latex primer
2 coats latex topcoat |
||
| Siding |
"lapped" hardboard
"Masonite Colorlok" |
10 |
"lapped" fiber cement
"Hardiboard" |
10 |
| Wind and water retarder | "Tyvek" (58 Perm) | "Tyvek" (58 Perm) | ||
| External sheathing | OSB | 13 | OSB | 13 |
| Insulation | R-11 Fibre glass batt 135 | 89 | R-19 Fibre glass batt | 135 |
| Vapor retarder | kraftpaper | PE-foil (6 mil) | 0.15 | |
| Internal sheathing | gypsum board (drywall) 13 | 13 | gypsum board (drywall) | 13 |
| Interior paint |
1 coat latex primer
1 coat latex topcoat |
none | ||
Research Methodology
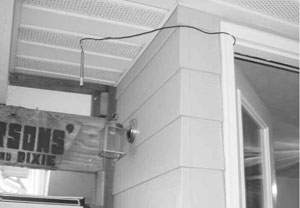
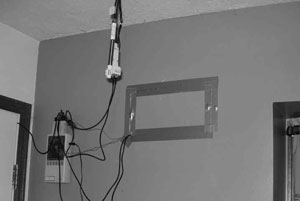
Data were collected using a “data logger” capable of capturing and storing nine measurement values every 20 to 30 seconds in the computer memory. All data were recorded in metric units, and this collection continued for at least three months at each location. Data were downloaded to a spreadsheet to generate graphic impressions of what was occurring within the walls regarding the development of moisture and the consequential potential for mold growth. Ultimately, anticipating the relative humidity (RH) on the inside surface of the oriented strand board (OSB) exterior sheathing was of interest due to the potential for mold growth at levels above 60% RH. For the Kearney project, the climatic data were collected for 12 weeks during winter 2006. For the Laramie project, the climatic data were collected for 12 weeks during fall 2004. For consistency, the measuring instruments were arranged in identical fashion in both structures, as illustrated in Figures 5 and 6. Care was taken to ensure that the same distances from reference surfaces were maintained.
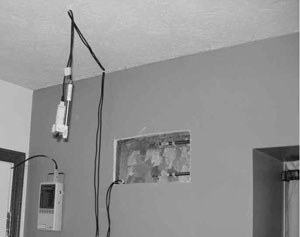
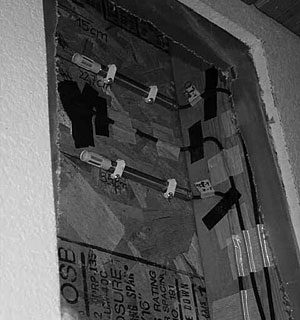
Figures 7 and 8 illustrate location details and various positions of the sensors relative to the interior cavity of the wall and exterior atmosphere of the structure. The exterior temperature/moisture sensor is visible in Figure 7, while the Ahlborn data-logger, interior temperature/moisture sensor, and air pressure sensor are visible in Figure 8.
Recording and Measuring Equipment
An Ahlborn data-logger, model 2590-9 recording instrument, allows logging of up to nine data inputs on channels 00 through 08. The data-logger was calibrated to record at 20-minute intervals for the Kearney project and 30-minute intervals for the Laramie project. The shorter interval was used to improve the accuracy of the measurements taken at Kearney in order to determine if the output graphic data might be easier to view. However, there appeared to be no significant difference. A typical display of the data-logger is observed in Figure 9. The nine channels recorded temperature, air pressure, and relative humidity at various locations on the structure.
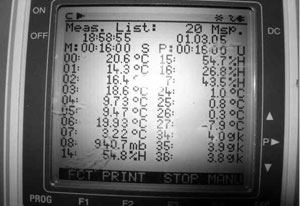
The data sensors located throughout the construction included four PT100/condensator combination sensors to measure temperature and relative humidity, four thermocouple (Coup.) bimetallic temperature sensors, and one atmospheric pressure sensor. Table 2 describes which sensors were connected to respective channels, the variable that the sensor measured, the units of measurement, and the location of the sensors. The “Figure Code” column identified in Table 2 is for the purpose of viewing the “daily mean” values, relative to their location in the structure, in Figures 10 through 13. Rows of data in Table 2 are listed beginning with interior room measurement locations, moving throughout the wall, and ultimately to the exterior of the structure. The figure code column correlates to the “Location” column to observe where the sensors were placed in the assembly. For example, the sensor “i” was located in the interior of the room and measured temperature (degrees Celsius) and relative humidity (percentage) on channel M04 with a PT100 condensator instrument. In contrast, sensor “i/e 0, 05” was in the insulation but closer to the interior wall surface and only measured temperature (degrees Celsius) with a thermocouple on channel M02.
| Figure Code | Measure Channel | Sensor Type | Measured Values | Units | Location | |
|---|---|---|---|---|---|---|
| Temp | RH | |||||
| i | M04 | PT 100 | Cond. | temperature and rel. humidity | °C % | air interior |
| i1 | M00 | Coup. | temperature | °C | air interior | |
| i/e 0,0 | M01 | Coup. | temperature | °C | inner surface of drywall | |
| i/e 0,5 | M02 | Coup. | temperature | °C | in insulation at 60 / 80 % away from ext. sheathing | |
| i/e 0,8 | M03 | Coup. | temperature | °C | in insulation 40 / 50 % away from ext. sheathing | |
| i/e 1,0/150 | M05 | PT 100 | Cond. | temperature and rel. humidity | °C % | inside of the ext. sheathing and 150mm from ceiling |
| i/e 1,0/ 350 | M06 | PT 100 | Cond. | temperature and rel. humidity | °C % | inside of the ext. sheathing and 350mm from ceiling |
| e | M07 | PT 100 | Cond. | temperature and rel. humidity | °C % | air exterior |
| pA | M08 | air pressure | haPa | interior of room | ||
Measurement Results
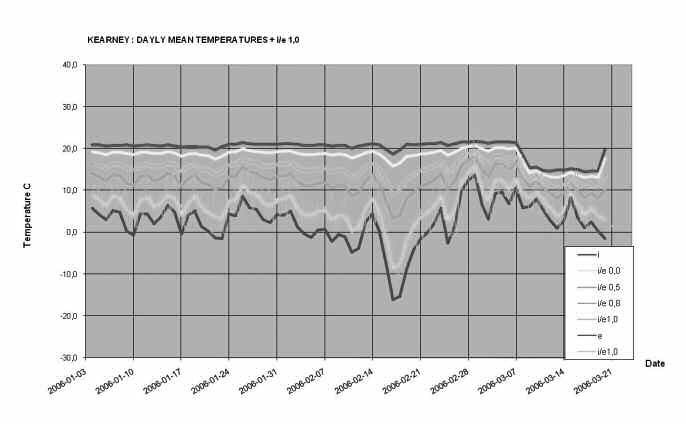
After the data were collected, they were downloaded from the logger to a spreadsheet to generate the following figures. Figure 10 illustrates the daily temperatures for the Kearney project. The red line is the room interior temperature; subsequent colors measured temperature at increasingly further distances from the interior, progressing to the blue line, which represents the exterior temperature. The interior room temperature remained relatively constant with the exception of an extremely cold period beginning on Feb. 17, shown by the dark blue line. In contrast, the drop in interior room temperature beginning on March 7, shown by the red line, is attributed to the owner setting back the thermostat 7 degrees C (12 degrees F) during a two-week spring break.
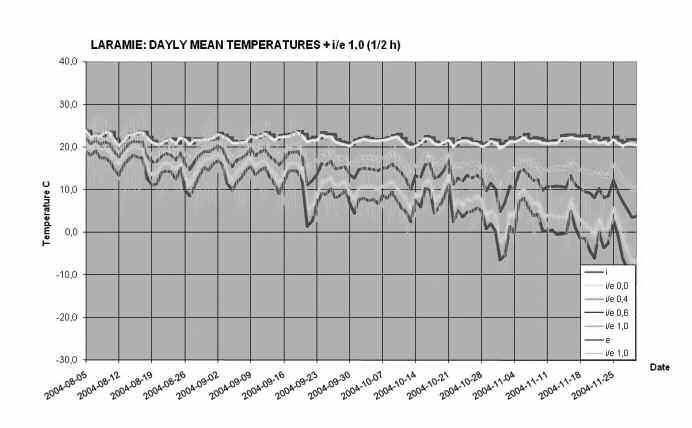
Figure 11 shows similar results with the exception of a somewhat higher and more variable indoor temperature. Possible explanations include perhaps the occasional use of an auxiliary heating device, such as a space heater or fireplace—they could also be the result of solar heat gain on sunny days.
The critical consideration for mold potential is located at the interior surface of the OSB sheathing. Figure 12 graphs relative humidity (RH) levels at three locations: interior of room (red line), the interior surface of the OSB exterior sheathing (light blue line), and the exterior (dark blue line). In addition, atmospheric pressure (magenta line) was recorded in the interior of the room because of its influence on RH. Although the extremes in outdoor RH (dark blue) in the exterior atmosphere were great as noted by the wide range of readings, the RH within the wall construction (light blue), specifically on the inside surface of the OSB sheathing, was generally between 50% and 60%. At this low level of RH, no condensation would be expected, and therefore the development of mold would not be expected. A further observation is the relatively low RH within the living space of the room. It is likely that the lack of air tightness of the structure would explain this phenomenon by which moisture would escape via the high air exchange rate of the structure. Hagentoft (1996) concluded similar results regarding air leakage carrying moist air into the construction that leads to unacceptably high values even for moderate indoor moisture levels.
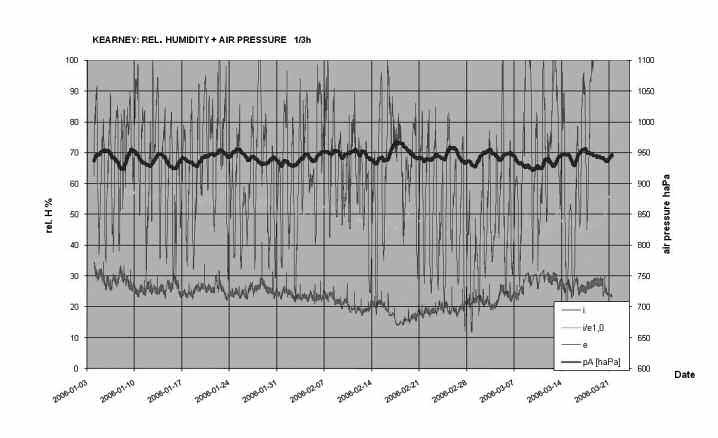
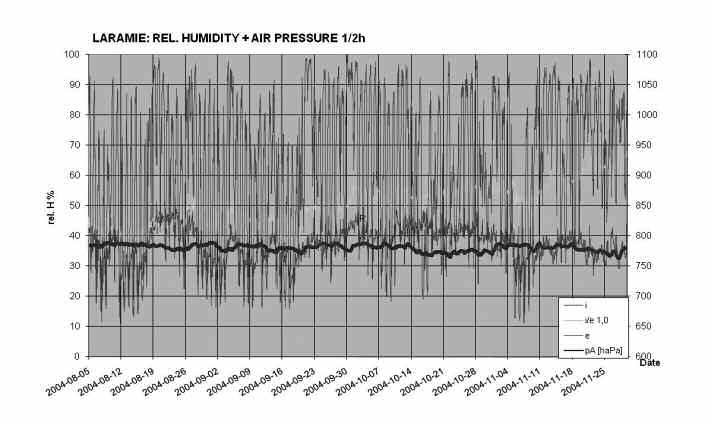
Figure 13 demonstrates that low RH rates in the Laramie project at the interior surface of the OSB sheathing are attributed to the low air pressure (magenta line, ave. 750 haPa) at the relatively high elevation of 2193 meters above sea level. The low atmospheric pressure would lead to a high evaporation rate resulting in the low RH levels. Of special note is the increase of the RH from 40% in fall to 70 % at the beginning of winter. This would explain the appropriateness of using the nonpermeable PE vapor retarder at the much higher elevation without a concern for trapping moisture.
Simulation Models with WUFI
In an effort to determine if similar results could be attained through computer simulation, the researcher utilized the PC program WUFI (“Wärme und Feuchtigkeit Instationären Übertragung,” loosely translated “Unsteady Heat and Moisture Transfer”). The program allows the selection of different types of vapor retarder materials, the location/position of the vapor retarder within the construction, warm or cold climate conditions, and geographic conditions including longitude, latitude, and elevation. The advantage of using such simulation is that it eliminates the need to physically install sensors within wall cavities, thus reducing corresponding damage to the wall surfaces. Simulation also allowed the researcher to conduct a full one-year calculation in a matter of minutes.
Tests were conducted using common types of vapor retarder scenarios, including no vapor retarder, kraftpaper, polyethylene film (PE), and “intelligent” film (PA) on the inside surface of the insulation. Tests were also done to determine if exterior air barriers, such as “Tyvek” or kraftpaper, would influence the results. Intelligent vapor retarders are made of polyacetate or nylon and have a variable permeability rate that allows moisture to pass through the film depending on temperature and moisture conditions. PA allows the material to keep most moisture vapor out, but it also allows moisture vapor to dry out if a high level does infiltrate the wall cavity. As would be expected in standard construction, the vapor retarders that were tested were located directly under the interior gypsum board and on the interior surface of the OSB sheathing. A cold Test Reference Year (TRY) was calculated for Laramie, but for Kearney both a cold TRY and a warm TRY were calculated because of the higher humidity and the concern for potential mold development in summer. A TRY represents a time period beginning January 1 and concluding December 31.
Though TRY climatic data for either Kearney or Laramie does not exist in the WUFI (North American version), climate data were available in the WUFI for Omaha, Nebraska, and Casper, Wyoming, respectively. These available climate data were deemed adequate because Omaha and Casper represent a more severe climate for potential mold growth than either Kearney or Laramie, respectively. The preferred indoor climate was designed at a temperature 20°C and a relative humidity of 30% and 50%.
Three typical examples of the 24 simulations are presented in Figures 14 through 16. These sample simulation graphs were selected because they represent the exact construction materials of the Kearney and Laramie projects assuming a cold climate, with the additional simulation for Kearney in a warm climate. Two monitor positions (measuring points) were installed to record the temperature and the relative humidity at the exterior (position 3: red) and interior (position 4: blue) sides of the insulation. In Figures 14 through16, the Y-axis represents the temperature C and RH% (Feuchte), while the X-axis represents time (Zeit) over one TRY or 1-365 days. In Figure 14, the crucial summer months from day 125 to day 250 show the RH values well below 50%, thus showing no risk of mold growth in Kearney. For a very short period beginning on day 92, the RH may increase up to 100% at the inside of the OSB, but this risk is minimal because the Kraftpaper is relatively vapor open.
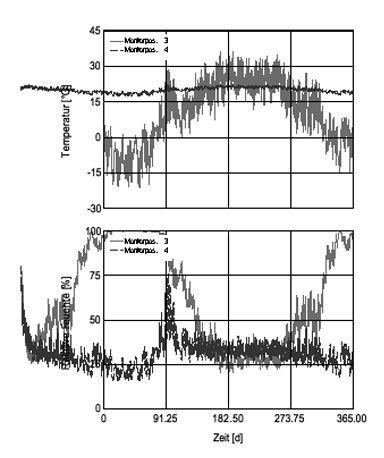
The simulation allowed the substitution of PE for kraftpaper in the Kearney project to see the how the results might vary. Thus, Figure 15 shows that even though PE foil would be an adequate vapor retarder in the winter (days 1-90 and days 275-365), during the summer the the PE foil would allow a higher RH of 50%-85% on both sides of the insulation, which would be a minor concern for mold damage. Therefore, kraftpaper is the recommended vapor diffusion retarder for the Kearney climate. It is relatively inexpensive and provides adequate potection without any risk of mold.

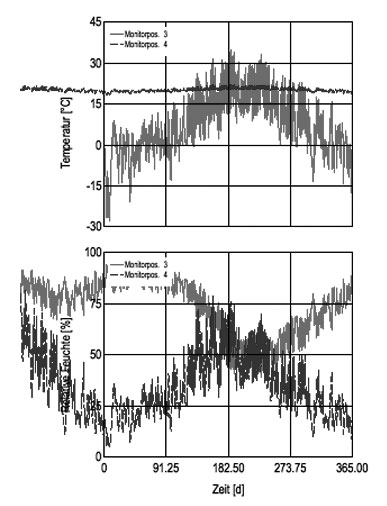
Figure 16 shows that PE foil is an acceptable vapor diffusion retarder for the Laramie climate, which has RH values below 50% in the winter. Though in the summer the interior RH values can be above 50%, the high elevation and the associated low atmospheric pressure promotes rapid evaporation/drying and thus there is little concern for mold. This appears to be compatible with Lstiburek’s recommendations (1991) for a maximum 35% indoor RH at 70 degrees F (20 C) during heating periods and when using PE foil as a vapor retarder.
The results of the WUFI simulations studies are shown in Table 3. It represents the results of the 24 simulations adjusted for the variables selected for the study. Data in the table are indicative of water per square meter (units in kilograms) (kg/m2) that could be expected on the interior surface of the OSB sheathing, depending on the type of vapor retarder. An assumption is made that values of less than 1 kg/m2 would be of little concern regarding mold development or condensed water. Values with an underscore are greater than 1kg/m2 ; they indicate that a particular vapor retarder would not be acceptable. Values in bold indicate the maximum result recorded for that test. Table 3 also illustrates that either in Laramie or Casper, there is little chance for mold to develop, regardless of the type of vapor retarder or whether a vapor retarder is even used. In contrast, it is apparent that while the type of vapor retarder used either in the Kearney or Omaha climate is of little consequence, not using a vapor retarder would be a genuine risk for mold. Regardless of the location of the vapor retarder or whether the climate data used was cold or warm, when using some type of vapor retarder, values were well within the acceptable limit of 1 kg/m2. Similarly, Levin and Gudmundsson (1999) concluded that when moisture loads are low, perhaps a vapor retarder is not necessary. However, indoor moisture conditions that exceed 2 kg/m3 will cause condensation on the inside of the external sheathing and high relative humidity in the insulation. This poses a significant potential for mold growth, structural damage, or both resulting from the degradation of the materials. Elevations above sea level are indicated in meters for all four cities. The data suggests that if an exterior air and moisture barrier, such as Tyvek or kraftpaper, was not used, then perhaps a vapor diffuser would not be necessary, explaining why many older homes without exterior air barriers do not have mold problems. Yet it is important to note that the advantage of exterior air and moisture barriers in reducing energy costs and preventing the exterior sheathing from becoming wet cannot be ignored.
| Mineral Wool Insulation | Values | Omaha | Kearney | Insulation | Casper | Laramie | Insulation | |||
|---|---|---|---|---|---|---|---|---|---|---|
|
Water
content |
298 m El. | 652 m El. | 8,9 mm | 1612 m El. | 2293 m El. | 12,5 mm | ||||
| [kg/m_] | maximum |
start
calc.: |
0.16 | 0.24 | ||||||
| Test Reference Year |
interior
Vapor Retarder |
none | kraft p. | PE | PA | none | kraft p. | PE | PA | |
| warm |
exterior
Air Bar. |
none | 0.18 | 0.17 | 0.04 | 0.05 | 0.62 | 0.5 | 0.06 | 0.06 |
| (Tyvek) | 1.63 | 0.96 | 0.16 | 0.16 | 0.79 | 0.6 | 0.24 | 0.24 | ||
| cold |
exterior
Air Bar. |
none | 0.19 | 0.17 | 0.04 | 0.03 | 0.53 | 0.43 | 0.05 | 0.06 |
| (Tyvek) | 1.96 | 0.96 | 0.16 | 0.16 | 1.1 | 0.78 | 0.24 | 0.24 | ||
| none | 0.19 | 0.17 | 0.04 | 0.05 | 0.53 | 0.43 | 0.05 | 0.06 | ||
| kraftp. | 1.96 | 0.97 | 0.16 | 0.16 | 1.1 | 0.78 | 0.24 | 0.24 | ||
Conclusions
The issue of mold growth and the consequential negative effect it has on structural damage to homes (e.g., wood members) as well as the impact mold can have on indoor air quality has become an increasing concern to builders and homeowners alike. This research concludes that the selection of proper vapor retarders to minimize the extent of damage is dependent on geographic location, elevation, and the choice of appropriate vapor retarders. It appears that the risk of mold is minimal at high elevations (such as Laramie) because of the rapid evaporation of moisture as a result of low atmospheric air pressure. It is apparent that a kraftpaper vapor retarder is adequate to control condensation within the walls of structures in geographic locations similar to Kearney; this can be accomplished with a minimal financial investment. In contrast, not to include a vapor retarder would pose a significant potential for mold growth in the Kearney climate. In any case, a vapor retarder at the inside surface of the insulation using foils that are open to vapor diffusion (e.g., kraftpaper or PA) is recommended. To conclude, during the winter, the temperatures in the Midwest United States are similar to those in Scandinavia. In contrast, during the summer, the United States has a tropical climate, very much unlike Scandinavia. Thus, the question of the location of the vapor retarder could not be directly correlated to previous studies from Scandinavia, some of which are cited in this article.
Dr. Kennard G. Larson is a Professor in the Department of Industrial Technology at the University of Nebraska, Kearney. He is a Member-at-large of Epsilon Pi Tau and received his Distinguished Service Award in 2005.
References
Ahlborn. (2003), Version 5-Handbuch: Mess- und Regelungstechnik GmbH (4th ed.). Holzkirchen, Germany:
Hagentoft, C.-E. (1996). Moisture conditions in a north facing wall with cellulose loose fill insulation: Constructions with and without vapor retarder and air leakage. Journal of Thermal Envelope and Building Science, 19, 228-243
International Code Council (ICC) (2006). International residential code for one- and two-family dwellings.
Levin, P., & Gudmundsson, K. (1999-2000). Moisture in constructions with loose-fill insulation and no vapour barrier. Nordic Journal of Building Physics, 2.
Laliberte, M. (2008). Retrieved from http://www.ecohomemagazine.com/building-science/understanding-vapor-barriers.aspx
Lstiburek, J. (1991). Moisture control handbook: New, low-rise residential construction. Washington, DC: U.S. Department of Commerce.
Lstiburek, J. (2011). Understanding vapor barriers. Building Science Digest, 106.
Tribe (2007). Retrieved from http://do-it-yourself.tribe.net/thread/0d6bf92e-6bd6-4622-b8e1-bb17c1d0e9c2
U.S. Department of Energy (DOE) (2011). Retrieved from http://www.energysavers.gov/your_home/insulation_airsealing/index.cfm/mytopic=11910
WUFI (Version 4.0) (2005). [Computer software]. Used for calculation of transient heat and moisture transport.Holzkirchen, Germany: Fraunhofer Institut fuür Bauphysik.
Acknowledgment of Additional Contributors
Note: This article is based in part on a peer reviewed oral presentation given at the Nordic Building Symposium in Copenhagen, Denmark.
Technical Assistance on Data Interpretation and Collection
Dr. Georg-Wilhelm Mainka
Universität Rostock, Germany
Data Collection in Wyoming
Dr. Katrin Riesner
R & M Shiptechnologies GmbH, Rostock, Germany
Provider of Test Structure in Wyoming
Dr. Robert Erikson
University of Wyoming, Laramie, USA