JOTS v39n2 - It's a 'Clicker,' not a Magic Wand: The Effect of a Classroom Response System on Attendance
By Raoul Amstelveen
Abstract
This study employed a rank-based nonparametric test to examine the effectiveness of a Classroom Response System (also known as a "clicker") on attendance. A Mann-Whitney U test revealed that attendance in the clicker class (experimental group) and attendance in the nonclicker class (control group) did not differ significantly. However, a survey of 28 participants in the clicker class showed that learners had positive perceptions of clickers. Two focused group sessions in the clicker class also revealed that learners enjoyed using clickers and that they found the clicker technology engaging, interactive, and entertaining.
Key words: Attendance; Nonattendance; Engagement; Classroom Response System (CRS); Clicker; Introductory Statistics
Introduction
Nonattendance in higher education is not only a local or national problem-it is also a universal problem ( Barlow & Fleischer, 2011; Cleary-Holdforth, 2007 ). Nonattendance is such a complex and pesky issue in higher education that researchers do not agree on the depth or scope of the problem. Some researchers argue that student nonattendance is getting worse and is now trending upward ( Massingham & Herrington, 2006 ), whereas others maintain that it has always been a problem ( Rodgers, 2002 ). At the very least, nonattendance has been a major issue in higher education for the last four decades ( Romer, 1993 ). Even though Romer's findings regarding nonattendance have sparked renewed debate about why students do not attend, to date there have not been any unified conceptual models or attempts to provide generalized theory concerning nonattendance among learners in higher education. This lack of generalized theory makes it more difficult to analyze nonattendance among students in higher education. Also troublesome is that introductory statistics can be an arduous and unpleasant subject for many nonscience majors ( Bradley, 2009 ). When students reluctantly attend, they often appear unmotivated, disengaged, and disinterested in the lectures.
Literature Review
The quality of lectures has been documented as playing an integral role in attendance rates. Not missing lectures could be explained with reference to (a) the enthusiasm of the lecturer, (b) a sufficient level of activity and participation in the course, and (c) a clearly structured classroom ( Revell &Wainwright, 2009 ). For instance, Hunter and Tetley (1999) concluded that students want lectures that are interesting, informative, and difficult to make up. In their study, students who were surveyed cited that the number one reason for not missing lectures was an expectation that the lectures would be interesting. The instructor's personality also appears to have a dramatic effect on whether or not students attended a lecture ( Massingham &Herrington, 2006 ; Revell &Wainwright, 2009 ; van Schalkwyk, Menkveld, &Ruiters, 2010 ). According to Massingham and Herrington (2006) , instructors who are charismatic, humorous, likeable, and energized are more likely to motivate students to attend lectures. Furthermore, teachers who develop meaningful lessons ( Dolnicar, 2005 ) and focus on themes, concepts, and principles appear to make it more worthwhile for students to attend ( Fitzpatrick, Cronin, &Byrne, 2011 ). Fitzpatrick et al. concluded that the main reason students attend lectures is because of quality teaching that actively engages learners in critical topics. Therefore, students will attend as long as they perceive "value" in attending, and one way to exude value is for teachers to be competent in their instruction ( Massingham &Herrington, 2006 , p. 84).
Efforts to increase active learning have made Classroom Response Systems (CRS)-also known as "clickers"-popular tools in higher education. Clickers are hand-held electronic devices similar to TV remote controls or mobile cellular phones that allow students to transmit their responses onto a screen where they can be automatically tabulated and summarized by software. The overall class results may then be stored, tallied, graded, and formalized into a bar graph or pie chart for the entire class. Clickers are being increasingly used, and they appear to be the gateway for newer response systems and technologies that utilize mobile devices in higher education. For instance, the company iClicker boasts that its technology is used by more than 1,300 higher education institutions ( www.iclicker.com ).
In a literature review of 67 studies, Kay and LeSage (2009) supported the claim that attendance does improve in clicker classes, especially when clickers are attached to the final grade. According to Dunham (2009) , even using motivational incentives as small as an extra two percent toward a student's final grade encourages attendance among clicker users in introductory statistics courses at the University of British Columbia. Therefore, when clickers are connected with points toward the final grade, class attendance increases ( Dunham, 2009 ; Kay &LeSage, 2009 ). However, instead of conducting headcounts of the total number of students in class, the majority of research studies that have investigated nonattendance in higher education have been correlational in nature. Moreover, most studies rely on students' perceptions and therefore employ survey techniques (e.g., Gok, 2011 ; Gupta, 2010 ; Prather & Brissenden, 2009 ).
It is also important to note that reviews of the connection between clickers and improved attendance do not always produce positive results. For instance, Laxman (2011) conducted a survey in 12 engineering courses consisting of 640 students and found that about 49% of participants claimed that clickers did not motivate them to attend. Other researchers reported no significant changes in attendance as a result of using clickers ( King &Robinson, 2009 ). Some researchers even argued that clickers actually may be detrimental when used to monitor attendance, because students disliked losing marks for missing classes ( Milner-Bolotin, Antimirova, &Petrov, 2010 ).
Theoretical Framework
The theoretical framework upon which this particular study is based is the worker attendance model. According to Steers and Rhodes (1978) , the conceptual attendance model (also known as the pain-avoidance model) posits that attendance is influenced by subjects' motivation to attend and by their ability to attend. Furthermore, motivation to attend is partly dependent on how satisfied the workers are with their job situation, as well as other pressures to attend. This is analogous to the learners' level of satisfaction with their course and the decision to attend or nor not attend ( Clark, Gill, Walker, &Whittle, 2011 ). Allen's (1981) labor-leisure model represents another example in which workers weigh the outcome of labor (attending) versus leisure (not attending). The perceived outcome that outweighs the other will win. This study intends to establish a link between absence theories regarding workers and nonattendance theories for students in higher education.
Hypothesis
This study made the following hypothesis:
H0: There is no difference in the mean ranks (median) attendance rates among learners in introductory statistics classes who use clickers and learners in introductory statistics classes who do not use clickers.
H1: There is a difference in the mean ranks (median) attendance rates among learners in introductory statistics classes who use clickers and learners in introductory statistics classes who do not use clickers.
Therefore, the purpose of this study was to install a KIP integrated system for the electronic marquee at the gate of one case study school. The EZ-RE electricity meter, Zigbee USB Dongle, and the electricity monitoring software EZ-HD were employed to assess whether the KIP integrated system indeed has energy-savings potential when applied to an electronic marquee.
Methodology
This study employed a nonprobability sampling technique to select two introductory sections taught by the author during the 2012-2013 winter academic term.
iClicker
There are many brands of clicker response systems, such as TurningPoint, iClicker, Hyper-Interactive Teaching Technology, Qwizdom, InterWrite PRS, eInstruction, and Option Technology Interactive. Mobile devices (such as smart phones) are becoming increasingly popular and may become the latest trend in higher education. However, the author chose the iClicker 6.1 version because of its portability, ease of use, and relatively low cost for students. More important, the university at which the study was conducted supports iClickers and has class sets available for instructors who wish to implement CRS into their courses. Therefore, participants in this study did not need to purchase clickers because a class set was available.
Participants
The study was conducted in a small-sized, private, undergraduate university located in South Florida. The sample consisted of 68 learners enrolled in two introductory statistics sections taught by the author during the 2012-2013 winter academic term. Of the 68 participants, 33 learners used clickers (treatment group) and 35 learners did not use clickers (control group). The nonclicker section met on Tuesdays and Thursdays, whereas the clicker class met on Mondays and Wednesdays. Both sections met in the early afternoon. The Monday-Wednesday class was chosen as the treatment group because nonattendance had been higher on those days. Moreover, by choosing the Monday-Wednesday class as the treatment group, the effectiveness that clickers had on attendance could be determined based on statistically significant results ( Wood, Burke, Da Silva, &Menz, 2007 ). The clicker and nonclicker classes were similar in terms of gender, age, class standing, and GPA (see Table 1).
| Variable | Frequency | Percent | |||
|---|---|---|---|---|---|
| Clicker | Nonclicker | Clicker | Nonclicker | ||
| Age | 18-19 | 9 | 11 | 27.3 | 32.4 |
| 20-21 | 12 | 17 | 36.4 | 50.0 | |
| 22 and older | 12 | 6 | 36.4 | 17.6 | |
| Total | 33 | 34 | |||
| Gender | Female | 16 | 19 | 48.5 | 54.3 |
| Male | 17 | 16 | 51.5 | 45.7 | |
| Total | 33 | 35 | |||
| Class Standing | Freshman | 1 | 0 | 3.0 | 0.0 |
| Sophomore | 9 | 15 | 27.3 | 42.9 | |
| Junior | 11 | 13 | 33.3 | 37.1 | |
| Senior | 12 | 7 | 36.4 | 20.0 | |
| Total | 33 | 35 | |||
| Ethnicity | African-American | 7 | 13 | 21.2 | 37.1 |
| Hispanic | 9 | 15 | 27.3 | 42.9 | |
| White Non-Hispanic | 13 | 6 | 39.4 | 17.1 | |
| Other | 4 | 1 | 12.1 | 2.9 | |
| Total | 33 | 35 | |||
| Grade Point Average | 0.00-2.99 | 8 | 13 | 25.8 | 43.3 |
| 3.00-4.00 | 23 | 17 | 74.2 | 56.7 | |
| Total | 33 | 35 | |||
Procedure
Learners in the clicker class used clickers during every scheduled meeting except the first meeting, during examinations, and during the last two lecture meetings. Meanwhile, learners in the nonclicker class did not use clickers at any point during the term. Participation in the nonclicker class was based on the percentage of classes that learners attended. In the clicker class, participation was determined based on the number of clicker points. To eliminate anxiety about clicker scores, learners were allowed to earn one point for correct clicker responses and one-half a point for incorrect responses. Participation in the clicker and nonclicker class course counted 5% toward a student's final grade. A clicker participation grade of 5% was deemed reasonable (e.g., Fitzpatrick et al., 2011 ; Milner-Bolotin et al., 2010 ), because this percentage was not so weighty as to impose anxiety about statistics or clicker questions yet it was sufficiently high that students would be likely to take clicker questions seriously. It was also theorized that this strategy would reduce the likelihood of students attending solely for the purpose of earning clicker participation points.
iClicker questions were always predesigned and used in conjunction with a PowerPoint slide. Clicker questions were usually asked toward the end of the lecture, except when students appeared to be tired, bored, or weary from the lecture. At those times, clicker questions were used during the middle of the session. Clicker questions in the middle of the lecture provided a nice change of pace, and they provided students with a break from standard lecture formats. When clicker questions were used in the beginning of the lecture, students who arrived late often lost clicker points. During the focus group sessions, participants mentioned that they were frustrated by clicker questions that were asked at the beginning of the period; they preferred the clicker questions to be asked at the end (or at least at the beginning and the end) of the lecture. During clicker questions, students spoke freely among themselves, clarifying, confirming, and analyzing clicker questions. They sometimes blurted out the answers without giving other students an opportunity to try it out for themselves. However, such actions were allowed because they indicated that students were engaged in the lesson. Each time clicker questions were asked, there was a visible increase in "noise" and enthusiasm, which was encouraged because it seemed that students were learning both individually and cooperatively.
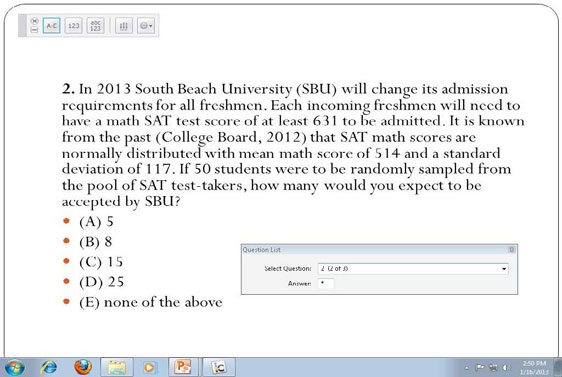
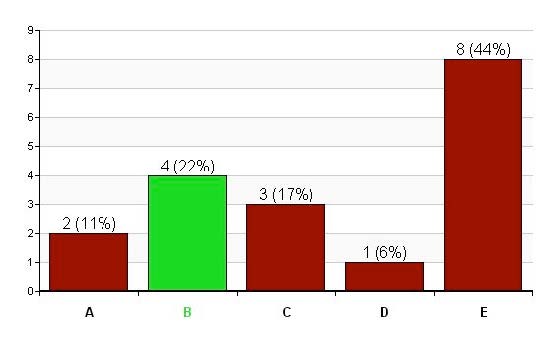
Clicker questions posed in the clicker class were taken from the current textbook used in the institution, from other textbooks, or from other researchers. For example, Figure 1 illustrates a modified clicker question from Murphy, McKnight, Richman, and Terry (2008) with values changed and the name of the university changed. In this example, only 22% of the students answered the question correctly (Figure 2), which provided the perfect opportunity to clarify some misunderstandings regarding the Empirical rule and the standard normal distribution. These results also illustrate the benefits of clickers, since the results are anonymous. This enables teachers to instantly gauge whether or not students understand a particular concept.
Results
Attendance versus Nonattendance
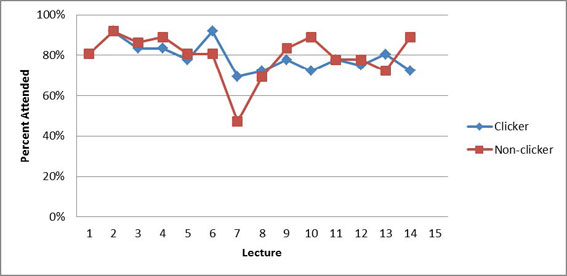
Attendance in both classes was taken using headcounts. Student who arrived late were counted as present. To double-check attendance in the clicker class, participation data records from iClickers were utilized. Figure 3 illustrates the attendance rates and trends based on headcounts conducted in both the clicker and nonclicker classes.
The 7th lecture was conducted on the last day of lectures prior to the Christmas holiday, and many students chose not to attend. Focus group participants provided reasons for not attending. Further, clickers were not used during the last two lecture meetings because students needed to work on their class projects. Each term, individual class projects are assigned, and they are worth 20% of each student's final grade. Based on Figure 3, attendance rates between the clicker and nonclicker classes appeared similar. Because participants were not randomly assigned to the clicker and nonclicker classes, a Mann-Whitney U test was run to determine if there were differences in attendance rates between the two groups. The median attendance rate for the clicker class (78%) and nonclicker class (82%) was not statistically significantly different, U = 107.5, p = .43, using an exact sampling distribution for U ( Dineen &Blakesley, 1973 ).
To analyze how students perceived the clicker technology, 28 out of 33 students in the clicker class volunteered to complete a survey centered on a "clicker efficacy" scale developed by Haeusler and Lozanovski (2010) . Each item on the "clicker efficacy" scale used a five-point Likert scale where 1 = strongly disagree, 2 = disagree, 3 = neutral, 4 = agree, and 5 = strongly agree (see Table 2). The instrument has an inter-item reliability of .89 and has been shown to be reliable based on the survey results given to science students ( Haeusler &Lozanovski, 2010 ). On average, participants had positive perceptions about using clickers (M = 3.77, SD = .70), and the majority of students perceived clickers to be a useful tool for introductory statistics. On average, learners also felt that clickers increased levels of engagement and made the class interesting. The question with the highest rated score was the reverse coded question: "Using the clickers was a waste of time." Thus, students indicated that they found the clicker technology to be a worthwhile addition in the course. Interestingly, 71% of the participants did not feel that clickers assisted their learning. This may be partly explained by the fact that the clicker questions did not align very well with examination questions; also, the participants' dissatisfaction with conducting the clicker questions at the beginning of the lecture may also have played a role.
| Question | % Agree | % Neutral | % Disagree | Mean ∓ SD |
|---|---|---|---|---|
| Node. ¥ denotes reverse coded item. | ||||
| 1. Using the clickers showed me where I stood in relation to the rest of the class. | 54% | 39% | 7% | 3.71 ∓ .94 |
| 2. Using the clickers helped me identify areas of strength and weakness in content knowledge. | 78% | 18% | 4% | 3.82 ∓ .91 |
| 3. Using the clickers made the classes interesting and engaging. | 64% | 22% | 14% | 3.61 ∓ 1.10 |
| 4. Using the clickers prompted discussions. | 64% | 25% | 11% | 3.71 ∓ 1.01 |
| 5. Using the clickers was a waste of time. ¥ | 14% | 11% | 75% | 4.07 ∓ 1.09 |
| 6. Using the clickers assisted my understanding of the concepts that were discussed. | 21% | 43% | 36% | 3.75 ∓ .80 |
| Using the clickers did not assist my learning. ¥ | 71% | 22% | 7% | 3.86 ∓ .97 |
Focus Group Results
Two focus group sessions also were conducted in the clicker class in order to analyze students' perception of clickers and their reasons for attending and not attending classes. The sessions consisted of 10 men and 10 women, and member checking was conducted after the group sessions to ensure the accuracy of the transcribed report. From the focus group sessions, five major themes emerged as factors that influence the likelihood of attendance: (a) medical emergencies and illnesses, (b) work, (c) college tuition costs/financial obligations, (d) time and day of the class, and (e) instructor/ facilitator.
Although reasons such as medical emergencies and illness are out of the hands of the instructor and have been documented in other research studies (e.g., van Schalkwyk et al., 2010 ), these same themes were again reported in the focus groups. For example, one participant stated, "The only time that I actually missed class was when I was sick or I really couldn't make it to class." Another participant reported similar reasons: "I was either sick or I just didn't wake up for class." The scheduled time of the class also seemed to influence attendance. Early morning classes, especially on Mondays, tend to be attended at a lower rate. One participant compared morning classes with the clicker class, revealing a tendency to miss morning classes but not classes in the middle of the day: "I'm usually awake by this time. For an 8:00 a.m. class, sometimes I just don't wake up." Some students try to attend even when they are sick. For example, one participant stated: "I would never miss a class, even if I was sick. Yes, I try not to. I don't want to get too far behind."
However, competing commitments and financial obligations can make it difficult for many students to attend. Often, students must choose between attending class and going to work. One participant stated the following:
Most of the times like me it's two jobs and sometimes my second job wants me to come on certain days, usually in time frames where this class is going on. So do I need rent money, or do I need to come to class? Rent is naturally the first priority so that you can have a roof over your head, so that's why I sometimes don't come to class.
Another student explained how work and family commitment contributed to her nonattendance:
I work over 40 hours a week, so it's kind of the reason why I don't put my priorities in order in the best way, and if I've missed class it's because I was out of state because that's where my family is.
Therefore, students typically feel like attendance is not an option when they need to work, experience an illness, or are involved in other medical emergencies. One participant stated: "Either I'm really sick or at work. I actually have a job to go to." Although all participants agreed that it is important to attend classes, there are cases in which their failure to attend is simply a result of the weather. Although one would expect bad weather to increase nonattendance, the focus groups indicated that good weather also invites poor attendance. For example, one participant stated:
Just to share, when the weather is extremely good or bad you don't want to spend that period in the classroom; you want to be at home or outside. I had friends that flew up. I just hung out with them like a week or two, so I thought it was worth it to skip a class or [to] to spend time with them. They're only going be here a maximum of five days. So I chose to skip a class or two.
However, there are times when students simply do not attend because of instructional practices or a dislike of the instructor. One participant explained how he only attended a few times as a result of the instructor:
Yes, I hated the professor. Like, [we] did not get along. So I said "You know what, here's my homework-I'm not going to show up until the final." We had like six papers, and I handed in all my assignments at the beginning of the semester. I had this person before, and we had a personal issue. I was like, "Give me my assignments and I will see you on the final."
Although the diversity of the campus is often embraced by students, faculties, and the administration, many foreign students leave early, before a break such the Christmas holiday and arrive after classes have started. This pattern was evident on the 7th lecture day shown in Figure 1. For example, one participant said, "Sometimes I might go back to my country, so I will ask to leave early and do a make-up test another day."
However, students are encouraged to attend by caring teachers who are able to develop a good relationship with their students and by teachers who are effective at presenting course material. For example, one participant was encouraged to attend classes solely because of the instructor. She stated:
It goes back to why you attend the class regularly. Like, if the professor is making an effort to show up to teach you something, why not be there? So they do care. Often times, if they didn't care, they would tell you at the front door, "Get outta my class."
When courses are challenging for students (as introductory statistics courses often are), students also tend to attend at a greater rate. Therefore, the difficulty of a course seems to motivate students to attend. For example, one participant concluded that:
The subject that I excel in I tend not to go as much versus a class that I don't know what's going on in. I try to show up more because I won't understand it if I don't attend.
Another participant tried to clarify and explain how and why he attended some classes:
More like hard science classes you got to attend more, because if you miss like one part, you're not going to be able to move on. Classes like law classes something like that, you could miss one part of the subject and still be able to pick up next class. They tend to be interlinked but not dependent on each other. So, like, math classes and science classes tend to be more dependent upon one another.
Thus, attendance is promoted by teachers who are able to engage students and make the lesson and classroom environment exciting and fun for students. One participant recalled an experience in one of her courses:
I had a professor two years ago who used to take the classroom experience and change it every time you went. He'll do one thing one day and another day something else. Because it was marketing, we'll play video games and then he'll go back and forth and joke and then we're having a meeting at another place at another time, and I think that was really entertaining because we didn't know what was going to happen. So, I think if classes were more like that they will draw more attention.
Another participant echoed a similar response:
I will base it on the professor. The professor usually makes me want to come or not come every day. Usually if the professor is good and teaches you well, and you're actually learning and comprehending what they're saying, then yes, I'll be in class regularly.
Interestingly, the majority of participants preferred to be "forced" to attend if the instructor used participation points rather being mandated to attend by a mandatory attendance policy. One participant concluded that he would not attend classes if participation points were not part of the overall assessment in a course:
Honestly, for me, I try to attend classes that are graded based on participation. For example, all these clickers motivated me to be present just because I know for a fact I'm losing something just for not showing up. But there are classes that don't require it.
However, the vast majority of participants enjoyed clickers, especially since they did not need to purchase them. For example, one participant stated:
I like the clickers because I know like me some kids aren't like as vocal in class so maybe like their participation isn't as like high. I'm pretty loud all the time, but in Statistics, I'm not that smart, so I like that there's a clicker to help me with my participation grade. I also like that that this year we didn't have to buy them. Because I know freshman year I still have my clicker in this bag that I bought in one class so this is good for the upcoming kids. I know it stinks because you have to carry it [clicker set] to class everyday but is better than to spend $100 on a clicker that I used once.
Another participant explained how the classroom environment improved as a result of clickers:
I feel like it makes the class a little bit more entertaining. Relating technology with the student. It makes them focus more or at least in my case. People are playing like they will shout out the answer, but if you actually look at it, you think about the question while you're sitting in your seat which answer you're going to choose and you do sit there and work it out and sometimes you do get the answer correct.
I heard similar responses in other lectured sessions when participants seemed disappointed when clicker questions were finished. All participants enjoyed the immediate feedback that clickers provided. One student agreed and added that clickers reduced her stress level when solving introductory statistics clicker problems:
I think it takes away the anxiety of you taking a quiz and you handing it oh crap how did I do on that question. You get the immediate gratification that boom you clicked the answer it pops up and you know I either got the answer or I didn't. And you move on to the next one. You're no longer thinking about how did I do on that question. So a lot of times you don't know until the next class period and it's like two days later you go crap how did I do on that quiz.
However, focus group participants did not like it when students shouted out some of the answers before the clicker responses and answers were displayed. One participant suggested that I "make everyone not talk" during the clicker questions. Another participant explained that "sometimes when you're not sure, people shout out the answers, so then you pick that answer you get it wrong." Another participant explained the classroom environment:
Because it's so interactive, people tend to take it more as a joke. When there's a quiz, it's all right you have to be quiet. With clickers, people tend to just play around more. So, they do tend to shout out the answer more, and it can screw you up. You get that self-doubt like so and so said that answer and they might be right.
Limitations
Ideally, participants would have been randomized when it came to creating the clicker and nonclicker classes. However, these participants could not be randomized, as they chose whether to be in the clicker or nonclicker class, though they were not aware of which section the intervention was going to be used in. Finally, even though the data was triangulated and every effort was made to ensure consistency in the treatment of participants in both classes, it is possible that learners from one group were unknowingly encouraged or motivated to attend more classes than the other group.
Discussion
The results from this study are consistent with other research findings. For instance, Morling, McAuliffe, Cohen, and Dilorenzo (2008) concluded that "attendance neither increase[s] nor decrease[s] over the semester" with clickers (p. 48). King and Robinson's (2009) study of 145 undergraduate engineering students also reported no statistically significant differences in attendance rates resulting from clicker use, "based on classroom observations" between a 2007-2008 cohort and a 2006-2007 cohort (p. 197). Further, Trenholm and Dunnet (2007) observed that "students not using clickers had even higher mean attendance levels than students using clickers" (p. 6). In their study, one section used clickers, one section did not use clickers, and one section was mixed. In the mixed section, some participants used clickers while others did not use clickers. Although the mixed class had a slightly higher attendance rate, the difference was negligible and nonsignificant.
All participants agreed that it was important to attend classes and admitted to being aware of the possible negative consequences of not attending. Nonetheless, students still had reasons to not attend. One participant stated: "I miss class sometimes because I'm sick. Sometimes, I'm just not feeling it for the day, or I just don't feel like listening to the teacher. It's bad, though." These results support the findings of Shannon (2006) and Doyle et al. (2008) , which show that illnesses and medical emergencies decrease attendance. Other major reasons for not attending include spending time with friends or family, completing assignments for other classes, traveling, and particularly good or bad weather. These results were echoed in van Schalkwyk, et al.'s (2010) study. Poor teacher relationship and the quality of the lecture also contribute to nonattendance among participants. These results parallel the findings of Newman-Ford, Fitzgibbon, Lloyd, & Thomas (2008) and Doyle et al. (2008) .
Missing classes due to financial obligations is a major theme that emerged during the focus group sessions. Participants expressed dissatisfaction about high tuition costs and resented being required to purchase clickers in the past. These financial obligations were seen as putting a strain on their ability to attend due to a need to work. Not attending as a result of part-time and full-time work was the most frequent reason for not attending. These findings support several previous studies (e.g., Doyle et al., 2008 ; van Schalkwyk et al., 2010 ).
Future Implications
This study suggests that when clickers are linked with a participation grade of five percentage points or less, attendance does not increase. Therefore, clickers do not magically increase attendance. A well-prepared, motivated, and caring lecturer who encourages participation and is able to establish a relationship with students is more likely to improve attendance and, in turn, can enhance the effect that clickers have on learners. Researchers interested in replicating this study should consider implementing clickers during other timeslots and on other days besides Mondays and Wednesdays to determine if similar nonsignificant results are obtained. Furthermore, because the majority of learners in this study had a positive perception of clickers, but they had reservations regarding the timing of clicker questions; in the future researchers should consider conducting clicker questions only during the middle or at the end of the lecture-not at the beginning.
Conclusion
Research studies on attendance in introductory statistics are limited. Besides work commitments, medical emergencies, and other uncontrollable factors, students cite boring classes, ineffective lectures, and a dislike of the lecturer as significant reasons to not attend ( Fitzpatrick et al., 2011 ). However, the lecturer can attempt to influence students' behavior to attend by using the clicker technology to engage students while they remain anonymous. Even though the findings from the study revealed there were no statistically significant differences in attendance rates between learners in the clicker and nonclicker classes, clickers can change a classroom environment from a quiet, lecture-centered session into a game-like atmosphere that encourages communication and participation. Learners perceive the technology to be interactive and entertaining and they prefer earning participation points using the clicker technology rather than by listening to a teacher-centered lecture. Some participants even feel that the clicker technology reduces their stress level and provides a visual approach to learning. These attributes add a positive experience for learners and invite the implementation of other mobile devices (i.e., smartphones and tablets) into classrooms regardless of students' attendance records.
Raoul Amstelveen is an Associate Professor at Johnson and Wales University, North Miami, Florida.
References
Allen, S. G. (1981). An empirical model of work attendance. Review of Economics & Statistics, 63 (1), 77.
Barlow, J., & Fleischer, S. (2011). Student absenteeism: Whose responsibility? Innovation in Education and Teaching International, 48 (3), 227-237.
Bradley, C. (2009). Learning to live with statistics: From concept to practice. Teaching Sociology, 37 (3), 322-324.
Clark, G., Gill, N., Walker, M., & Whittle, R. (2011). Attendance and performance: Correlations and motives in lecture-based modules. Journal of Geography in Higher Education, 35 (2), 199-215.
Cleary-Holdforth, J. (2007). Student truancy in higher education. A phenomenon of student apathy or poor pedagogy? Dublin Institute of Technology, Level 3, 5 . Retrieved from http://level3.dit.ie/html/issue5/cleary-holdforth/cleary_holdforth.pdf
Dineen, L. C., & Blakesley, B. C. (1973). Algorithm AS 62: Generator for the sampling distribution of the Mann-Whitney U statistic. Applied Statistics, 22 , 269-273.
Dolnicar, S. (2005). Should we still lecture or just post examination questions on the web? The nature of the shift towards pragmatism in undergraduate lecture attendance. Quality in Higher Education, 11 (2), 103-115.
Doyle, L., O'Brien, F., Timmins, F., Tobin, G., O'Rourke, F., & Doherty, L. (2008). An evaluation of an attendance monitoring system for undergraduate nursing students. Nurse Education in Practice, 8 (2), 129-39.
Dunham, B. (2009). Statistics clicks: Using clickers in introductory statistics courses . Retrieved from http://www.cwsei.ubc.ca/SEI_research/files/Stat/BDunham_ClickersInStat.pdf
Fitzpatrick, J., Cronin, K., & Byrne, E. (2011). Is attending lectures still relevant in engineering education? European Journal of Engineering Education, 36 (3), 301-312.
Gok, T. (2011). An evaluation of student response systems from the viewpoint of instructors and students. Turkish Online Journal of Educational Technology, 10 (4), 67-83.
Gupta, M. L. (2010). Interactive teaching and learning by using systems. The International Journal of Learning, 17 (5).
Haeusler, C. E., & Lozanovski, C. (2010, December) Student perception of clicker technology in science and mathematics education . Paper presented at the 2010 Enhancing Learning Experiences in Higher Education Conference, Hong Kong. Retrieved from http://eprints.usq.edu.au/18154/1/Haeusler_Lozanovski_2010_2_PV.pdf
Hunter, S., & Tetley, J., (1999, July). Lectures. Why don't students attend? Why do students attend? Paper presented at the HERDSA Annual International Conference , Melbourne, Australia.
Kay, R. H., & LeSage, A. (2009). Examining the benefits and challenges of using audience response systems: A review of the literature. Computers & Education, 53 , 819-827.
King, S. O., & Robinson, C. L. (2009).'Pretty lights' and maths! Increasing student engagement and enhancing learning through the use of electronic voting systems. Computers & Education, 53 (1), 189-199.
Laxman, K. (2011). A study on the adoption of clickers in higher education. Australasian Journal of Educational Technology, 27 (8), 1291-1303.
Massingham, P., & Herrington, T. (2006). Does attendance matter? An examination of student attitudes, participation, performance and attendance. Journal of University Teaching and Learning, 3 (2), 82-103.
Milner-Bolotin, M., Antimirova, T., & Petrov, A. (2010). Clickers beyond the first-year science classroom. Journal of College Science Teaching, 40 (2), 14-18.
Morling, B., McAuliffe, M., Cohen, L., & Dilorenzo, T. M. (2008). Efficacy of personal response systems ("clickers") in large introductory psychology classes. Teaching of Psychology, 35 , 45-50.
Murphy, T. J., McKnight, C., Richman, T., & Terry, R. (2008). Clicker questions . Retrieved from The University of Oklahoma, http://www.ou.edu/statsclickers/clickerQuestions.htm
Newman-Ford, L., Fitzgibbon, K., Lloyd, S., & Thomas, S. (2008). A large-scale investigation into the relationship between attendance and attainment: A study using an innovative, electronic attendance monitoring system. Studies in Higher Education, 33 (6), 699-717.
Prather, E. E., & Brissenden, G. (2009). Clickers as data gathering tools and students' attitudes, motivations, and beliefs on their use in this application. Astronomy Education Review, 8 (1).
Revell, A., & Wainwright, E. (2009). What makes lectures 'unmissable'? Insights into teaching excellence and active learning. Journal of Geography in Higher Education, 33 (2), 209-223.
Rodgers, J. R. (2002). Encouraging tutorial attendance at university did not improve performance. Australian Economic Papers, 41 (3), 255-266.
Romer, D. (1993). Do students go to class? Should they? Journal of Economic Perspectives, 7 (3), 167-174.
Shannon, S. J. (2006, December). Why don't students attend lectures and what can be done about it through using iPod nanos? Paper presented at the 23rd ASCILITE Conference: Who's learning? Whose technology? The University of Sydney, Australia. Retrieved from http://www.ascilite.org.au/conferences/sydney06//proceeding/pdf_papers/p28.pdf
Steers, R. M., & Rhodes, S. R. (1978). Major influences on employee attendance: A process model. Journal of Applied Psychology, 63 (4), 391-407.
Trenholm, B., & Dunnett, J. (2007). When it all "clicks"-the effectiveness of using game show technology in the classroom. Financial Education Association, Bermuda . Retrieved from http://abeweb.org/proceedings/proceedings07/Bdunnett.pdf
van Schalkwyk, S., Menkveld, H., & Ruiters, J. (2010). What's the story with class attendance? First- year students: Statistics and perspectives. South African Journal of Higher Education, 24 (4), 630-645.
Wood, D. M., Burke Da Silva, K. L., & Menz, R. I. (2007, July). Are the benefits of clickers due to the enforcement of good pedagogy? Paper presented at the 30th HERDSA Annual Conference, Adelaide, Australia. Retrieved from http://www.herdsa.org.au/wp-content/uploadsconference/2007/papers/p179.pdf