JOTS v39n2 - Feasibility Assessment of Using the KIP System to Achieve an Energy-Saving Potential for an Electronic Marquee
By Wen-Fu Pan, Shih-Chun Tu, Mei-Ying Chien, and Ya-Moo Zhang
Abstract
Conventional electronic marquees continue to consume energy even without a human presence. The purpose of this study is to assess energy-savings potential via the installation of the Kinect and IP Power integrated system (KIP) on an electronic marquee; this system will transfer the consumption data for total electricity to electricity-monitoring software (EZ-HD) using a smart meter (EZ-RE) and the ZigBee USB Dongle. An experiment was conducted at one school entrance for two periods during 10 school months, and it was found that the hourly electricity consumption rate for the original electronic marquee system was 1.25 kWh. After the KIP system was installed, the electronic marquee was activated only during human presence, and the hourly electricity consumption rate was 0.97 kWh, providing an average electricity savings rate of 22.4%. The results suggest that the KIP system can help to reduce the consumption of electricity for electronic marquees. Compared to infrared sensor parts used in the past as power switches for electronic equipment, the advantage of the KIP system is that it can distinguish a human presence and would not be interfered by moving objects or animals. In addition, the KIP system has a wider detection range and allows the users to program and detect different electricity-saving contexts and configurations for electronic equipment in different venues according to their individual needs. Therefore, through this test and assessment, we suggest that it is feasible to apply the KIP system in automatic lighting devices, televisions, air conditioners, or security monitoring systems.
Keywords: Electricity-Savings Designs; IP Power; Kinect; Smart Meters
Introduction
For a long time, reducing electricity and energy use has been a primary strategy for reducing the consumption of global energy and carbon emissions; thus, the research related to designing architectural spaces with electricity-savings effect has always received strong attention ( Harvey, 2009 ). For example, regarding electricity-efficient or electricity-savings building materials, Sadineni, Madala, and Boehm (2011) compared the electricity-savings potential of trombe, ventilated, and glazed wall materials, and they found that air tightness and infiltration of the materials were critical factors that influenced electricity savings. Sadineni et al. (2011) suggested that if the factors of electricity-savings materials were considered prior to construction, no additional reinvestment of electricity-savings costs would be needed. Regarding indoor air conditioning, Ali and Morsy (2010) compared the electricity-savings potential of 290 W radiant panel heaters and 670 W conventional portable convective heaters, and found that when the outdoor temperature was 10°C, the 290 W radiant panel heaters provided more comfort and saved approximately 56.7% in energy consumption. In addition, Shehabi, Masanet, Price, Horvath, and Nazaroff (2011) studied and tested several large-scale U.S. data center buildings; the results suggested that the local climate, the used airflow management, and proper control sequences were the factors that could be used to potentially save electricity. Their research results also demonstrated that average data center buildings could save 20% to 25% in electricity or energy consumption, and that the server rooms of data centers could save nearly 30% in electricity or energy consumption, amounting to a savings of 1.3 to 1.7 billion kWh of electricity annually.
Although energy-savings architectural space design is an effective energy-savings strategy, other studies have investigated how the billing methods of the household micro-energy generation may influence the energy-savings effect. Darghouth, Barbose, and Wiser (2011) studied 200 households that used two power companies in California as samples and compared the electricity-savings potential of net metering and feed-in tariff. Because most electricity meters in the United States can be measured using two-way measurement (electricity generation and consumption), a net metering policy was implemented to allow users to deduct a portion of the fee from their electricity bills based on the amount of electricity sold. The study conducted by Darghouth et al. (2011) showed that net metering had a better electricity-savings effect than feed-in tariffs, indicating that if electricity-generation income could instantly be reflected in electricity use or electricity expenditure reductions, the users would be more willing to reduce electricity consumption costs.
The above mentioned two-way measurements did not provide users access to monitoring and managing their electricity-consumption data. The smart meter is a new digitized electricity-consumption measuring system, which can accurately show electricity usage amounts and return or feedback electricity usage information through the Internet. The research institution In-Stat has estimated that by 2016 smart meters could create a global production value of approximately USD $1.2 billion ( Business Wire, 2011 ). One especially thriving factor for producing this smart meter is its incorporation of the ZigBee wireless sensor network to transmit information. ZigBee is specified as a suite of high-level communication protocols using small, low-power digital radios based on an IEEE 802 standard for personal area networks ( Rothe & Girhepunje, 2012 ). For example, market analysis and forecasts as electric utilities provide a ZigBee wireless sensor smart meter to their electricity customers as a home energy-management tool ( Sober, 2011 ). The Ember Corporation (2010) has developed a type of ZigBee wireless sensor smart meter that could be used as a home and commercial electricity monitoring and management system. This corporation also has promoted its smart meter installation plan in Europe; British Gas was the first company approached and employed by Ember to promote this plan. British Gas anticipated that the installation of wireless smart meters would help its 2 million household users to reduce carbon emissions by providing them with access to monitoring their consumption of either electricity or natural gas. ZigBee’s wireless sensor networks have received widespread attention from researchers ( Egan, 2005 ; McCain, 2011 ; Rothe & Girhepunje 2012 ). The wireless sensor networks are positioned to provide wireless transmission applications such as controlling air conditioning and lighting for residential and commercial areas, and they are designed specifically to replace the continuous increasing independent remote controls ( Egan, 2005 ). Currently ZigBee has several hundred united or allied industries ( ZigBee Alliance, 2012 ).
In this study, we used a ZigBee wireless energy-management system, named EZ-R Series (included EZ-RE smart meter, ZigBee USB Dongle, and EZ-HD software produced by Joseph Technology Co. Ltd.), as a smart meter for collecting electricity-consumption data. The system was designed by installing a Dongle, a USB tool that conformed to ZigBee Protocol, for the reception of electricity-consumption information from EZ-RE smart meter. The energy-management software, EZ-HD, was installed in a laptop to show real-time electricity-consumption information via the ZigBee USB Dongle when electricity-consumption devices were running. The electricity-consumption data on the EZ-HD included energy consumption rates for one day, one month, cumulative months, or cumulative years ( Joseph Technology, 2011 ). In general, the EZ-R Series could only passively collect electricity-consumption information, and it could not actively help consumers reduce the consumption of electricity without the collocation of other electricity-savings spatial designs. A study conducted by Pan, Chien, Liu, and Chan (2012) indicated that Kinect and IP Power integrated systems could improve the accessibility of electronic devices in schools, for example, it could promote interaction between people and electronic devices with sensors to activate or deactivate devices such as air conditioning and lights. Hence, in this study, we further employed the integrated Kinect and IP Power systems (KIP) to design an electricity-savings context to help us assess the real-time interaction between people and electronic marquees at the school entrance area. The KIP system used in this study consisted of a Kinect, a laptop, an IP Power, an OpenNI, a CL_NUI platform, and an OpenNI SDK; we used C# programming language to write and complete the control program for the KIP system. The KIP system was placed at the front side of electronic marquee, and when a person walked into Kinect’s sensing area, the Kinect would transmit the sensor data to IP Power in a laptop Windows operating system and activate the IP Power control program, thereby switching on the power source of the electronic marquee.
The current common sensing methods, such as infrared light emitters and sensors, radio frequency identification, Bluetooth, Zigbee, WiFi, GPS, and depth sensors (such as Microsoft Kinect), all have various configurations and techniques involving detection of proximity ( Kumaragurubaran, 2011 ). But regarding the above sensing methods, the infrared (IR) sensor and depth sensor (Kinect) are the only two methods applied in body sensing without a hand-held device ( Hill, 2012 ). Previous studies ( Hu, Jiang, & Zhang, 2008 ; Ma, 2012 ; Yamtraipat, Khedari, Hirunlabh, & Kunchornrat, 2006 ) have shown the effects of using IR sensors for saving electricity. However, IR sensor parts are often interfered by passing dogs, cats, or other animals, causing abnormal activation of the devices ( Pan, Lin, & Wu, 2011 ). In contrast, Kinect can distinguish human presence and has a wider sensor range area than IR. Users also can reconfigure them according to individual needs to develop detection contexts for electronic devices required in different venues ( Pan, Tu, & Chien, 2012 ).
Kinect is a human-body sensing input device by Microsoft for the Xbox 360 video game console and Windows, which enables users to interact with the Xbox 360 without the need for a hand-held controller; it is also a 3D depth sensor that integrates three lenses ( Pan, Chien, & Tu, 2012 ). The IP Power system, launched by the AVIOSYS Corporation, can control the power source switches using the Internet and has four power ports, which can independently manage power sources for four electrical devices ( Aviosys International Inc., 2011 ). In this study, we used the source code drivers released by PrimeSense to write a program that controlled the power source switch of the IP power; the operation would enable the electrical device to actively switch its power on or off based on body-sensing, and thereby achieve energy savings by switching off the electrical device when no one was around to use it.
Therefore, the purpose of this study was to install a KIP integrated system for the electronic marquee at the gate of one case study school. The EZ-RE electricity meter, Zigbee USB Dongle, and the electricity monitoring software EZ-HD were employed to assess whether the KIP integrated system indeed has energy-savings potential when applied to an electronic marquee.
Methods
Description of the Test Site
The energy-savings test was conducted at one elementary school located in an aboriginal community at eastern Taiwan. The electronic marquee was placed at the school’s front gate, which was the only entrance and exit for the school. The school’s principal had suspected that rising electricity costs were due to the placement of this electronic marquee. Therefore, we proposed this KIP system and installed it at the front side of electronic marquee to assess whether it would help to achieve energy savings.
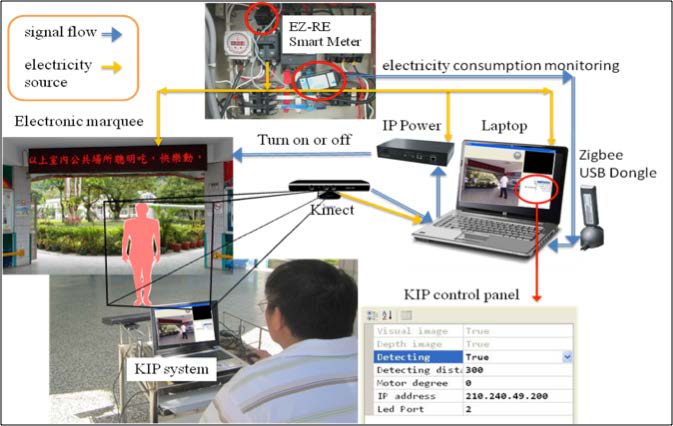
Energy-Savings Architecture of the KIP System
The KIP system architecture used in this study to save energy is shown in Figure 1. The KIP system was placed at the front side of electronic marquee, and when a person walked into the Kinect’s sensing area, it would transmit the sensor data to IP Power in a laptop Windows operating system and activate the IP Power control program, thereby switching on the power source of the electronic marquee. Conversely, when no person was present in the Kinect sensing area, the power source of the electronic marquee automatically switched off.
The Software and Hardware of the KIP System
The KIP system used in this study consisted of software and hardware components. The hardware part included the employment of Kinect as depth sensors, a laptop as an operation platform, and an IP Power 9258HP as the remote power switching controller. The software part included the use of OpenNI 5.0.1, CL_NUI platform 1.0.1210, and OpenNI SDK 1.1.0.41. The OpenNI 5.0.1 was used as the driver to activate Kinect in the Windows operating system; the CL_NUI platform 1.0.1210 was used to activate Kinect’s internal motors and enable Kinect to oscillate vertically; the OpenNI SDK 1.1.0.41 was used to write a command program that would translate Kinect’s signals into the IP Power’s switch functions. In this study, we used C# programming language to write and complete the control program for the KIP system.
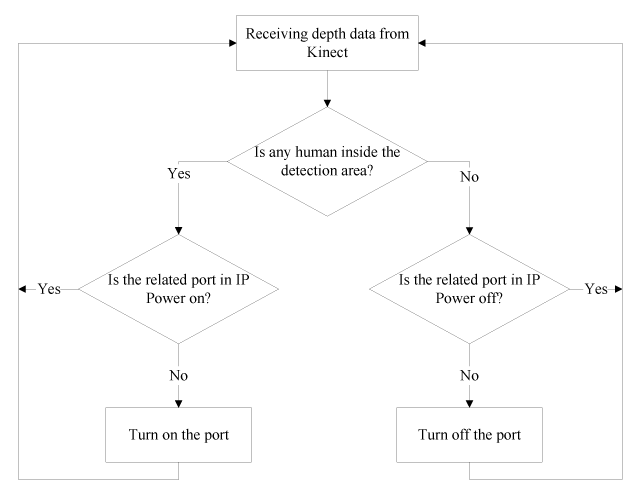
The Information Control Flow Chart of the KIP System
Figure 2 shows the information control flow chart of the KIP system. The KIP system used in this study could sense a human presence in the detection area and determine whether the power source for a port on the IP Power should be turned on or off.
Using the EZ-RE to Monitor the Electricity Consumption of the Electronic Marquee
The operational architecture of the EZ-RE smart meter is shown in Figure 3.
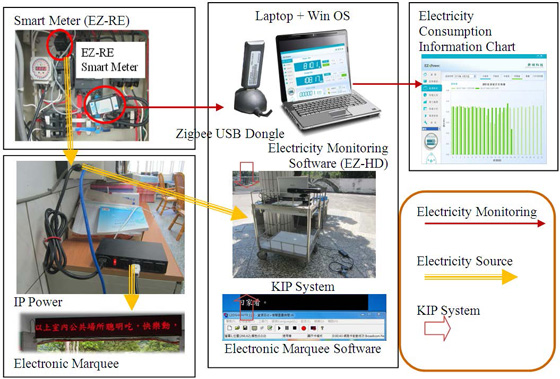
The EZ-RE smart meter used in this study provided the functions of measuring current power (W), interval electricity consumption (kWh), and accumulated electricity consumption. An EZ-RE smart meter was used in conjunction with the EZ-HD software and the ZigBee USB Dongle to gather electricity consumption information. The electricity-consumption data gathered from laptop, IP Power, and electronic marquee was measured via EZ-RE smart meter and transmitted via ZigBee USB Dongle to the EZ-HD energy management software. The electricity- consumption data of EZ-HD showed the yearly, monthly, and daily electricity usage, so the data could be converted into statistical information (with or without KIP installed).
The Measurement of Electricity Consumption during Peak and Non-Peak Hours
This study used the electricity consumption of 1.25 kWh for its measurement on May 4, 2012, between 6:30AM and 7:30AM (including the electricity consumption of the accompanying laptop but without KIP system) as the basis for the per-hour electricity consumption rate of the electronic marquee. After we installed the KIP system to the electronic marquee, we continuously measured the electricity consumption rates (kWh) for 10 school months starting on February 2012 at peak hours (6:30AM to 7:30AM) and non-peak hours (9:00AM to 10:00AM). The peak and non-peak hours defined by this study were based on the school routine and the information given by school teachers. In spite of the change of seasons, people passing through the school entrance stayed regular at peak and non-peak hours. Therefore, the researchers simply chose 10 school months to test the electronic marquee with KIP system.
Comparison of the Electronic Marquee’s Electricity Consumption Before and After the KIP Installation
Before the KIP system was installed on the electronic marquee, the hourly electricity consumption rate for the electronic marquee (including the electricity consumption of a laptop installed with marquee software) was measured as 1.25 kWh. With the KIP system installation, the electronic marquee power source was activated only when a person was nearby or in the marquee sensor zone, and it would automatically deactivate when no person was nearby or when people left the sensor zone. The electricity-consumption calculation method for the electronic marquee using the KIP is shown in Table 1.
| Time | ||
|---|---|---|
| Electricity Consumption Category | Peak Hours 6:30-7:30 | Non-peak Hours 9:00-10:00 |
| One hour of electricity consumption for the electronic marquee (including a laptop) | 1.25 kWh (A) | 1.25 kWh (A) |
| One hour average electricity consumption for the electronic marquee with KIP installed (10 month average) | 1.09 kWh (B1) | 0.85 kWh (B2) |
| Electricity saving ratio after KIP installation | SR1= (A-B1) / A | SR2 = (A-B2) / A |
| Average electricity saving ratio after KIP installation | (SR1+SR2) / 2 | |
The 10-month average electricity consumption for the electronic marquee installed with the KIP was (B1) kWh at peak hours and (B2) kWh at non-peak hours. We calculated the peak hour electricity saving ratio SR1 (including electricity consumption for the KIP system) using a calculation formula of (1.25-B1)/1.25, and the non-peak hour electricity saving ratio SR2 (including electricity consumption for the KIP system) using a calculation formula of (1.25-B2)/1.25. The energy-savings potential of the KIP system for the campus marquee was assessed by averaging the SR1 and SR2 electricity saving ratios from the two periods.
Results
Measurements taken on May 4, 2012, indicated that the one-hour electricity consumption rate for the continuously activated electronic marquee (including the accompanying laptop) was 1.25 kWh. After the installation of the KIP system, the electricity consumption rates of peak and non-peak hour periods for 10 continuous school months (between February 2012, and January 2013, are shown in Table 2.
| Time | |||
|---|---|---|---|
| Testing Month |
Peak Hours
6:30-7:30 |
Non-peak Hours
9:00-10:00 |
Average Electricity Consumption (kWh) |
| Note: 1. Peak Hours vs. Non-peak Hours, ** p = .000 (t = 11.77, α = .01, df = 9, SD = .065); 2. Before vs. after KIP system installed, ** p = .000 (t = 12.81, α = .01, df = 9, SD = .069) | |||
| 2012/2 | 1.14 | 0.83 | 0.99 |
| 2012/3 | 1.03 | 0.86 | 0.95 |
| 2012/4 | 1.16 | 0.91 | 1.04 |
| 2012/5 | 1.02 | 0.72 | 0.87 |
| 2012/6 | 1.17 | 0.88 | 1.03 |
| 2012/9 | 1.08 | 0.95 | 1.02 |
| 2012/10 | 1.02 | 0.74 | 0.88 |
| 2012/11 | 1.15 | 0.97 | 1.06 |
| 2012/12 | 1.06 | 0.86 | 0.96 |
| 2013/1 | 1.04 | 0.75 | 0.90 |
| Mean (10-month) | 1.09 | 0.85 | 0.97 |
| SD (10-month) | 0.06 | 0.09 | 0.07 |
The average peak hour electricity consumption rate was 1.09 kWh, the average non-peak hour electricity consumption rate was 0.85 kWh, and the average electricity consumption rate for peak and non-peak hours was 0.97 kWh. Based on above results, a paired t-test analysis was conducted and found: 1). the difference between peak hour and non-peak hour of Electronic Marquee with KIP was statistically significant (t = 11.77, α = .01, ** p = .000); 2). The use of before and after Electronic Marquee with KIP system also showed a statistically significant difference (t = 12.81, α = .01, ** p = .000). As shown in Table 2, the electricity-consumption rate after the KIP system installation was significantly lower than the electricity consumption rate prior to its installation when the marquee was left on continuously.
Table 3 shows that the one-hour electricity consumption rate for the original electronic marquee system was 1.25kWh. After the installation of the KIP system, the electronic marquee was activated only during human presence, and the average peak hour electricity-consumption rate was 1.09 kWh, providing an average electricity savings rate of 12.8%; the average non-peak hour electricity consumption rate was 0.85 kWh, providing an average electricity-savings rate of 32.0%; the average hourly electricity-consumption rate was 0.97 kWh, providing an average electricity-savings rate of 22.4%.
| Time | ||
|---|---|---|
| Electricity Consumption Category | Peak Hours 6:30-7:30 | Non-peak Hours 9:00-10:00 |
| One hour of electricity consumption for the electronic marquee (including the used for marquee titles) | 1.25 kWh (A) | 1.25 kWh (A) |
| One hour average electricity consumption for the electronic marquee with KIP installed (10 month average) | 1.09 kWh (B1) | 0.85 kWh (B2) |
| Electricity saving ratio after KIP installation | 12.8% | 32% |
| Average electricity saving ratio after KIP installation | 22.4% | |
The above-mentioned results indicate that the KIP system can significantly reduce the electricity consumption of the electronic marquee. Therefore, we suggest that the KIP system can help to achieve the potential for energy savings for an electronic marquee.
Discussion
The intelligent building automation technologies were expected to grow 8.20% during 2010-2015, and there is also expected to be an increase in personalized control of lighting, temperature, ventilation, and other aspects of the interior environment to enhance the productivity of knowledge workers ( MarketsandMarkets, 2011 ). When the issue of saving energy is concerned, electronic devices and facilities, such as lights, air conditioning units, and electronic marquees should only be active during human presence. However, because these devices are not equipped with human-detection devices, they are often active when no one is present, and therefore result in an unnecessary waste of energy. Therefore, the KIP system can be expanded to use with other electrical devices that should only be active when humans are present. Taiwan’s school system has approximately 200 school days annually. If we multiply 200 school days by 24 hours a day (The marquee is generally on 24 hours per day in Taiwan’s schools) and approximately 0.28 kWh of electricity savings per hour (1.25 – 0.97) and thereafter multiply this number by the basic electricity fee of at least NTD $3.00 per 1 kWh, it comes out that the KIP installed electronic marquee will save approximately NTD $4032 for a school year, or USD $137 The calculation formula is as follows:
(200 days × 24 hr × 0.28 kWh × NT$ 3) ÷ Exchange rate 29.5 ≒ US$ 137
(Kinect US$ 220 + IP Power US$150) US$ 137 ≒ 2.7 Semester Years
The KIP system can save the school at least USD $137 in electricity fees for a school year, excluding non-school days. Considering the KIP system investment costs of Kinect at approximately USD $220 and IP Power at approximately USD $150, it is estimated that the investment costs for the KIP system can be recovered in approximately 2.7 school years. A study by Hittinger, Mullins, and Azevedo (2012) indicated that the U.S. electricity consumption for video games has continually increased and it would increase by 50% between 2007 and 2010. Such an increase in electricity consumption is primarily caused by users’ habit of not turning off gaming consoles when they stopped playing. The KIP system developed by this study is ideal to resolve this problem, and we suggest that the gaming industry could add an automatic shutdown design. As long as the users plug the gaming console into the KIP system, the console power source can automatically be activated or deactivated, depending on human presence in the vicinity of the game console.
According to the test result of this study, we also find that the amount of electricity saved by the KIP system is affected by two factors: the basic electricity-consumption rate of the electronic equipment and the amount of human presence. Regarding the basic electricity-consumption rate factor, the installation of the KIP system can save 22.4% in electricity consumption, but because the electricity consumption rate (in kW) for air conditioners is greater than that of electronic marquees, the KIP system can save more electricity (in kW) for air conditioners than it can for electronic marquees. In addition, in terms of human presence, if an electronic marquee is installed at a smaller school, it would have less human presence because of a small number of students; thus, the energy-savings potential will be greater compared to an electronic marquee installed at a larger school.
Based on the above test result and evaluation, we suggest that it is feasible to apply the KIP system in various building spaces and environments, such as school classrooms or libraries, automatic lighting devices, televisions, air conditioners, or energy-saving design for building security-monitoring systems.
Conclusions
Electronic marquees generally stay on and waste energy, even when nobody walks past them or is present to read them. In this study, the KIP system was installed to an electronic marquee system and used EZ-HD electricity monitoring software to test whether the KIP system would have the potential to save energy. We measured the electricity consumption rates at the case study school for 10 continuous months. It was found that the electronic marquee system in its original continuously active state consumed (including the laptop that runs the marquee title software) 1.25 kWh of electricity per hour, and that the average hourly electricity consumption rate for the marquee system with the KIP system installed was 0.97 kWh. The above result showed an average electricity savings rate of 22.4%, and indicated that the KIP system would help to reduce the electricity consumption of the electronic marquee.
Compared to the IR sensor parts used to automate, activate, and deactivate electronic device power sources in the past, we find that the advantages of the KIP system include: 1). It can detect/distinguish human presence and so it will not activate power sources when animals (e.g., cats and dogs) or other moving objects pass by; 2). It has a wider detection range and so it can be reconfigured according to the individual needs when energy saving is concerned. The KIP system provides users with an avenue to save electricity, so we suggest that it is feasible to apply the KIP system in various building spaces and environments, such as school classrooms or libraries, automatic lighting devices, televisions, air conditioners, or energy-savings building design.
Wen-Fu Pan is an Associate Professor in the Department of Educational Administration and Management at the National Dong Hwa University, Haulien, Taiwan
Shih-Chun Tu is an Assistant Professor in the Department of Computer Simulation and Design, Shih Chien University, Kaohsiung, Taiwan
Mei-Ying Chien is an Associate Professor in the Department of Educational Administration and Management at the National Dong Hwa University, Haulien, Taiwan
Ya-Moo Zhang is a teacher at Sui-Yuan Elementary School, Haulien, Taiwan
References
Ali, A. H. H., & Morsy, M. G. (2010). Energy efficiency and indoor thermal perception: A comparative study between radiant panel and portable convective heaters. Energy Efficiency, 3 (4), 283-301. doi: 10.1007/s12053-010-9077-3
Aviosys International Inc. (2011). Main features of IP Power 9258 . Retrieved from http://www.aviosys.com/ipenergy.html .
Business Wire (Aug 31, 2011). Research and markets: Worldwide smart meter revenue to surpass US$12 billion in 2016, ZigBee the early technology leader . Retrieved from http://www.researchandmarkets.com/research/266c1e/getting_smart_on_w .
Darghouth, N. R., Barbose, G., & Wiser, R. (2011). The impact of rate design and net metering on the bill savings from distributed PV for residential customers in California. Energy Policy, 39 (9), 5243-5295.
Egan, D. (2005). The emergence of ZigBee in building automation and industrial control. Computing & Control Engineering Journal, 16 (2), 14-19.
Ember Corporation (2010). Ember emerges as a European Zigbee energy house. Networks Update, 22 (10), 6-8.
Harvey, L. D. D. (2009). Reducing energy use in the buildings sector: Measures, costs, and examples. Energy Efficiency, 2 (2), 139-163.
Hill, A. (2012, October 21). What is an infrared sensor? Retrieved from http://www.wisegeek.com/ what-is-an-infrared-sensor.htm.
Hittinger, E., Mullins, K. A., & Azevedo, I. L. (2012). Electricity consumption and energy savings potential of video game consoles in the United States. Energy Efficiency , doi: 10.1007/s12053- 012-9152-z
Hu, Y., Jiang, Y., & Zhang, C. (2008). Energy saving control device based on double element pyroelectric infrared sensor. In proceeding of 2008 Control Conference (pp. 275-279). July 16-18, 2008, Kunming, China.
Joseph Technology (2011). Wireless energy meter: EZ-R series . Retrieved from http://www.joseph-tech.com.tw/products/products_ez_r.htm .
Kumaragurubaran, V. (2011). Sensing, actuating and processing in the built environment: A beginners guide to physical computing tools . Retrieved from http://quicksilver.be.washington.edu/courses/arch498cre/2.Readings/1.Manuals/Beginners%20Guide%20to%20Physical%20Computing.pdf .
Ma, Y. (2012). The design and application of intelligent electrical outlet for campus’s electricity saving and emission reduction. Journal of Computers, 7 (7), 1696-1703.
MarketsandMarkets (2011, March). Global intelligent building automation technologies: Systems services and information Technology market size and forecasts (2010-2015). Retrieved from http://www.marketsandmarkets.com/Market-Reports/building-technology-346.html .
McCain, D. (2011, June 1). Enabling Zigbee’s smart energy 2.0 with advanced wireless modules. Electronic Component News, 55 , S6-S8.
Moradi, M., Ghaisari, J., Askari, J., & Gorji, M. (2011, May). A new method for detection of a distributed event in wireless sensor networks. In H. S. Zadeh (Chair), 2011 19th Iranian Conference on Electrical Engineering (ICEE) . Symposium conducted at the meeting of IEEE. Tehran, Iran.
Pan, W.-F., Chien, M.-Y., Liu, C.-C., & Chan, K.-H. (2012). Feasibility analysis of improving the accessibility and security of nano-labs via Kinect. International Proceedings of Computer Science and Information Technology, 24 , 138-141.
Pan, W.-F., Chien, M.-Y., & Tu, S.-C. (2012, September). The feasibility assessment of using a Kinect-Tablet Integrated System to improve electric wheelchair reversing safety. Industrial Technology and Management, 49 , 121-125.
Pan, W.-F., Lin, H.-F., & Wu, M.-Y. (2011, July). Using Kinect to create active-learning situations for nanotechnology labs/classrooms. In Chin-Chen Chang (Ed.), 2011 3rd International Conference on Education Technology and Computer (pp. 54-56). Singapore: IACSIT press.
Pan, W.-F., Tu, S.-C., & Chien, M.-Y. (2012). Feasibility analysis of improving on-campus learning paths via a depth sensor. Interactive Learning Environments, iFirst , 1-24. doi: 10.1080/10494820.2012.682585
Rothe, S. B., & Girhepunje, V. G. (2012). Design and implementation of real time wireless biomedical system based on ZigBee-GSM interactive module. International Journal of Engineering Research and Applications, 2 (5), 1894-1899.
Sadineni, S. B., Madala, S., & Boehm, R. F. (2011). Passive building energy savings: A review of building envelope components. Renewable & Sustainable Energy Reviews, 15 (8), 3617-3631.
Shehabi, A., Masanet, E., Price, H., Horvath, A., & Nazaroff, W. W. (2011). Data center design and location: Consequences for electricity use and greenhouse-gas emissions. Building & Environment, 46 (5), 990-998.
Sober, J. (2011. October 6). Home energy management . Retrieved from http://www.acadtest.com/news/131795818315593200-home_energy_management.html .
Yamtraipat, N., Khedari, J., Hirunlabh, J., & Kunchornrat, J. (2006). Assessment of Thailand indoor set-point impact on energy consumption and environment. Energy Policy, 34 (7), 765-770.
ZigBee Alliance (2012). About: Our members . Retrieved from http://www.zigbee.org/About/OurMembers.aspx .