JTE v25n2 - Mathematics in Technology & Engineering Education: Judgments of Grade-Level Appropriateness
Mathematics in Technology & Engineering Education: Judgments of Grade-Level Appropriateness
Introduction
Persistent calls to eliminate the fragmentation of science, technology, engineering, and mathematics (STEM) education advocate for the realignment of the U. S. educational structure toward one that is standards-based and nationally coordinated (Presidents’ Council of Advisors on Science and Technology, 2012; National Science Board, 2007 ). Such coordination presupposes the capacity to vertically align STEM standards across grade levels and to horizontally connect these standards into integrated learning experiences at a single educational level. To achieve these horizontal and vertical connections, knowledgeable and inspired educators will be needed who both understand the essential concepts and standards of multiple disciplines and who can create symbiotic pathways that mutually enable students to meet standards of two of more disciplines.
Loepp (2004) judged that of the standards in science, technology and mathematics, “the mathematics standards have been the most useful for those who develop curricula” (p. 7). Furthermore, mathematics standards provide technology and engineering (TE) teachers and teacher educators with a framework to gauge alignment and promote coherence in school curriculum. However, it is not clear to what extent TE professionals—teachers, teacher educators, and curriculum developers—are able to use mathematics standards to infuse mathematics at a known grade level into TE curriculum. This study attempts to characterize the ability of TE professionals to identify the grade level of mathematics standards and of mathematics integrated into technology learning activities.
Background
Technology and engineering educators have long championed the infusion of mathematics into technology curriculum (e.g., Maley, 1987 ), especially to enhance TE learning goals and demonstrate “connections between technology and other fields of study” as specified in Standard 3 from the Standards for Technological Literacy from the International Technology Education Association ( ITEA, 2007 , renamed the International Technology & Engineering Educators Association, ITEEA). Notably, LaPorte and Sanders (1993) employed technological problem solving activities as a practical and motivating context for integrating mathematics (e.g., graphing, proportion, volume calculation, and unit conversion). Even difficult mathematical constructs, such as predictive analysis, have reportedly been, “better understood” by students when they were “connected to solving a problem or building an artifact” ( Merrill, Custer, Daugherty, Westrick, and Zeng, 2008 , p. 61). More recently, scholars have argued that engineering design is the appropriate context for integrating mathematics into technology curriculum ( Daugherty, Reese, & Merrill, 2010 ).
Merrill and Comerford (2004) and Litowitz (2009) urged TE educators to directly address mathematics standards from the National Council of Teachers of Mathematics ( NCTM, 2000 ) as they develop and implement curriculum. NCTM standards are divided into five mathematical content areas (number and operations, algebra, geometry, measurement, and data analysis and probability) and five process areas (problem solving, reasoning and proof, connections, communications, and representation). Similar to the Standards for Technological Literacy ( ITEA, 2007 ), each standard is further defined by sets of NCTM benchmarks, referred to as expectations. These 223 NCTM expectations indicate the achievement expectations for one of four grade levels, including P-2, 3-5, 6-8, and 9-12.
Several obstacles may hinder the horizontal and vertical infusion of mathematics in TE curriculum, such as the historical professional preparation of TE teachers, teachers’ knowledge of mathematics and standards, and numerous examples of below-grade mathematics in TE. McAlister’s (2005) examination of technology teacher preparation programs in the U.S. indicated the level of mathematics required in 24 (of 44) programs. He noted that “Project Lead The Way requires Teacher Education programs to require at least one course beyond College Algebra. Using that standard, 58% of the participating programs offer a level of mathematics to prepare them to effectively introduce pre-engineering concepts under the PLTW model” (p. 4). Only four of the 24 programs in McAlister’s study required undergraduates to study calculus. Furthermore, Gattie and Wicklein’s (2007) survey of inservice TE teachers suggests that that practicing TE teachers perceive both their “knowledge of mathematics” and their ability “to integrate appropriate levels of mathematics into instruction” as a professional development need (p. 13). This suggests that some practicing TE teachers may not be well-prepared to identify grade-appropriate mathematics.
Another obstacle may be that examples of TE literature and curriculum overemphasize below grade-level mathematics. For example, when taking work measurements, high school manufacturing students calculated the arithmetic average of work measurements to inform decisions about tool purchases, workstation design and production flow ( Rose, 2007a , p.10). Rather than high school level mathematics, calculating a mean fits the Grade 6-8 mathematics expectation: “find, use, and interpret measures of center and spread, including mean and interquartile range” ( NCTM, 2000 , p. 248). Including below-grade level mathematics in TE may promote transfer of knowledge and skills learned in mathematics lessons in previous years to technical contexts. But synergistic gains of grade-level integration are not realized if the mathematics is only or predominantly below grade level. Michael (1990) looked at junior high school students in physical science, concluding that “the most important variable for Physical Science success, aside from ability, is the LEVEL of mathematics studied” (Abstract).
Thus, there is a need for curriculum development and professional development initiatives to purposefully pursue strategies to infuse mathematics content at grade level within TE curriculum. Burghardt, Hecht, Russo, Lauckhardt, and Hacker (2010) did this when they examined the use of mathematical Knowledge and Skill Builders (KSB)—a series of short, focused tasks that reinforced middle school students’ conceptual knowledge of mathematics at their grade level—as part of a Bedroom Design challenge. Using a pre/posttest control group design, the KSB groups showed statistically significant higher mathematics knowledge scores than those who did not participate in the infused curriculum. Furthermore, Bottge, Grant, Stephens, & Rueda (2010) looked at fractional computation and procedural fluency for fractions with middle school students. They found that purposefully integrating grade-appropriate mathematics using enhanced anchored instruction into TE allowed “technology education teachers [to] make important contributions in helping students develop their computation and problem-solving skills” (p. 81). Both of these studies involved strong professional development for teachers prior to these teachers delivering mathematics-infused TE instruction.
Unanswered in the literature is the question of how accurately TE professionals identify the grade level of mathematics, either by identifying the grade level for an expectation in mathematics or by identifying the grade level of mathematics when it is contextualized in a TE student activity. Furthermore, how much of the mathematics in TE do these teachers recommend be below, at, or above grade level?
Methods
The purpose of this exploratory study was to characterize the accuracy of TE professionals─curriculum developers, teacher educators, state supervisors, and teachers─ in judging the grade-level of mathematics. An online survey was employed to address the following research questions:
- To what extent do TE professionals report being familiar with NCTM standards?
- Given an NCTM expectation, how accurately do TE professionals classify it by grade level?
- Given examples of mathematics in TE education, how accurately do TE professionals identify the mathematics grade level (per NCTM expectations)?
- Are there differences among TE professionals by role in terms of their ability to correctly classify NCTM expectations and mathematics in TE education?
This study was supported in part by a Research Incentive Grant from the Council on Technology Teacher Education. Professionals who develop TE curriculum or deliver either teacher education or professional development opportunities for preservice and practicing teachers may find this information valuable for informing programmatic decisions.
Instrument
A researcher-produced questionnaire included sections on demographics, familiarity with math standards and the teaching of mathematics in TE, NCTM expectations, and examples of mathematics integrated within TE activities. Fifteen expectations were randomly selected from the 3-5, 6-8, and 9-12 grade levels, three for each of the five NCTM content areas (process areas were omitted to provide a narrower focus). Respondents were asked to judge whether each item best fits in the Pre-Kindergarten-2, 3-5, 6-8, 9-12, or College level, thus allowing over- or under-estimation for any item by respondents. Preliminary examples of mathematics integrated into TE activities were adapted from the TE literature (the last five years of The Technology Teacher and Tech Directions magazines) and published curriculum ( Engineering byDesign ™). Working individually and with reference to NCTM (2000) , three practicing, licensed mathematics teachers read 30 examples of mathematics in TE activities and selected the NCTM expectation from across all grade levels best-matching the item. Fifteen items that received 100% agreement on the grade level were included on the final questionnaire, which served to validate this section. A readability test of the entire instrument with two TE educators informed revision.
Sampling
After Institutional Review Board approval, a snowball sampling strategy was used to recruit TE professionals. Initial calls for participation were distributed to the Council on Technology Teacher Education listserv, ITEEA Council of Supervisors, state TE associations, and Stem Connections , a digital newsletter for ITEEA members. The initial email asked recipients both to take the online survey and to distribute the call for participation through their own email distribution lists. The survey was open for three months in fall 2011.
Limitations
Being self-selected, this sample is likely to differ from the population of TE professionals regarding knowledge and opinions related to mathematics. No generalizations to this population are intended for what should be seen as an exploratory study.
In recent years, a newer set of secondary school standards referred to as Common Core standards was released in June of 2010 and has been adopted by 45 states (Common Core Standards Initiative, n.d.). Because teachers would not be expected to have much familiarity with these new standards at the time of the present study, a decision was made to use the NCTM standards.
Results
There were 168 usable surveys received from respondents who were located in 37 U. S. states. By professional role (Table 1), respondents were mostly high school teachers (38%), middle or junior high school teachers (23%), and teacher educators (19%.) The typical respondent was male (83.3%) with 15 years of teaching experience, and reported teaching one K-12 engineering course. Fifty-three percent of respondents reported having had four years of high school mathematics with an additional 13% having taken advanced placement (AP) mathematics in high school. During college, 67% had completed college algebra and 48% had completed calculus (Table 2).
| Respondents | Female | Years Teaching Experience | K-12 Engineering Courses Taught | |||||
|---|---|---|---|---|---|---|---|---|
| Role | n | % | n | % | Median | IQR | Median | IQR |
| Elementary | 2 | 1.2% | 2 | 100% | 3 | 2 | 0.5 | 1 |
| Middle/JH | 38 | 22.6% | 7 | 18.4% | 14.5 | 15.75 | 1 | 3 |
| High School | 64 | 38.1% | 10 | 15.6% | 14 | 15 | 2 | 3 |
| CTE | 13 | 7.7% | 3 | 23.1% | 10 | 13.5 | 2 | 3.25 |
| Teacher Educator | 32 | 19.0% | 2 | 6.3% | 19 | 20 | 0.5 | 2 |
| Supervisor | 15 | 8.9% | 2 | 13.3% | 14 | 11 | 2 | 4 |
| Curr. Developer | 2 | 1.2% | 1 | 50.0% | 27 | 4 | 2.5 | 5 |
| Other | 2 | 1.2% | 1 | 50.0% | 9.5 | 3 | 2 | 0 |
| TOTAL | 168 | 100% | 28 | 16.7% | 15 | 16 | 1.5 | 3 |
| None | General | College Algebra | Calculus | Statistics | |||||||
|---|---|---|---|---|---|---|---|---|---|---|---|
| Role | N | n | % | n | % | n | % | n | % | n | % |
| Elementary | 2 | 1 | 50 | 2 | 100 | ||||||
| Middle/JH | 38 | 1 | 3 | 15 | 39 | 25 | 66 | 15 | 39 | 19 | 50 |
| High School | 64 | 1 | 2 | 23 | 36 | 43 | 67 | 40 | 63 | 27 | 42 |
| CTE | 13 | 5 | 38 | 11 | 85 | 5 | 38 | 7 | 54 | ||
| Teacher Ed. | 32 | 1 | 3 | 8 | 25 | 20 | 63 | 12 | 38 | 23 | 72 |
| Supervisor | 15 | 5 | 33 | 10 | 67 | 7 | 47 | 8 | 53 | ||
| Curr. Developer | 2 | 1 | 50 | 1 | 50 | 2 | 100 | ||||
| Other | 2 | 1 | 50 | 1 | 50 | 1 | 50 | ||||
| TOTAL | 168 | 3 | 2 | 59 | 35 | 113 | 67 | 80 | 48 | 86 | 51 |
As shown in Table 3, respondents reported being “somewhat unfamiliar” (median=2) with the Principles and Standards for School Mathematics ( NCTM, 2008 ). With the exception of elementary teachers who had low participation, teacher educators reported greater familiarity with the NCTM standards than other roles. Overall, respondents reported that approximately 30.7% (mean) of the lessons they give in TE contain instruction in math with higher average reported by high school teachers (34.5%) than by other teachers.
| Reported NCTM Familiarity a | Instruction in T&E Lessons Contains Math b | Recommended Grade Level of Mathematics in TE c | |||||||
|---|---|---|---|---|---|---|---|---|---|
| Role | n | Median | IQR | n | % | SD | n | % | SD |
| Note . a Likert Scale of Reported Familiarity with 1=No Familiarity and 5=Extremely Familiar. b Percentage of the courses taught by the respondent that reportedly contain instruction on math. c The mean difference between the percentages of mathematics in TE recommended above grade level and below grade level. | |||||||||
| Elementary | 2 | 4 | 2 | 2 | 22.5 | 3.5 | 2 | -12.5 | 10.6 |
| Middle/JH | 38 | 2 | 2 | 38 | 27.1 | 24.7 | 32 | -12.6 | 29.9 |
| High School | 64 | 2 | 1.75 | 63 | 34.5 | 28.0 | 59 | -7.0 | 22.6 |
| CTE | 13 | 2 | 1.5 | 13 | 28.1 | 24.7 | 13 | -12.7 | 32.8 |
| Teacher Ed. | 31 | 3 | 3 | 31 | 26.9 | 24.7 | 32 | -12.7 | 6.5 |
| Supervisor | 15 | 2 | 2 | 15 | 35 | 24.7 | 13 | -4.6 | 17.7 |
| Curr. Developer | 2 | 2.5 | 3 | 2 | 47.5 | 38.9 | 2 | 25.0 | 21.2 |
| Other | 2 | 2 | 0 | 2 | 15.0 | 14.1 | 2 | 5.5 | 6.4 |
| TOTAL | 167 | 2 | 2 | 166 | 30.7 | 25.9 | 155 | -9.1 | 26.6 |
Respondents were asked, “What percentage of the mathematics in technology education should be below, at, or above the student’s current grade level?” Overall mean percentages were 25% recommended below-grade, 59% recommended at-grade, and 16% recommended above-grade. Subtracting the recommended percent below-grade from the recommended percent above-grade provides a variable for the net difference. The overall net difference was -9.1%, interpreted to mean that on average respondents suggested about 9% more math content should be below grade level than above grade level in TE. This indicates an approach that favors using TE to reinforce grade-level math, to a lesser extent to address below-grade level math, and to an even lesser extent to introduce higher level math.
A broad range of responses was received from the item asking: “What are the most complex mathematical concepts you teach in your technology and engineering classes?” Researchers coded all responses into the following mathematics topics: algebra (59.5%), general mathematics (49.4%), trigonometry (31.6%), geometry (28.5%), statistics (10.1%) and calculus (6.3%). Among these examples, 27.8% of the respondents offered examples that may be described as physical science principles without reference to the mathematics involved, including references to fluid dynamics, drag, Ohm’s Law, mechanics, and Boyle’s Law. This suggested a possible misunderstanding about the distinction between physics and mathematics.
Classifying Expectations
Respondents were asked to classify each of 15 NCTM expectations according to grade level (Table 4, continued on next page). The average accuracy of respondents for all items was 40.1% correct, with underestimates by one (21.7%), two (5.5%) and three grade levels (0.4%) nearly mirroring the overestimates by one (22.2%), two (9.0%), and three (1.2%) grade levels. Across the fifteen expectations, the average respondent had 1.47 more instances of overestimation by a grade level than underestimation.
| Grade Level | |||||||
|---|---|---|---|---|---|---|---|
| P-2 | 3-5 | 6-8 | 9-12 | 13+ | |||
| NCTM Expectations | Correct | f | f | f | f | f | |
| Note. a Grade level for each NCTM expectation. ↓ Net underestimation. ↑ Net overestimation. | |||||||
| Develop fluency in adding, subtracting, multiplying, and dividing whole numbers | 73.9% ↓ n=165 | 30 | 122 a | 10 | 3 | 0 | |
| Understand and represent translations, reflections, rotations, and dilations of objects in the plane by using sketches, coordinates, vectors, function notation, and matrices | 62% ↓ n=166 | 0 | 7 | 30 | 103 a | 26 | |
| Model and solve contextualized problems using various representations, such as graphs, tables, and equations | 53.6% ↓ n=166 | 2 | 25 | 89 a | 47 | 3 | |
| Use factors, multiples, prime factorization, and relatively prime numbers to solve problems | 51.8% ↓ n=166 | 3 | 55 | 86 a | 20 | 2 | |
| Solve simple problems involving rates and derived measurements for such attributes as velocity and density | 49.4% ↓ n=166 | 0 | 11 | 82 a | 72 | 1 | |
| Compute and interpret the expected value of random variables in simple cases | 44.6% ↓ n=166 | 1 | 20 | 58 | 74 a | 13 | |
| Understand such attributes as length, area, weight, volume and size of angle and select the appropriate type of unit for measuring each attribute | 42.1% ↓ n=167 | 9 | 72 a | 79 | 7 | 0 | |
| Develop fluency in operations with real numbers, vectors, and matrices, using mental computation or paper-and-pencil calculations for simple cases and technology for more complicated cases | 41.9% ↓ n=167 | 3 | 20 | 67 | 70 a | 7 | |
| Recognize and apply geometric ideas and relationships in areas outside the mathematics classroom, such as art, science, and everyday life | 36.4% ↓ n=165 | 26 | 52 | 60 a | 27 | 0 | |
| Discuss and understand the correspondence between data sets and their graphical representations, especially histograms, stem-and-leaf plots, box plots, and scatterplots | 34.1% ↓ n=167 | 1 | 14 | 57 a | 75 | 20 | |
| Use symbolic algebra to represent and explain mathematical relationships | 32.3% ↓ n=167 | 3 | 16 | 88 | 54 a | 6 | |
| Explore congruence and similarity | 31.1% ↓ n=167 | 25 | 52 a | 62 | 27 | 1 | |
| Analyze precision, accuracy, and approximate error in measurement situations | 30.4% ↓ n=168 | 3 | 42 | 71 | 51 a | 1 | 7 |
| Propose and justify conclusions and predictions that are based on data and design studies to further investigate the conclusions or predictions | 10.8% ↓ n=167 | 3 | 18 a | 47 | 77 | 21 | |
| Identify and describe situations with constant or varying rates of change and compare them | 6.6% ↓ n=167 | 3 | 11 a | 61 | 84 | 8 | |
There were five 9-12 expectations, all of which had net underestimation, as shown by the negative values in Table 5; four of the five 3-5 expectations were overestimated. All three expectations taken from the Numbers & Operations standard were underestimated. The Grade 3-5 expectations for Data Analysis and Probability and for Algebra were overestimated more than one grade range (i.e., as 9-12).
| Grade Level | |||
|---|---|---|---|
| 3-5 | 6-8 | 9-12 | |
| Standards Area | Mean | Mean | Mean |
| Numbers & Operations | -.103 | -.213 | -.665 |
| Algebra | +1.516 | +.142 | -.729 |
| Geometry | +.562 | -.465 | -.077 |
| Measurement | +.466 | +.387 | -.961 |
| Data Anal. & Probability | +1.581 | +.619 | -.523 |
As noted in Table 4, four expectations had over 50% correct classification by respondents. The highest accuracy for any item occurred for a Grade 3-5 expectation; 73.9% of respondents accurately classified “Develop fluency in adding, subtracting, multiplying, and dividing whole numbers.” The lowest accuracy occurred for a Grade 3-5 expectations; only 6.6% (n=11) of respondents accurately classified “Identify and describe situations with constant or varying rates of change and compare them across this same range” with most respondents overestimating by one (36.5%), two (50.3%) or three (4.8%) grade levels. The most commonly underestimated item was a Grade 9-12 expectation: “Analyze precision, accuracy, and approximate error in measurement situations.” This was accurately classified by 34% of respondents, but 69% underestimated grade level (by one (42.3%), two (25.0%), and three (1.8%) levels.
Level of Math in Technology & Engineering Activities
In the last portion of the survey, respondents were asked to classify 12 learning activities according to the highest grade level of math that would be used to complete the activity (Table 6). Each of these had been independently coded by three licensed mathematics teachers who consulted NCTM standards. Only items with unanimous agreement among coders were used, and the coders’ results are referred to as “correct.”
| Grade Level | ||||||
|---|---|---|---|---|---|---|
| Activity (many had illustrations) | Correct | P-2 | 3-5 | 6-8 | 9-12 | Col. |
| Note. a Grade level for the mathematics from coders using NCTM standards. ↓ Net underestimation. ↑ Net overestimation. | ||||||
| Find the impedance Z of a circuit with 20W of reactance XL represented by the vector diagram. | 74.3% ↓ n=167 | 0 | 1 | 18 | 124 a | 24 |
| A twin-engine airplane has a speed of 300 mi/h in still air. Suppose the airplane heads south and encounters a wind blowing 50 mi/h due east. What is the resultant speed of the airplane? To solve, find the sum of the vectors that represent the speed of the airplane and the speed of the wind. | 69.0% ↓ n=168 | 0 | 2 | 30 | 116 a | 20 |
| Now that you know your vehicle's time-trial speed, determine how far your vehicle would travel at that speed if it ran for one minute. | 62.5% ↓ n=168 | 1 | 30 | 105 a | 30 | 2 |
| Using a line graph, "students will determine the class of mathematical functions (linear, quadratic, or exponential) representing an aspect of technological change. | 55.1% ↓ n=167 | 1 | 13 | 52 | 92 a | 9 |
| As indicated in this bar chart, "how did the number of computer tomography (CT) scanners in the United States compare to the median number in the world in 2002? State as an approximate ratio. | 52.4% ↓ n=168 | 1 | 17 | 88 a | 56 | 6 |
| Working in teams, students produce a working radio-controlled watercraft….During the testing phase, students find the total mass of the boat (in grams), the density of the hull (D=M/V in g/ml), and the mass of the hull (calculate area and then displacement of the water). | 51.2% ↓ n=168 | 0 | 9 | 86 a | 69 | 4 |
| Multiple Choice: Americans recycle increasing amounts of waste through municipal waste collection. The table shows waste collection data for 2007. What is the probability that a sample of recycled waste is paper? A. 16%; B. 28%; C. 33%; D. 57%. | 44.9% ↓ n=167 | 3 | 20 | 67 | 70 a | 7 |
| To construct your tower, roll rectangular sheets of paper into cylinders to create structural members. | 42.8% ↓ n=166 | 28 | 71 a | 54 | 12 | 1 |
| A carpenter builds three boxes. One box uses 12 nails. The second box uses 6 nails and 6 screws. The third box uses 8 screws and 2 hinges. Nails cost $.04 each, screws cost $.06 each, and hinges cost $.12 each. 1. Write a matrix to show the number of each type of hardware in each box. 2. Write a matrix to show the cost of each type of hardware. 3. Find the matrix showing the cost of hardware for each box. | 33.3% ↓ n=167 | 1 | 27 | 80 | 56 a | 4 |
| After using a Boyle's Law apparatus or computer simulation to collect pressure and volume readings, students "create a graph from the data collected, with the 'y' axis being Volume and the 'x' axis being Pressure. | 8.9% ↓ n=167 | 0 | 15 a | 73 | 71 | 9 |
| Numerically Controlled (NC) Mill Problem: Engraving your Name. Step 1. Plot the first letter of your name on an x/y coordinate grid and label the coordinates of the key points. | 6.6% ↓ n=167 | 1 | 11 a | 83 | 68 | 4 |
| One step in completing the flexural test of a panel is to plot your findings on a data table. "Plot the weight (W) on the abscissa (x coordinate) and the sag (S) on the ordinate (y coordinate). | 6% ↓ n=168 | 0 | 10 a | 62 | 75 | 21 |
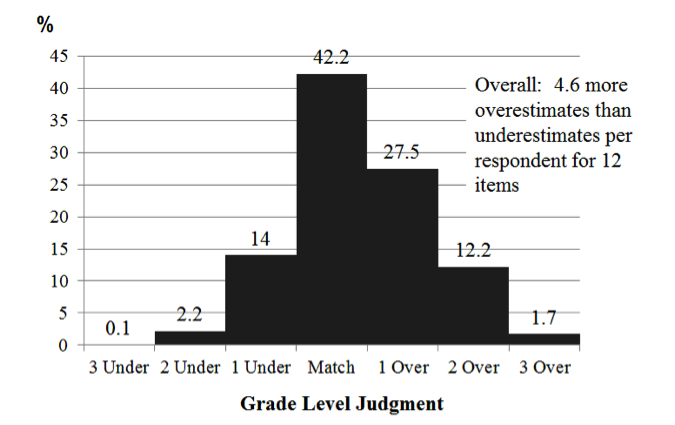
Overall, respondents classified 42.2% of the items correctly, i.e., at the same grade level as did the mathematics teachers (Figure 1). There was moderate net overestimation among respondents with an average of 4.6 more overestimates per person than underestimates. It should also be noted that less than 10% accuracy was shown for three items, all of which were coded at the Grade 3-5 level. As shown in Table 6, these three items required students to graph variables on a coordinate grid system. Furthermore, respondents overestimated the grade level of these three items by 1.4 to 1.6 grade levels on average.
Conclusions and Discussion
Successfully integrating mathematics into TE curriculum and instruction is a complex endeavor. It requires skilled TE teachers and curriculum designers who can strategically infuse mathematics content into compelling technology-based learning experiences. Mathematics standards provide a ready framework to guide teachers in coordinating their efforts with other STEM educators.
This exploratory study sought to describe the familiarity of TE professionals with the grade level of NCTM standards and of mathematics integrated into student learning activities. An online survey of TE professionals was completed by a convenience sample. These 168 respondents likely had a greater preparation in high school and college mathematics than the broader population with almost 50% reporting they had taken calculus. Thus, generalizing these results to the TE education community is not warranted. Few differences were found among professional roles of respondents (e.g., high school teachers, teacher educators).
Reported familiarity with NCTM standards was moderately low. This was also confirmed by the selection of College as a possible category for an NCTM expectation in some instances, even though they are P-12 expectations, and suggests a need for professional development in this area, thus supporting Gattie and Wicklein’s (2007) findings. Respondents accurately classified NCTM expectations by grade level about 40% of the time. Seven of fifteen expectations were consistently underestimated, and seven were consistently overestimated; there was slight, net overestimation. However, when mathematics was contextualized within TE student activities, the level of mathematics in the majority of items was overestimated compared to the grade level determined by coders using NCTM standards, which may have several explanations. First, in some instances, TE courses may have traditionally served non-college bound students, conditioning teachers to overestimate grade level. Second, there may be interference due to the more advanced level of the technical content. For example, a student activity involving a milling machine may not be classified as a 3-5 activity, and by association, any mathematics in that activity may also be deemed at the grade level of the technical content. Third, the vocabulary of mathematics may contribute to overestimation. For example, the term abscissa may be found in an activity that only calls for primary school mathematics, even though the word might not seem to be primary school level vocabulary. Respondents also indicated that an average of 9% more mathematics instruction within TE Underlying the issue of integrating mathematics into TE is the teacher’s uncertainty about the level of the mathematics to be integrated. It may be appropriate to integrate below-grade level math when encountering complex technical tasks because it relieves cognitive energies for the more complex tasks. Furthermore, situating mathematics within technical design and problem solving may improve a student’s ability to apply what they are learning in a new setting. The integration of at-grade level mathematics offers several advantages. The coordinated timing of mathematics across courses may enhance students’ retention, provide a less fragmented approach to schooling, and speed conceptual understanding. Above-grade level mathematics may by the trickiest as it can lead to frustrations and non-engagement by students. However, it can also serve to inspire, enrich, and motivate students to reach beyond their grade level.
This study looked at grade ranges . This obscures whether particular mathematics content has or has not yet been mastered by a particular student, which seems more pertinent in deciding whether the inclusion of mathematics in TE is and should be remedial, reinforcing, or enriching.
Recommendations
Much work remains to be done if TE professionals are to contribute consistently to students’ mathematics achievement. Given that teachers’ knowledge of mathematics and their knowledge of pedagogy have been shown to influence high-quality teaching and student learning ( Baumert, et al., 2010 ), TE teacher preparation programs and professional development should provide more extensive opportunities for both preservice and inservice teachers to develop mathematics knowledge and learn how to use effective strategies to teach mathematics that is embedded within the TE curriculum. Increasing TE teachers’ familiarity with mathematics standards at all grade levels may help to reduce the gap between their estimation of mathematics grade level and the actual grade level of that mathematics, and possibly increasing the coherence of the school curriculum and student achievement. As schools shift to Common Core or other standards, professional development initiatives should empower TE teachers to understand and use mathematics standards in designing, implementing, and evaluating their programs. For example, TE teachers may partner with math teachers to map the intersections of math concepts [and standards] within existing technical curriculum ( Stone, Alfeld, & Pearson, 2008 ). Because TE and mathematics teachers can have different understandings of key concepts ( Rose, 2007b ), this collaboration may help in reaching shared understandings that allow teams of teachers to work together to best enhance student achievement.
Teacher educators, providers of professional development, curriculum developers and authors should help preservice and inservice teachers to become acutely aware of the level of mathematics that is integrated into their TE instruction, by increasing their understanding of mathematics standards. Curriculum developers should be aware of a possible tendency among TE professionals to overestimate the grade level of mathematics and are advised to overtly identify the grade level of mathematics in integrated curriculum.
Given this exploratory study, future research characterizing TE professionals’ estimates of mathematics grade level are advised to use probabilistic sampling so that results could be generalized to the population. A future study could examine the conditions under which TE teachers learn how to select and integrate mathematics and other subject areas in their classrooms that is below, at, or above the grade of their students, perhaps by using the Common Core standards as an authority on grade level. While the present study looked at levels containing multiple grades (e.g., 9-12), an interesting issue for future research would be whether the mathematics represents something the student has learned, is learning, or has yet to learn in a mathematics course.
Jim Flowers ( jcflowers1@bsu.edu ) is Professor & Mary Annette Rose ( arose@bsu.edu ) is Associate Professor in the Department of Technology at Ball State University.
References
Baumert, J., Kunter, M., Blum, W., Brunner, M., Voss, T., Jordan, A., Klusmann, U., Krauss, S., Neubrand, M., & Tsai, Y.-M. (2010). Teachers’ mathematical knowledge, cognitive activation in the classroom, and student progress. American Educational Research Journal, 47 (1), 133-180.
Bottge, B. A., Grant, T. S., Stephens, A. C., & Rueda, E. (2010). Advancing the math skills of middle school students in technology education classrooms. NASSP Bulletin, 94 (2), 81-106.
Common Core Standards Initiative. (n.d.). In the states. Retrieved from http://www.corestandards.org/in-the-states
International Technology Education Association. (2007). Standards for technological literacy . Reston, VA: Author.
LaPorte, J. & Sanders, M. (1993). The T/S/M integration project. The Technology Teacher, 52 (6), 17-21.
Litowitz, L. S. (2009). Addressing mathematics literacy through technology, innovation, design, and engineering. The Technology Teacher, 69 (1), 19-22.
Maley, D. (1987). Integrating math and science into technology education. The Technology Teacher, 46 (8), 9-12.
McAlister, B. (2005, April). Are technology education teachers prepared to teach engineering design and analytical methods? Paper presented at the International Technology Education Association 67th Annual Conference, Kansas City, MO.
Merrill, C. & Comerford, M. (2004). Technology and mathematics standards: An integrated approach. The Technology Teacher, 64 (2), 8-12.
Merrill, C., Custer, R.L., Daugherty, J., Westrick, M., & Zeng, Y. (2008). Delivering core engineering concepts to secondary level students. Journal of Technology Education, 20 (1), 48-64.
Michael, J. (1990). The relationships of level of mathematics courses and junior high school physical science success (Doctoral dissertation, West Virginia University). Abstract retrieved from ProQuest Dissertations and Theses database. (303892405)
National Council of Teachers of Mathematics. (2000). Principles and standards for school mathematics. Reston, VA: Author.
National Science Board. (2007). National action plan for addressing the critical needs of the U.S. science, technology, engineering, and mathematics education system (NSB-07-114). National Science Foundation. Retrieved from http://www.nsf.gov/nsb/documents/2007/stem_action.pdf
Rose, M.A. (2007a). Work measurements: Interdisciplinary overlap in Manufacturing and Algebra I. The Technology Teacher, 66 (7), 6-11.
Rose, M. (2007b). Perceptions of technological literacy among science, technology, engineering, and mathematics leaders. Journal of Technology Education, 19 (1), 35-52.
Stone, III, J. R., Alfeld, C., & Pearson, D. (2008). Rigor and relevance: Enhancing high school students’ math skills through career and technical education. American Educational Research Journal, 45 (3), 767-795.