JVER v28n2 - Design and Evaluation of a Tool to Assess Strategical Information Processing Styles
Design and Evaluation of a Tool to Assess Strategical Information Processing Styles
Beverly A. Farrell
Our Lady of the Lake College
Joe W. Kotrlik
Louisiana State UniversityAbstract
Underpinned on the theories of individual differences and the information processing paradigm, the author hypothesized five different strategical information processing styles (SIPS): visuo-spatial, analytical, social, categorical, and verbal. An instrument was developed containing specific measurable descriptors for each of the five constructs. In this study, the empirical evidence verified only four SIPS: visuo-spatial, analytical, social, and categorical. The final instrument was evaluated using a sample of 514, which was split into two groups. A confirmatory factor analysis was performed on the first group to develop a model. The model was confirmed using the second group. The analysis of the final model revealed acceptable convergent and discriminate validities. The SIPS assessment provides a measure of the strategies that individual students prefer to employ when processing information. These individual strategies should prove to be useful assets in the dynamic workplace of the twenty-first century.
Introduction
The traditional learning style instruments measure how students learn by interacting with their environments. Although these instruments are widely accepted, many are based on early theories and have questionable reliability and validity. The goal of this research was to furnish educators with a high quality, easily administered self-assessment tool to determine individual differences in strategical information processing styles, which are a measure of the strategies that individuals use to process information transmitted by the senses.
In spite of the inundation of research in the area of individual differences in information processing, there are no simple, group self-assessments designed to measure strategical information processing styles. Most of the assessments are based on abilities rather than styles. There is a need in the educational system for a valid instrument that can be used easily and efficiently to determine a student's strategical information processing style. Educators could benefit from an assessment that would aid them in discerning individual differences in their students and planning program curricula accordingly. Students' awareness of their styles could enable them to perform better in the classroom, to become self-directed learners, and to succeed in the dynamic workplace. Thus, a valid, reliable instrument for appraising strategical information processing styles would be an asset for both educators and students ( Gagne, 1989 ).
In order to assist students in their educational quests, educators must be attuned to the individual differences in students' strategical information processing styles. The information processing paradigm consists of stages of input and transformation of information such as encoding, rehearsal, storage, and retrieval. Individual differences have been recognized in the processes of pattern recognition, rehearsal, working memory, memory encoding, memory search, declarative and procedural memory stores, self-schemata, and retrieval ( Gagné, 1989 ). Researchers have been unable to establish a correlation between general intelligence or general knowledge and the cognitive abilities such as the speed of information processing and working memory capacity ( Sternberg, 1997 ; Shepard, Fasko, & Osborne, 1999 ). Perhaps a student's strategical information processing style could provide a link between general intelligence, general knowledge, and cognitive abilities. Regardless of cognitive abilities, general intelligence, or general knowledge, an undergraduate college student's success seems to depend on his/her strategical information processing style or his/her preferred method of utilizing his/her cognitive resources ( Sternberg, 1997 ). Therefore, awareness of a student's style would enable educators to design educational experiences that tap into the student's cognitive resources.
Once a student is aware of his/her information processing style, he/she is better able to evaluate his/her learning abilities, to improve classroom performance, to become a self-directed learner, and to be successful in the workplace. General knowledge such as measured by standardized test scores can sometimes predict academic success but it cannot always predict how well an individual will perform as a learner or in the work environment. Success in the classroom and the workplace requires more than high performance on standardized tests. Generally, college students are considered successful in the classroom and after graduation in the workplace if they possess motivation, self-efficacy, and self-esteem ( Shepard, Fasko, & Osborne, 1999 ). These graduates have the ability to adapt to the real world environment and to accomplish goals. They have a repertoire of cognitive strategies that they skillfully employ in a workplace setting ( Sternberg & Kaufman, 1998 ). A college student's cognitive style is influenced by his/her cognitive abilities, repertoire of cognitive strategies, learning style, general intelligence, and general knowledge. However, the student's success depends on how he/she chooses to employ these resources. His/her choice is influenced by motivation, self-efficacy, self-esteem, and emotional intelligence ( Averill, 1999 ). Thus a student's classroom and workplace success are influenced by individual differences, which can be measured by the SIPS instrument.
Theoretical Framework
Underpinned on Craik and Lockhart's (1972) information processing theory, Baddeley and Hitch's 1974 model of working memory (as cited in Baddeley & Hitch, 1977 ), and Torgesen's Model (1996) of the information processing system, the researcher hypothesized that there are five different strategical information processing styles (SIPS) that individuals prefer to use when processing information. Based on experience and an extensive literature review, the researcher hypothesized that the SIPS model was composed of five constructs: visuo-spatial, analytical, social, categorical, and verbal. In order to validate this hypothesis, the researcher developed an instrument to measure these five constructs. The researcher modified Torgesen's Information Processing Model ( 1996 ) to include the five styles as part of the information processing system. Each style depends on the systems within working memory that the individual prefers to use when processing a stimulus.
The SIPS are identified in Figure 1 in the shaded boxes. The shaded boxes containing the terms visuo-spatial, analytical, social, categorical and verbal were added to Torgesen's original model to form the SIPS model. The model illustrates the relationships among the five strategical styles and the elements of the information processing system.
Figure 1 . Hypothesized Model of the Five Strategical Information Processing Styles (SIPS)
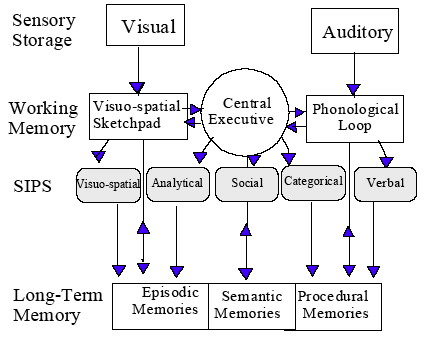
Visuo-spatial style . Visuo-spatial processors selectively attend to the global characteristics of stimuli that involve imagery. These tasks sustain the attention of the visuo-spatial processors enabling them to arrive at accurate solutions. Individuals who are visuo-spatial processors prefer to use their visuo-spatial sketchpads to encode information for short and long-term memory storage. However, they are good strategists and are able to select the best strategy for the task ( Roberts, Gilmore, & Wood, 1997 ). They are parallel, continuous processors. Visuo-spatial processors encode information simultaneously and they can store it in continuous networks ( Clark & Paivio, 1991 ; Massaro & Cowan, 1993 ). Visuo-spatial individuals are continuous processors who make decisions based on a small amount of information. They have a well-developed procedural memory and referential connections ( Paivio, 1991 ; Tulving, 1993 ).
Analytical style . Analytical processors selectively attend to stimuli that are presented in a logical order. When tasks make sense and require logical thinking, they sustain the attention of the analytical processor. Analytical processors prefer to use their executive function to do quick mental calculations and perform tasks requiring analytical reasoning. Their emotions have very little influence on their executive function and analytical processors rely heavily on analytical strategies to solve problems. They are serial discrete processors who encode information in a logical stepby- step fashion ( Rotenbery & Weinberg, 1999 ). As discrete processors, they store information in discrete packages until they have what they need to make a carefully calculated decision ( Clark & Paivio, 1991 ; Massaro & Cowan, 1993 ). They have welldeveloped procedural and semantic memories ( Tulving, 1993 ).
Social style . Social processors selectively attend to global stimuli that involve relationships and emotions. Group and social tasks sustain the attention of the social processor. Their executive function is strongly influenced by the limbic system. As a result of this influence, social processors encode information for short and long-term memory storage with emotional connections. As emotionally creative individuals, they are able to evaluate their own emotions as well as those of others. They have the ability to express emotions appropriately and can express their own perceptions of a situation through emotions ( Averill, 1999 ). Social processors are adept at solving complex emotional problems. They are parallel continuous processors who encode and store information simultaneously ( Clark & Paivio, 1991 ; Massaro & Cowan, 1993 ). They have well-developed episodic autobiographical memories ( Gathercole, 1998 ; Sehulster, 1995 ; Tulving, 1993 ).
Categorical style . Categorical processors selectively attend to the detailed characteristics of either visual or verbal stimuli. These individuals are attentive to tasks that require detailed, organized strategies. Individuals who are categorical processors prefer to use their executive function to plan, set goals, select strategies, and evaluate and revise their plans. They have a large repertoire of organization strategies that they use to encode and retrieve information. As serial, discrete processors, they encode information in a linear, organized manner and they reorganize their semantic memory as they encounter new stimuli. Similar to the verbal processors, they store information in discrete packages until they have what they need to make a decision or to reorganize their stores ( Clark & Paivio, 1991 ; Massaro & Cowan, 1993 ).
Verbal style . Verbal processors selectively attend to stimuli that involve lexical and semantic tasks. Lexical and semantic tasks sustain their attention. Individuals who are verbal processors prefer to use their phonological loops to encode information for short and long-term memory storages and rely on verbal strategies to learn new information and to solve problems. They are serial discrete processors ( Rotenbery & Weinberg, 1999 ). They encode information one word at a time and they store it in discrete packages until they have what they need to make a decision ( Clark & Paivio, 1991 ; Massaro & Cowan, 1993 ; Sanders, 1990 ). These individuals have large semantic and episodic memories ( Sehulster, 1995 ; Tulving, 1993 ).
Literature Review
The purpose of this literature review was to identify stages in the information processing paradigm that are affected by individual differences in students and to apply this knowledge to the development of a strategical information processing style assessment. Educators could use such an assessment to predict and improve their students' academic performance. According to Jacobson (1998) , "… the current education system is in dire need of modification in order to keep pace with current technological advancement of society. As educators, we must consider the research and create an educational system that will meet the needs of a progressive society" (p. 579).
This literature review aspired to bridge research from the fields of cognitive psychology, neuropsychology, and educational psychology to the field of education. Using a reductionist approach, the first step in this endeavor was to review the theoretical foundation of the information processing paradigm that originated with the cognitive psychologists ( Baddeley, 1993 ; Broadbent, 1958 ). Synchronously, the author will present research findings from the fields of neuropsychology ( Posner & Raichle, 1994 ) and educational psychology ( Bonner, 1988 ; Kalyuga, Chandler & Sweller, 1998) . Cognitive psychologists postulate how the information processing system functions, the neuropsychologists attempt to identify the neurological structures that are responsible for these functions, and the educational psychologists attempt to discover ways to improve these functions in students. Researchers in all of these fields have identified areas of individual differences in the information processing system. The application of this empirical data to the area of education can assist educators in identify and evaluating individual differences in their students. Educators can use assessments of individual differences to improve the student's academic performance ( Paivio, 1991 ).
The information processing system theory ( Craik & Lockhart, 1972 ), which is the nucleus of cognitive psychology, explains how individuals receive and process information for memory encoding, rehearsal, storage, and retrieval. The theory includes the senses, the sensory registers, short-term (working) memory, and long-term memory. The senses are important as information receptors. They receive stimuli from the environment. Not all stimuli received are processed--some of them are lost or discarded. Information that is not discarded enters the sensory registers and is transmitted as discrete or continuous transmissions ( Massaro & Cowan, 1993 ). Sanders (1990) posited that discrete transmissions require serial processing and continuous transmissions involve parallel processing. Serial processing occurs when one item is handled at a time and parallel processing involves handling multiple items at one time ( Clark & Paivio, 1991 ; Massaro & Cowan, 1993 ).
The sensory registers are like collection bins. As the information enters the sensory registers, some of the data moves into short-term memory and some is discarded. From the sensory registers, information travels to working memory ( Blanton, 1998 ; Craik & Lockhart, 1972 ; Parker, 1993 ). Working memory has a small capacity and processes a limited amount of information ( Baddeley, 1992 , 1993 , 1996 ; Broadbent, 1958 ; Craik & Lockhart, 1972 ; Kalyuga, Chandler, & Sweller, 1998 ; Parker, 1993 ). Working memory is composed of three systems: the executive control, the phonological loop, and the visuo-spatial sketchpad ( Baddeley, 1992 , 1993 , 1996 ). Once in working memory, the information is processed. It is connected to information stored in longterm memory, rehearsed, or discarded. Information that receives attention and that is meaningful is encoded for storage in long-term memory. Long-term memory has an unlimited capacity. Once information is stored in long-term memory, it is there permanently ( Craik & Lockhart, 1972 ; Parker, 1993 ; Tulving, 1993 ). However, it must be retrieved into working memory for processing ( Baddeley, 1992 , 1993 ; Broadbent, 1958 ; Massaro & Cowan, 1993 ; Torgesen, 1996 ). Craik and Lockhart (1972) posited that the format of information in long-term is largely semantic. Parker (1993) contended that items are encoded in memory as words or pictures. The researchers agreed that long-term memory has no known limit or capacity and that information is never lost; however, over time the accessibility to the information is lost ( Craik & Lockhart, 1972 ; Parker, 1993 ). Teaching strategies can serve as cues that enhance retrieval or accessibility to stored items ( Parker, 1993 ).
Purpose
An extensive literature review revealed that there were no existing instruments designed to measure information processing styles as proposed in this research. Therefore, the purpose of this study was to develop an instrument with demonstrated reliability and validity that will assess strategical information processing styles of undergraduate college students. The researcher theorized that there were five different strategical styles that were based on individual differences in the information-processing paradigm. The objectives of the study were to (1) develop a self-assessment instrument with demonstrated validity and reliability that measured the strength of preference of strategical information processing in each of the following five styles: visuo-spatial, analytical, social, categorical, and verbal and (2) describe the sample of undergraduate students employed in this study on the selected demographic characteristics of age, gender, ethnicity, credit hours completed, and college major.
Method
Population
The population used in this study consisted of students enrolled at Our Lady of the Lake College (OLOL College) and Louisiana State University (LSU). The researcher collected data from a convenient sample of 514 undergraduate students. The mean age of the students in the final sample was 19.7 years ( SD =3.72), the youngest student was 18-years old and oldest student was 57-years old. The majority of undergraduate students who participated in this study were females ( n = 300 or 58.4%). The majority of the students designed their ethnic background as White ( n = 395 or 76.8%). Other ethnic categories indicated by the students were Black or African American ( n = 69 or 13.4%), Asian ( n =21 or 4.1%), Hispanic ( n = 14 or 2.7%), Native American ( n = 2 or .4%), and other ( n = 10 or 1.9%). Three students (.6%) did not designate any ethnic origin. The numbers of majors in each category were: Business ( n = 53 or 10.3 %), Arts and Sciences ( n =266 or 44%), Medical Sciences ( n = 46 or 8.9%), Agriculture ( n = 15 or 2.9%), Engineering ( n = 48 or 9.3%), Communication ( n = 28 or 5.4%), Design and Music ( n = 18 or 3.5%), Education ( n = 47 or 9.1%), undecided ( n = 26 or 5.1%), and no response ( n = 7 or 1.4).
The mean for the number of credit hours completed by the undergraduates in the student sample was 43.7 (SD = 38.2). The number of credit hours ranged from 0 - 210. The majority of the students in the study completed 26 or fewer credit hours.
Instrumentation
In the first SIPS instrument used in this research, there were 20 indicators in each data set or 100 variables. Each data set was designed to measure an individual construct. Using the data from a pilot study and three field studies, the researcher revised the SIPS instrument for the final data collection. The final instrument contained 65 variables and employed an absolute ranking scale. The instrument consisted of 13 questions and each question had five possible solutions. Based on the statistical findings of the three field studies, the situations and the solution items composing the instrument were modified to evaluate individual differences in the four strategical processing of information styles. For example, individuals who prefer to use the visuospatial SIPS are parallel, continuous processors and rank solutions that involve learning by using imagery higher than other items. Students who prefer to use the categorical information processing style chose items that involve linear processing such as solutions using outlines to summarize information. Analytical processors select solutions that involve planning and details since they are serial linear processors. Given the following situation: "When I act on the lecture information given in one of my courses, I", the analytical processors would rank the following solution as most often preferred: ' take detailed notes.' The visuo-spatial processors would rank 'use pictures to illustrate the information' as the most preferred and the categorical processors would rank 'outline the information' as the most preferred solution.
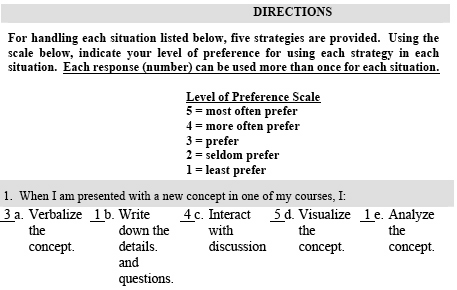
The respondents were required to rate each solution item from least preferred to most preferred. The respondents ranked their five choices by using a 1 (least prefer), 2 (seldom prefer), 3 (prefer), 4 (more often prefer), and 5 (most often prefer). To ensure an absolute data scale, the researcher stated the directions as follows: "Each response (number) can be used more than once for each situation." The example question in Figure 2 illustrates how each question was designed. The directions for completing the questionnaire and example responses are also illustrated in Figure 2.
Figure 2 . An Illustration of a Strategical Information Processing Style Query Using the Absolute Scale.
Data Collection
The empirical data collected in this study indicated that there were four rather than five strategical information processing styles. The four strategical informationprocessing styles verified by experimental data are visuo-spatial, analytical, social, and categorical. The variables designed to indicate the verbal style did not prove to be statistically valid. Thus the variables in the final SIPS instrument were revised to measure four rather than five constructs.
The number of observations required in each sample group was determined using a five to one ratio of individuals in the sample to variables in the instrument ( Hair, J. F., Anderson R. E., Tatham, R. L., & Black, W. C., 1998 ; Hatcher, 1994 ; Kerlinger & Lee, 2000 ). As a result of the third field test, the number of items in the instrument was reduced to 65. The sample size of the final data collection was 514 and larger than the 325 necessary to validate the 65 items in the instrument. Therefore, the sample was randomly split into two groups. The first group contained the necessary 325 participants and the second group contained the remaining 189, which was enough observations to validate the final model containing only 22 items.
A confirmatory factor analysis (CFA) was performed on the data from group one in order to formulate a theoretical model. The model was then confirmed via a second confirmatory factor analysis using the data from the sample containing 189 students.
Analysis
The SAS system's PROC CALIS procedure described in Hatcher (1998) was used to analyze the data. The models tested were composed of four latent variables or constructs and multiple indicator variables. A two-step process was used to accomplish the analyses. First, a measurement model was generated using confirmatory factor analysis. Then the model was modified using the criteria outlined by Hatcher (1994) . The procedure involves deleting insignificant variables, variables with high-normalized residuals, and problematic variables. Once the measurement model revealed an acceptable fit to the data, it was changed so that it represented the theoretical model. Finally, the measurement model and the theoretical model were compared for goodnessof- fit and parsimony ( Hatcher, 1994 ).
Measurement model . The measurement model describes the nature of the relationship between the constructs (latent variables) and the indicator variables that measure the constructs. The model presented in this study contained four constructs: visuo-spatial, analytical, social, and categorical. A minimum of three indicator variables was used to measure each construct ( Hatcher, 1994 ).
The structure of the original measurement model was modified by deleting variables with insignificant factor loadings, variables with high normalized residuals, and variables indicated to be problematic by the Lagrange Multiplier and Wald test modification indices. According to Hatcher (1994) , insignificant variables are those with the absolute value of the t statistic for factor loadings less than 1.96 ( p <. 05). The null hypothesis states that the relationship between each variable and its construct is zero. All variables with t statistics below 1.96 or low standardized factor loadings were eliminated from the model.
After eliminating the insignificant variables, the researcher examined the normalized residuals to determine which variables had residuals that were outside of the acceptable limits. Hair et al. (1998) contends that the acceptable limit for residuals is ± 2.58 standard deviations. Since a sample of 325 was used for this study, 16 residuals may exceed ± 2.58 standard deviations (95% is one out of 20 observations) strictly by chance. Variables with high residuals were eliminated from the model. Nine residuals in the model were outside of the acceptable limits indicating that the distribution of normalized residuals was symmetrical. Kerlinger and Lee (2000) contend that the smaller the residuals, the better the data fits to the model.
The Lagrange Multiplier test was used to evaluate the decrease in chi-square that would occur by adding a new path to the model. The variables with high Lagrange values on two factors were eliminated because the theoretical model does not account for indicator variables to measure more than one latent variable ( Hatcher, 1994 ).
The Wald test identifies unimportant paths or covariances that can be eliminated without affecting the chi-square significantly. Most of the problematic variables identified by the Wald test results also had insignificant or low standardized factor loadings ( Hatcher, 1994 ). These variables were automatically dropped from the model. The original model contained 65 indicator variables. However, modification of this model resulted in a revised model containing 22 variables. According to Hatcher (1994) , one of the necessary conditions for confirmatory factor analysis is that the model contains "a maximum of 20 - 30 indicator variables" (p. 260).
The problematic variables were eliminated from the model one variable at a time. Each time a variable was eliminated, the model was reconfigured. Once all of the problematic variables were eliminated, the model was evaluated for reliability, validity, and goodness-of-fit. The composite reliabilities for the factors were determined. This index indicates the internal consistency of the variables measuring a given construct and is parallel to the coefficient alpha ( Hair et al., 1998 ; Hatcher, 1994) . The composite reliabilities were: visuo-spatial .72, analytical .73, social .75, and categorical .78. All of the values were greater than .60 and were within acceptable limits ( Hatcher, 1994 ).
Convergent validity was determined using the standardized factor loadings for each remaining variable and the t statistic. Significant t -tests and factor loadings illustrated that the indicator variables were actively appraising the designated construct. The ranges of the factor loadings for the latent constructs and their indicator variables were: visuo-spatial .407 to .751, analytical .390 to .751, social .420 to .834, and categorical .392 to .797. The ranges of the t values were all highly significant: visuo-spatial 6.85 to 10.84, analytical 6.41 to 13.65, social 7.14 to 15.85, and categorical 7.36 to 15.75.
The discriminant validity of the model was determined by reviewing the covariance between the pairs of constructs. An examination of the covariances among exogenous variables (latent constructs) revealed that none of the confidence intervals between constructs include 1.0; therefore, the correlation between the constructs was weak and discriminant validity is demonstrated ( Hatcher, 1994 ). The covariances among the exogenous variables are summarized in Table 1.
Table 1
Covariance among Exogenous Variables
Standard Confidence Parameter Estimate Error Intervals t a
Visuo-spatial/Analytical .085 .076 -.067 to .237 1.12 Visuo-spatial/Social -.015 .074 -.163 to .133 -0.21 Visuo-spatial/Categorical -.181 .071 -.323 to -.039 -2.54 Analytical/Social -.308 .065 -.438 to -.178 -4.71 Analytical/Categorical .439 .059 .321 to .557 7.41 Social/Categorical -.253 .064 -.381 to -.125 -3.94
a t -tests verify that the relationship between the variables is zero. For the t -test to be significant, the confidence interval must include 1.0 ( Hatcher, 1994 ).
After determining the reliability and validity of the model, the next step was to ascertain the goodness-of-fit of the model. Evaluating the overall goodness-of-fit of the model involved determining the absolute fit of the model, the incremental fit, and the parsimony. The absolute fit of the model is the degree to which the covariance matrix is predicted by the structural and measurement models ( Hair et al., 1998 ). Indices used to evaluate the absolute fit of the model are the chi-square, the normed chi-square, and the Goodness of Fit Index ( GFI ). The chi-square for the model was Χ 2 (203, n = 325) = 365.7, p < .0001. The normed chi-square, which is the ratio between chi-square and the degrees of freedom, was 1.80. According to Hatcher (1994) , the p values for the chisquare test should be greater than .05 and the ratio of chi-square/ df should be less than 2. However, Hatcher (1994) contends that the chi-square/ df ratio is affected by sample size and that the ratios for a model can vary based on sample size. Data sets containing more than 20 to 30 variables produce large chi-square values and result in a ratio that is greater than 2 indicating a lack of fit of the model and the data ( Hatcher, 1994 ).
The other index that can be used to measure absolute fit is the GFI . The GFI is not dependent on sample size and is a comparison of the estimated residuals squared to the actual data. According to Hair et al. (1998) , there is no threshold level for this value, although higher is better. The GFI for the measurement model was .911 and is listed in Table 2.
Table 2
The Goodness-of-fit and Parsimony Indices of the Combined Models
Model Χ 2 df GFI CFI NNFI PR PNFI
Null 1772.5 231 Theoretical 362.49 207 .910 .899 .887 .896 .713 Measurement 365.70 203 .911 .900 .887 .879 .702
Note . GFI is the goodness of fit index; CFI is the Bentler Comparative Fit Index; NNFI is the Bentler & Bonett (1980) Non-normed Index; the PR is the parsimony ratio of the df of the Model divided by the df of the Null; and the PNFI is the James, Mulaik, & Brett (1982) Parsimonious Index.
The indices that are used to measure the incremental fit of the model are the Bentler Comparative Fit Index ( CFI ) and the Bentler & Bonett (1980) Non-normed Index ( NNFI ). The incremental fit of the model compares the model to the null model. For the measurement model, the CFI was .900 and the NNFI was .887. These values were equal or close to the desirable value of .90 and indicated an acceptable fit ( Hair et al., 1998 ; Hatcher, 1994 ) and are listed in Table 2.
Next, the parsimony of the measurement model was tested using the parsimony ratio ( PR ) and the parsimonious normed-fit index ( PNFI ). These indices signify the simplicity and the fit of the overall model. The PR value is determined by dividing the degrees of freedom of the model of interest by the degrees of freedom of the null model. According to the null model, there are no relationships between any of the variables. The PR of the model was .879 and the PNFI was .702. The higher the value for the PR , the greater is the parsimony of the model. According to Hatcher (1994) , the larger the PNFI the more acceptable the data and the minimum acceptable values are between .50 and .60. The PR and PNFI are listed in Table 2.
Theoretical model . The theoretical mode is a combined model that consists of the measurement model and a structural model. The measurement model examines the constructs and the indicator variables that successfully measure these constructs. The structural model examines the relationships between the constructs themselves. The theoretical model is the same as the revised measurement model. Except in the theoretical model, the parameters of the variables with the highest factor loadings for each construct are fixed at one to ensure that the indicator variables best represent the construct. The construct is an unobserved variable and it has no established unit of measurement. "However, by fixing at one the path from the F variable to one of its manifest indicators, the unit of measurement for the F variable becomes equal to the unit of measurement for that indicator variable (minus its error term)" ( Hatcher, 1994 , p. 357).
Thus parameters for variables 9d (visuo-spatial), 7c (analytical), 4d (social), and 1b (categorical) were all set at 1.0. No other changes were made in the model. Table 2 summarizes the goodness-of-fit parameters for the theoretical model. The values of the CFI (.899), the NNFI (.887), and the GFI (.910) were acceptable ( Fletcher, David, Stuebin, Shaywitz, Shaywitz, Shankweiler, Katz, & Morris, 1996 ; Hair et al., 1998 ; Hatcher, 1994 ; Barry Moser, personal communication March, 2001).
The chi-square difference test, which is determined by subtracting the chi-squares of the two models, was used to evaluate the validity of the theoretical model by comparing this model to the measurement model. If there is no significant difference between the two models, then the observed relationships between the constructs is successfully illustrated in the theoretical model. The chi-square for the measurement model was subtracted from the chi-square for the theoretical model: 365.70 - 362.49 = 3.21. The degrees of freedom for the difference tests were determined by subtracting the degrees of freedom of the models: 207 - 203 = 4. The critical value for chi-square at 4 degrees of freedom was 9.49 ( p = < .05). Therefore, the theoretical model was effective in justifying the relationships between the constructs. The theoretical model provided a fit to the data that was the same as the measurement model ( Hatcher, 1994 ).
Findings
Confirmatory Factor Analysis of the Model . The theoretical model developed using the sample of 325 was confirmed using the final sample of 189. Twenty-two indicator variables and four latent constructs composed the final model. Thus a sample of 189 was adequate to maintain the five to one ratio of samples collected to variables in the instrument ( Hair et al., 1998 ; Hatcher, 1994 ). No modifications were made to this final measurement model (see Figure 3).
Figure 3 . The Measurement Model for the Final SIPS Instrument
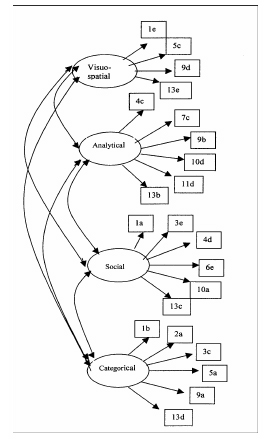
Following the same procedure used in the confirmatory factor analysis of data from the sample of 325, the researcher determined the reliability and validity of the final model. The composite reliabilities ranged from visuo-spatial .60, analytical .75, social .80, and categorical .81. The reliability for the visuo-spatial construct was low but within acceptable limits ( Hatcher, 1994 ). The reliabilities for the analytical, social, and categorical constructs were all acceptable. The convergent validity of the model was acceptable and was determined by examining the standardized factor loadings and the t -tests. The ranges for the standardized factor loadings for each construct were: visuospatial .342 to .695, analytical .407 to .744, social .512 to .706, and categorical .463 to .795. All of the t -tests were significant ( p < .05) and ranged by construct as follows: visuo-spatial 3.81 to 7.11, analytical 5.2 - 10.53, social 5.12 to 9.99, and categorical 6.22 to 12.15.
The discriminant validity of the model was acceptable and is illustrated in Table 3. The covariance between the constructs was very weak. The highest covariance was between analytical and categorical. However, a quick determination of the confidence interval between the two constructs revealed that the interval did not include 1.0. According to Hatcher (1994) , if the confidence interval does not include 1.0 then "… it is very unlikely that the actual population correlation between F1 (any two factors) and F5 is 1.0" (p. 339). Therefore, the analytical construct did not measure categorical data.
The goodness-of-fit indices and the parsimony indices for the measurement and theoretical models are listed in Table 4. The absolute fit of the measurement model was acceptable with a Χ 2 (203, n = 189) = 366.48, p < .0001, a normed chi-square value of < 2.0, and a GFI of .852. The incremental fit of the model was marginally acceptable with a CFI of .850 and a NNFI of .824. The parsimony of the model was acceptable, since the PR was .879 and the PNFI was .629.
Table 3
Covariance Among Exogenous Variables
Standard Confidence Parameter Estimate Error Intervals t a
Visuo-spatial/Analytical -.394 .096 -.586 to -.202 -4.10 Visuo-spatial/Social .041 .103 -.165 to .247 0.39 Visuo-spatial/Categorical -.304 .095 -.494 to -.114 -3.19 Analytical/Social -.285 .087 -.459 to -.111 -3.28 Analytical/Categorical .543 .067 .409 to .668 7.79 Social/Categorical -.098 .088 -.274 to .078 -1.12
a The t -tests verify that the relationship between the variables is zero. For the t -test to be significant, the confidence interval must include 1.0 ( Hatcher, 1994 ).
The chi-square of the theoretical model was Χ 2 (207, n = 189) = 368.70, p < .0001, the normed chi-squared was < 2.0, and the GFI was .851 indicating an acceptable absolute fit of the data to the theoretical model. The incremental fit of the model was marginally acceptable with a CFI of .847 and a NNFI of .830. Both of the parsimony indices were within acceptable limits ( PR = .896 and PNFI = .640). The indices for the measurement and theoretical models are also listed in Table 4.
Table 4
The Goodness-of-fit and Parsimony Indices of the Combined Models
Model Χ 2 df GFI CFI NNFI PR PNFI
Null 1289.6 231 Theoretical 368.70 207 .851 .847 .830 .896 .640 Measurement 366.48 203 .852 .850 .824 .879 .629
Note . GFI is the goodness of fit index; CFI is the Bentler's Comparative Fit Index; NNFI is the Bentler & Bonett's (1980) Non-normed Index; the PR is the parsimony ratio of the df of the Model divided by the df of the Null; and the PNFI is the James, Mulaik, & Brett (1982) Parsimonious Index.
The chi-square difference test, comparing the theoretical model fit to the measurement model fit, was 368.70 - 366.48 = 2.22. At 4 degrees of freedom, the critical value of chi-square at p < .05 is 9.4877. Thus the chi-square was not significant at p < .05 and the theoretical model validly accounted for the relationship between the latent variables in the model.
Summary and Conclusions
In order to achieve the purpose and the objectives of this study, the researcher developed an instrument to measure individual differences in preferred strategical information-processing styles. Originally, the researcher theorized that there were five information-processing styles: visuo-spatial, analytical, social, categorical, and verbal. However, as the study progressed empirical data validated only four informationprocessing styles: visuo-spatial, analytical, social, and categorical. Although the verbal style is theoretically appealing ( Baddeley, 1993 ; Logie, 1999 ; Posner & Raichle, 1993 ; Torgesen, 1996 ), the indicator variables designed to measure this style did not load significantly on a common construct. Therefore, the final instrument design excluded indicators for the verbal style. According to Nicholls and Wood (1998) , word recognition takes place in both hemispheres of the brain. Perhaps, this explains why the verbal indicator variables loaded indiscriminately on the other four constructs.
The final sample of 514 participants was randomly split and a confirmatory factor analysis was performed on each group. A confirmatory factor analysis was performed on the data from group one ( n = 325) in order to formulate a model. The model was then confirmed via a second confirmatory factor analysis using the data from the sample containing 189 participants. The model developed using the first data set was confirmed using the second data set. Some of the indices for the second data set were marginally acceptable but the chi-square difference test comparing the theoretical model fit to the measurement model fit was not significant at p < .05. These results indicated that the theoretical model was validly accounting for the relationships between the construct variables in the paradigm.
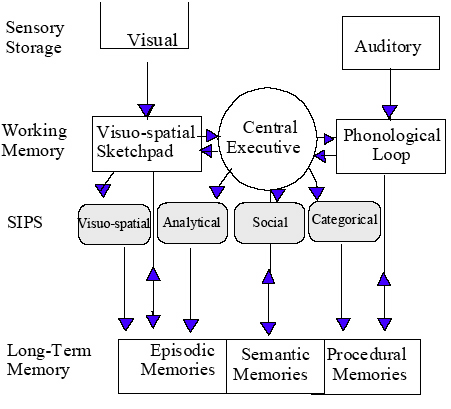
The most important finding in this study was the outcome of the confirmatory factor analysis resulting in an instrument to measure four out of the five strategical information-processing styles. Although the study did not confirm the verbal style, there is strong theoretical evidence that this style exists and further research is needed to develop and evaluate new indicator variables that will measure this construct. Figure 4 is a revision of the original hypothesized model minus the verbal style.
Figure 4 . Revised Hypothesized Model of the Four Strategical Information Processing Styles (SIPS)
Reducing the number of indicator variables and strengthening the visuo-spatial indicator variables can improve the SIPS instrument. The SIPS instrument used in the final test contained 65 variables. However, the confirmed model, which was developed by deleting variables from the larger model, contained 22 indicator variables and four latent constructs. The efficiency of the larger instrument could be improved by reducing the number of indicator variables in the assessment. Once the number of variables is reduced, confirmatory factor analysis should work very smoothly. According to Hatcher (1994) , confirmatory factor analysis should be performed on models containing between 20 and 30 indicator variables.
Further Research
Continued research with the confirmed instrument is necessary to improve the indicator variables and to produce a smaller more efficient instrument. Once the SIPS instrument is amended, further research is needed to determine what influence the preference for a strategical information processing style has on cognitive abilities, visual processing abilities, general knowledge, and academic performance. Establishing a relationship between the SIPS and cognitive and visual processing abilities is important because they share the same theoretical basis in cognitive psychology, as illustrated in the revised hypothesized SIPS model. Cognitive abilities involve the ability to process information through the senses, short-term memory and long-term memory. The information-processing style is based on the individual's preferred method of processing information, which has its roots in processing abilities. If a relationship could be established between the SIPS and general knowledge, then the SIPS could be used as a predictor of standardized test results. As a predictor of academic performance, the SIPS results could be used by educators to enhance the students' educational experiences and by undergraduate college students to improve their quality of learning.
Underpinned on the theory of the information processing paradigm and validated by confirmatory factor analysis, the strategical information processing style assessment should prove to be a useful tool for determining the strategies that individual students prefer to employ when processing information. The instrument could be used in the classroom, as a counseling tool, or as a screening device for selective programs, such as those found in the health care field. Use of this instrument will enhance the students' self-awareness and allow them to participate in their own learning. Once students are aware of their preferred strategical information processing styles, they may become cognizant of the different types of strategies that are available for success in the academic environment. After developing these strategies in the academic environment, the students will be able to continue to use these tools as they move into the dynamic workplace of the twenty-first century.
References
Averill, J. R. (1999, April) . Individual differences in emotional creativity: structure and correlates. Journal of Personality , 67, 331 (4).
Baddeley, A. (1992, January 31) . Working memory. Science , 255, 556-560.
Baddeley, A. (1993) . Working memory or working attention. In Baddeley, A. and Weiskrantz, L. Attention: Selection, Awareness, and Control (pp. 152-170). New York: Oxford University Press, Inc.
Baddeley, A. (1996) . Exploring the central executive. The Quarterly Journal of Experimental Psychology ,49A, 5-28.
Baddeley, A. D., & Hitch, G. (1977) . Working memory. In G. Bower (Eds.), Human Memory (pp. 199-239). New York: Academic Press, Inc.
Bentler, P.M. & Bonett, D. G. (1980) . Significance tests and goodness-of-fit in the analysis of covariance structures. Psychological Bulletin , 88, 588-606.
Blanton, B. B. (1998, Spring) . The application of the cognitive learning theory to instructional design. International Journal of Instructional Media , 25, (2), 171.
Bonner, J. (1988, Spring) . Implications of cognitive theory for instructional design: Revisited. Educational Communication and Technology Journal , 36, (1), 3-14.
Broadbent, D. E. (1958) . Perception and communication . New York: Oxford University Press.
Clark, J. M., & Paivio, A. (1991) . Dual coding theory and education. Educational Psychology Review , 3, 149-210.
Craik, F. I., & Lockhart, R. S. (1972) . Levels of processing: A framework for memory research. Journal of Verbal Learning and Verbal Behavior , 11, 671-684.
Fletcher, J. M., David, J. F., Stuebing, K. K., Shaywitz, B. A., Shaywitz, S. E., Shankweiler, D. O., Katz, L., & Morris, R. D. (1996) . Conceptual and methodological issues in construct definition. In G. R Lyon & N. A. Krasnegor (Eds.), Attention, Memory and Executive Function (pp. 17-42). Baltimore, Maryland: Paul H. Brookes Publishing Co.
Gagné, R. M. (1989) . Some reflections on learning and individual differences. In P. L. Ackerman, R. J. Sternberg, & R. Glaser (Eds), Learning and Individual Differences (pp. 1-11). NY, NY: W. H. Freeman and Company.
Gathercole, S. E. (1998) . The development of memory. Journal of child psychology psychiatry , 39, 3-27.
Hair, J. F., Anderson R. E., Tatham, R. L., & Black, W. C. (1998) . Multivariate data analysis (5th ed.). Englewood Cliffs, NJ: Prentice Hall.
Hatcher, L. (1994) . A step-by-step approach to using the SAS System for factoral analysis and structural equation modeling . Cary, NC: SAS Institute Inc.
Jacobson, R. (1998, Summer) . Teachers improving learning using metacognition with self-monitoring learning strategies. Education , 118, 579-591.
James, L.R., Mulaik, S.A., & Brett, J. M. (1982) . Causal analysis . Beverly Hills: Sage.
Kalyuga, S., Chandler, P., & Sweller, J. (1998, March) . Levels of expertise and instructional design. Human Factors , 40, (1), 1-17.
Kerlinger, F. N., & Lee, H. B. (2000) . Foundations of behavioral research (4th ed.). Orlando, FL: Harcourt College Publishers.
Logie, R. H. (1999, April) . Working memory. The Psychologist , 12, (4), 174-178.
Massaro, D. W., & Cowan, N. (1993) . Information processing models: Microscopes of the mind. Annual Review of Psychology , 44, 383-426.
Nicholls, M. E. R., & Wood, A. G. (1998) . The contribution of attention to the right visual field advantage for word recognition. Brain and Cognition , 38, 339-357.
Paivio, A. (1991) . Dual coding theory: Retrospect and current status. Canadian Journal of Psychology , 45, 255-287.
Parker, J. K. (1993, Sept-Oct) . Lecturing and loving it: Applying the informationprocessing model. The Clearing House , 67, (1), 8-12.
Posner, M. I., & Raichle, M. E. (1994) . Images of the mind . New York: W. H. Freeman and Company.
Roberts, M. J., Gilmore, D. J., & Wood, D. J. (1997, August) . Individual differences and strategy selection in reasoning. British Journal of Psychology , 88, 473 (20).
Rotenberg, V. S., & Weinberg, I. (1999, February) . Human memory, cerebral hemispheres, and the limbic system: A new approach. Genetics, Social and General Psychology , 125, 45 (1).
Sanders, A. F. (1990) . Issues and trends in the debate on discrete vs. continuous processing of information. Acta Psychologica , 74, 123-167.
Sehulster, J. R. (1995, Spring) . Memory styles and related abilities in presentation of self. American Journal of Psychology , 108, (1), 67-88.
Shepard, R., Fasko, D., & Osborne, F. H. (1999, Summer) . Intrapersonal intelligence: Affective factors in thinking. Education , 119, 663.
Sternberg, R. J. (1997) . Thinking styles . New York: Cambridge University Press.
Sternberg, R. J., & Kaufman, J. C. (1998, Annual) . Human abilities. Annual Review of Psychology , 49, 479-503.
Torgesen, J. K. (1996) . A model of memory from an information processing perspective: The special case of phonological memory. In G. R. Lyon & Krasnegor, N. A. (Eds.), Attention, Memory and Executive Function . (pp.157-184). Baltimore, Maryland: Paul H. Brookes Publishing Co.
Tulving, E. (1993) . Varieties of consciousness and levels of awareness in memory. In A. Baddeley & L. Weiskrantz (Eds.), Attention: Selection, Awareness, and Control (pp. 283-300). New York: Oxford University Press, Inc.
The Authors
Beverly A. Farrell, is Vice President for Academic Affairs, Our Lady of the Lake College, 7345 Perkins Road, Baton Rouge, Louisiana 70808. Phone: 225-768-1706/ Fax: 225-768-0811/ E-mail: bfarrell @ololcollege.edu .
Joe W. Kotrlik is a Professor in the School of Human Resource Education & Workforce Development, Louisiana State University, Baton Rouge, LA 70803-5477. Phone: 225-578-5753 / Fax 225-578-5755 / E-mail: kotrlik@lsu.edu .